

(All data & visualisations by ChartMill.com)
Daily Market Trend Analysis – November 21, 2025 (After Market Close)
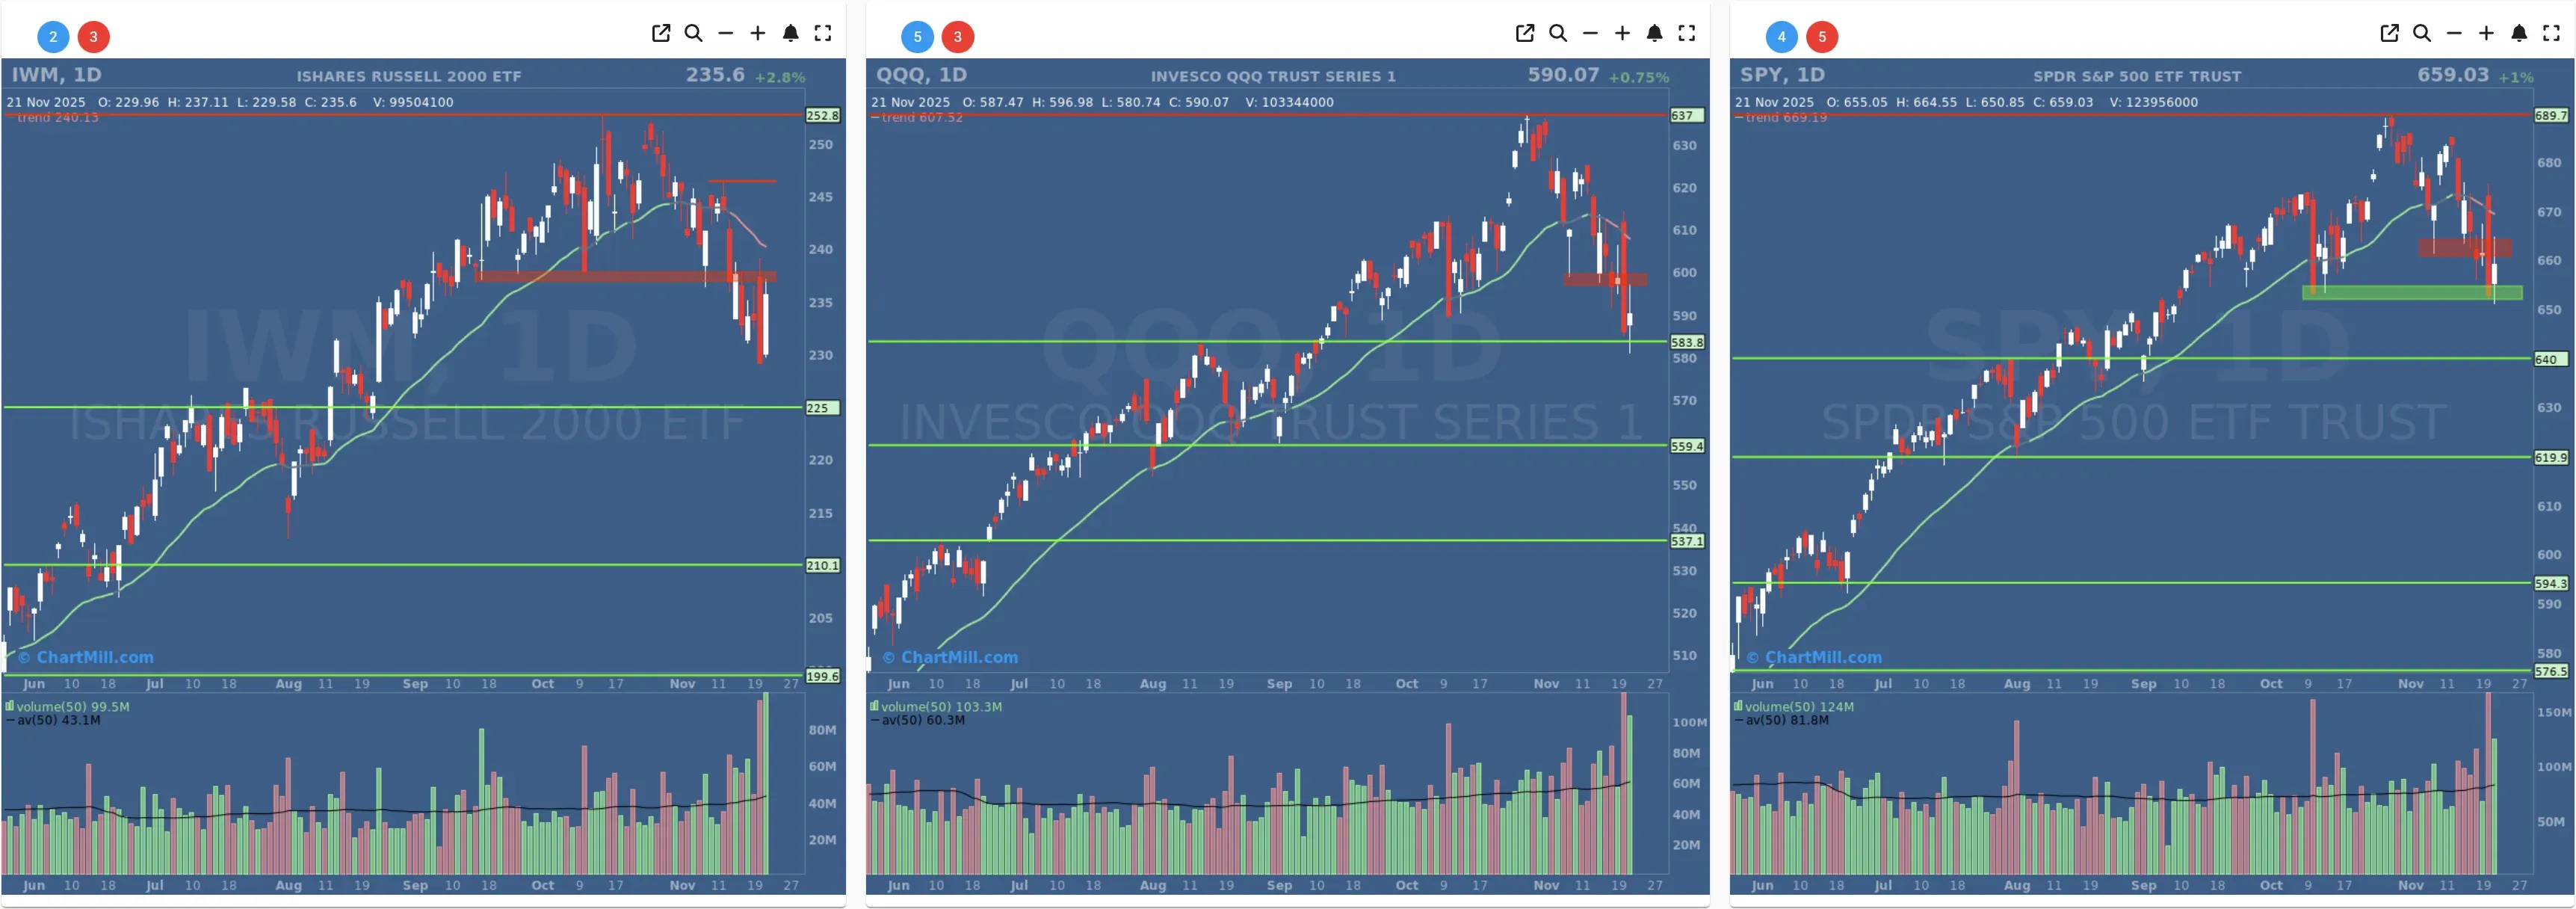
From a technical perspective, the major ETFs (IWM, QQQ, and SPY) all bounced convincingly off important support zones.
Short Term Trend
- Short-Term Trend: Negative (no change)
- Next Support at $652
- Next Resistance $660 - $670
- Volume: Well Above Average (50)
- Pattern: Up Day - Bouncing From Support
- Short-Term Trend: Negative (no change)
- Next Support at $583
- Next Resistance $600
- Volume: Well Above Average (50)
- Pattern: Up Day - Bouncing From Support
- Short-Term Trend: Negative (No Change)
- Next Support at $225
- Next Resistance at $236
- Volume: Far Above Average (50)
- Pattern: Up Day - Strong Close - Inside Day Candle
Long Term Trend

- Long-Term Trend: !!TREND CHANGE - Neutral!! (from positive) - NOT CONFIRMED (waiting for weekly candle close)
- Long-Term Trend: Positive (no change)
- Long-Term Trend: Positive (no change)
Daily Market Breadth Analysis – November 21, 2025 (After Market Close)
After several sessions of widespread weakness and declining breadth, Friday’s session delivered a striking reversal.
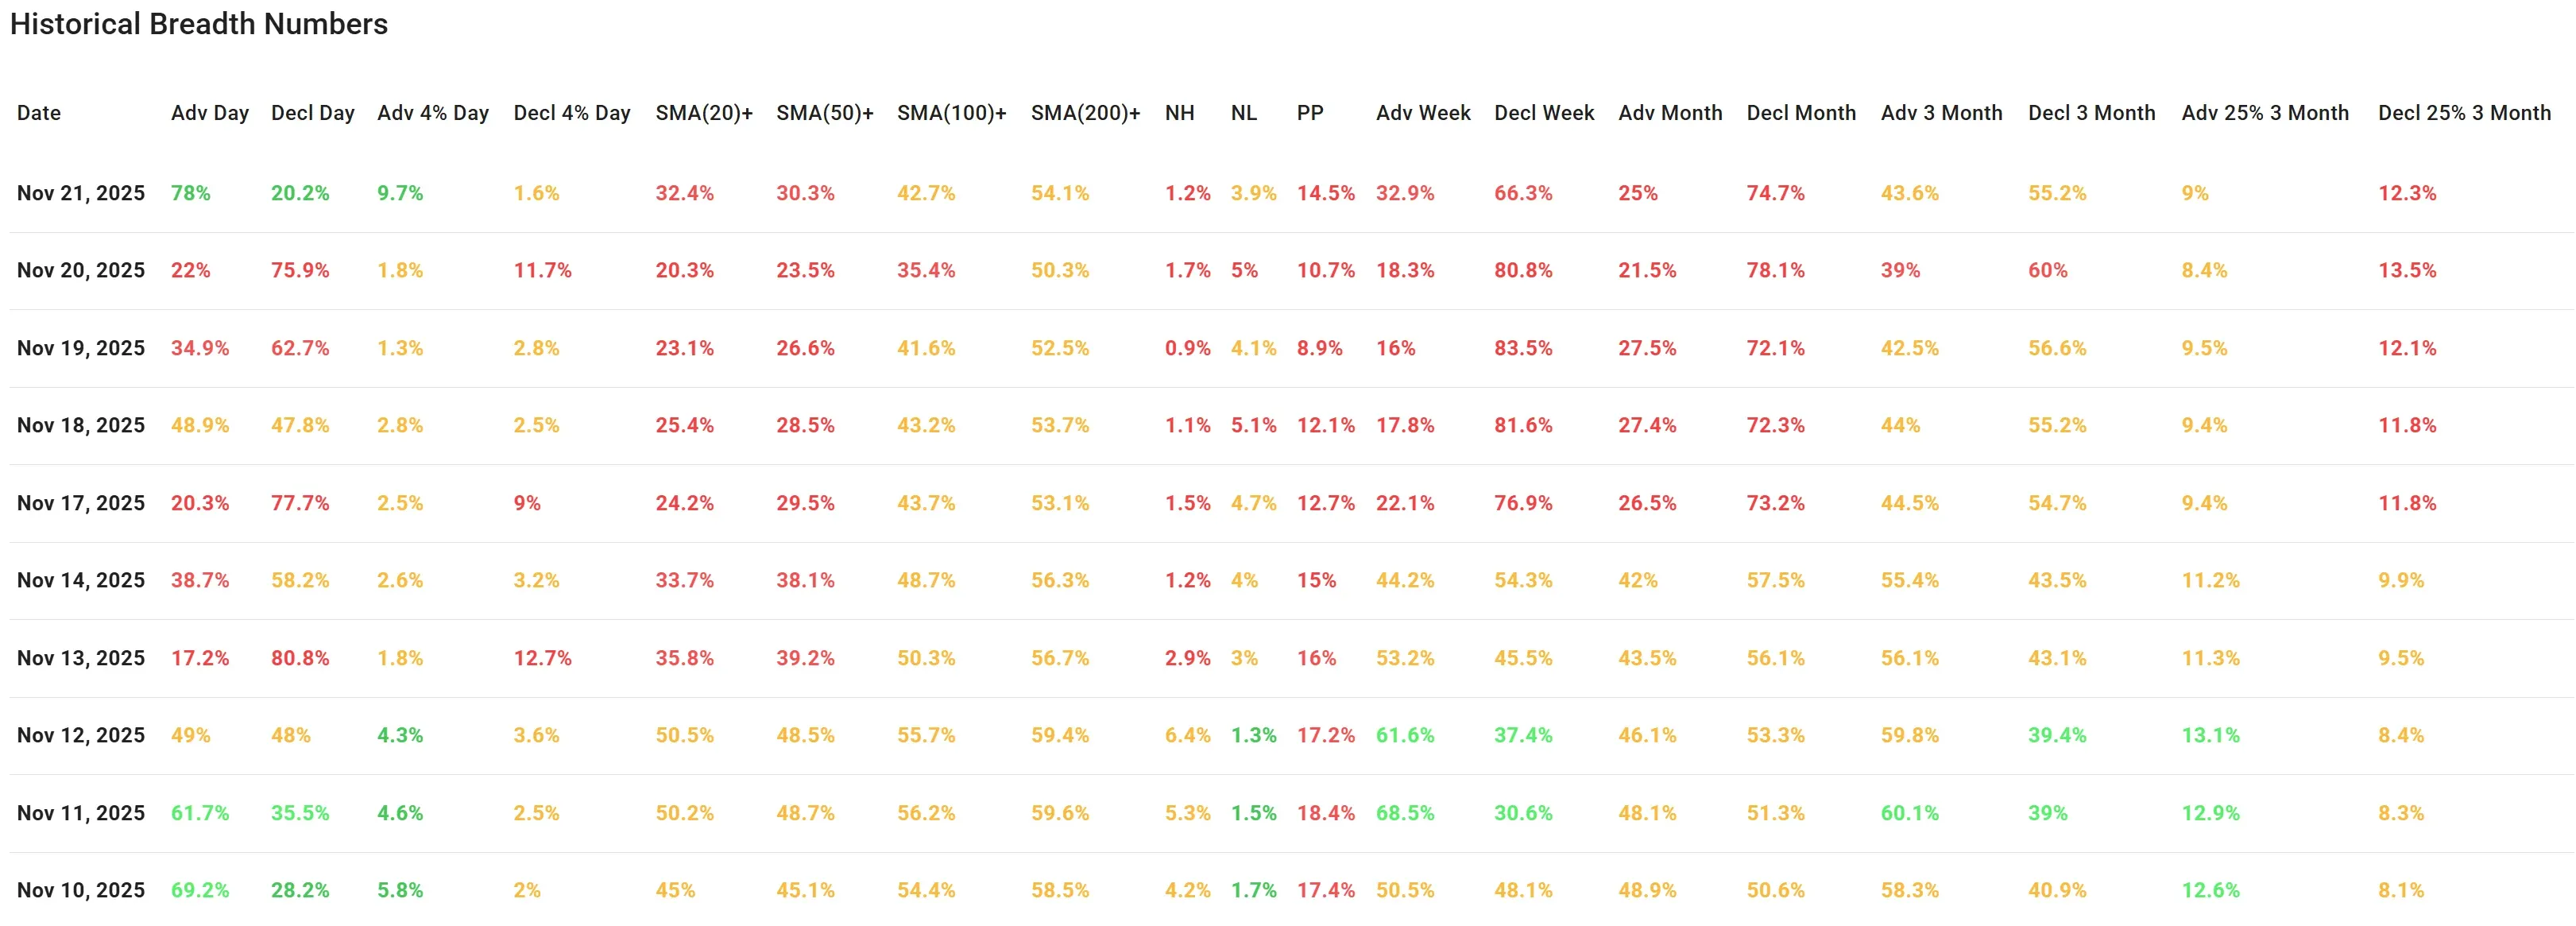
A remarkable 78% of stocks advanced, while only 20.2% declined, marking the strongest single-day advance participation in the past 10 sessions.
Additionally, 9.7% of stocks rose more than 4%, a figure not seen since early November.
This sharp recovery came just one day after breadth collapsed, on Thursday, only 22% of stocks advanced, with 11.7% dropping more than 4%. That stark contrast highlights just how volatile sentiment has been and how reactive the market currently is to key support and resistance zones.
From a technical perspective, the major ETFs (IWM, QQQ, and SPY) all bounced convincingly off important support zones:
-
IWM (Russell 2000): After breaking support earlier in the week, the index surged nearly 3% Friday, reclaiming the 235 area. However, prior breakdown zones around 240–242 may act as overhead resistance.
-
QQQ (Nasdaq 100): Rebounded off the 585–590 zone, though the recovery remains shallow compared to the steep pullback of the prior days.
-
SPY (S&P 500): Bounced cleanly off the highlighted support region near 650, avoiding a deeper breakdown toward the 640 level.
This technical reaction was mirrored in the breadth metrics:
-
New Highs (NH): Still depressed at 1.2%, showing little leadership at the top.
-
New Lows (NL): Fell slightly to 3.9%, an improvement but still elevated.
SMA Participation (20-day to 200-day): Remains weak:
-
Only 32.4% of stocks are above their 20-day SMA,
-
30.3% above the 50-day SMA,
-
With a slightly better 54.1% holding above the 200-day SMA.
These numbers, while marginally better than Thursday, are still far from healthy and indicate that the rebound, while strong in magnitude, lacks broad technical confirmation.
The percentage of stocks above key moving averages has barely improved, and the percentage of stocks making positive progress over the past month sits at a meager 25%, while three-month performance metrics continue to show more weakness than strength.
Broader Trend Assessment
Despite Friday’s bounce, market breadth continues to show signs of strain beneath the surface. Many of the recovery metrics still pale in comparison to where they were during early November. The rebound appears more like a short-term relief rally than the start of a renewed uptrend.
While it’s possible that Friday’s bounce marks the start of a stabilization phase, we have not yet seen enough improvement in the medium- and longer-term breadth indicators to confidently call for a positive shift in trend.
Breadth Trend Rating: Neutral with a negative bias

Momentum has returned temporarily, but the underlying breadth trend remains weak and needs sustained improvement to shift the broader picture.
Kristoff - ChartMill
Next to read: Wall Street Rebounds but Confidence Remains on a Short Leash