
(All data & visualisations by ChartMill.com)
Daily Market Trend Analysis – November 12, 2025 (After Market Close)
Short Term Trend
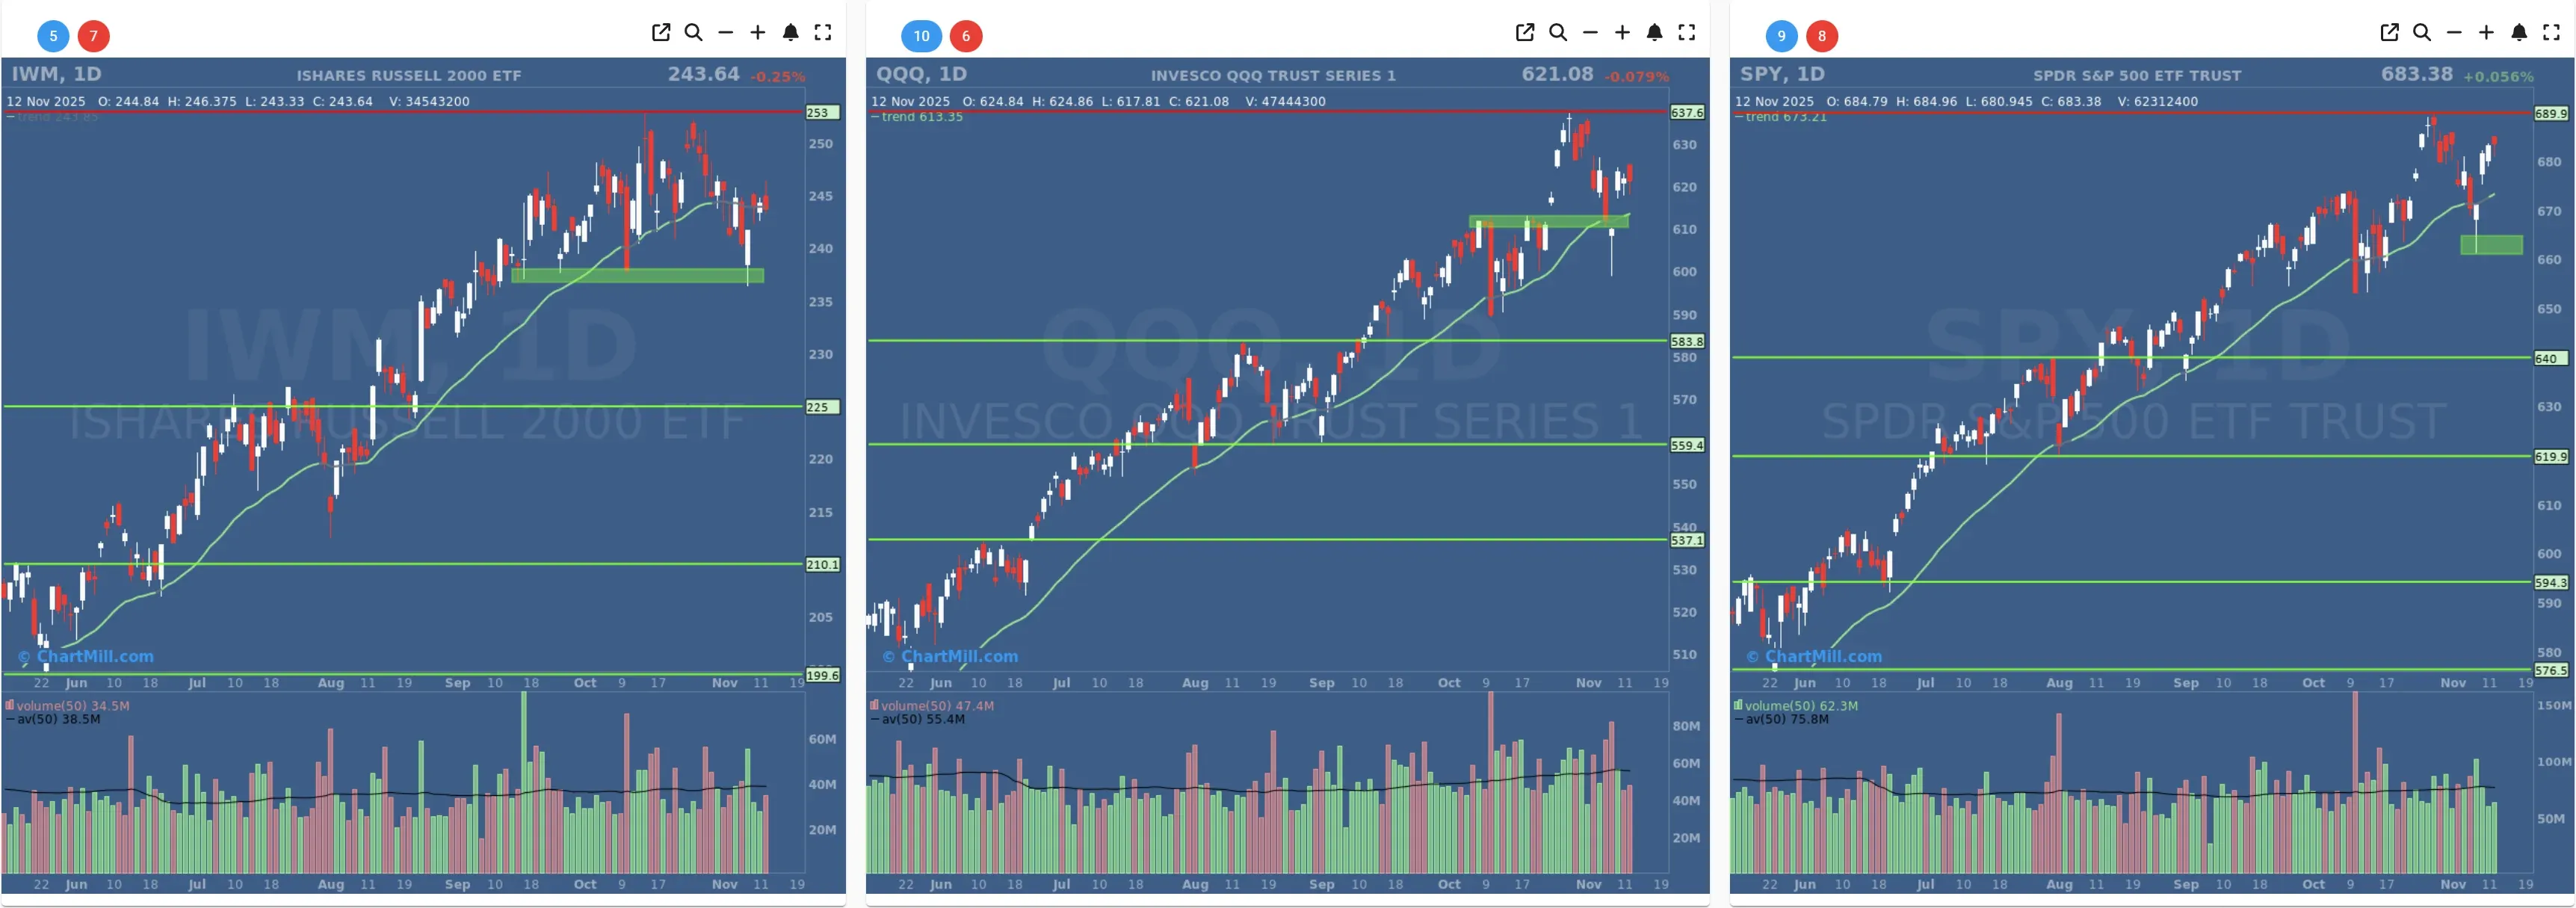
- Short-Term Trend: !!TRENDCHANGE!! Positive (From Neutral)
- Next Support at $653
- Next Resistance $674
- Volume: Below Average (50)
- Pattern: Down Day - Hanging Man Pattern
- Short-Term Trend: !!TRENDCHANGE!! Positive (From Neutral)
- Next Support at $610
- Next Resistance $637
- Volume: Below Average (50)
- Pattern: Down Day
- Short-Term Trend: Neutral (No Change)
- Next Support at $237
- Next Resistance at $253
- Volume: Slightly Below Average (50)
- Pattern: Down Day
Long Term Trend
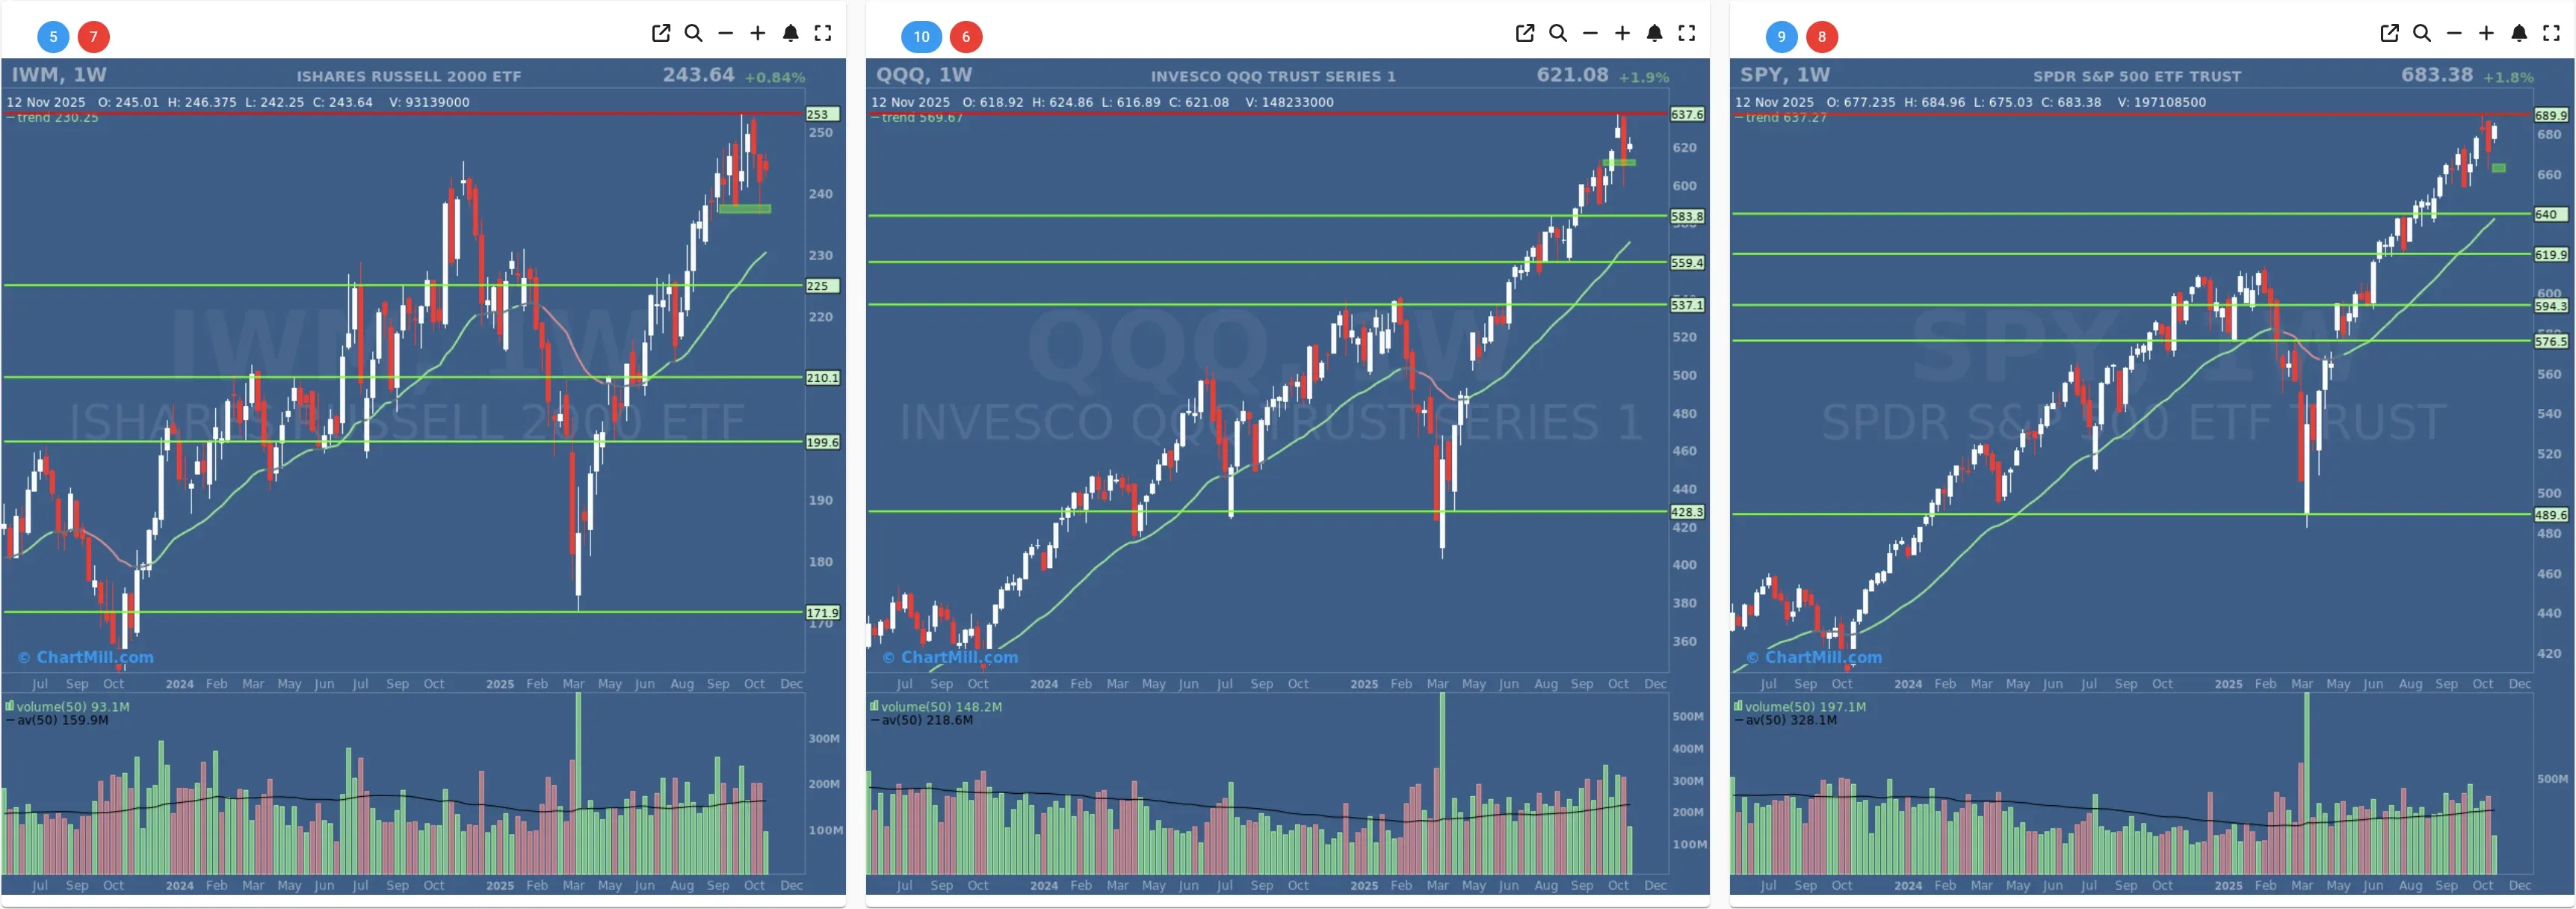
- Long-Term Trend: Positive (no change)
- Long-Term Trend: Positive (no change)
- Long-Term Trend: Positive (no change)
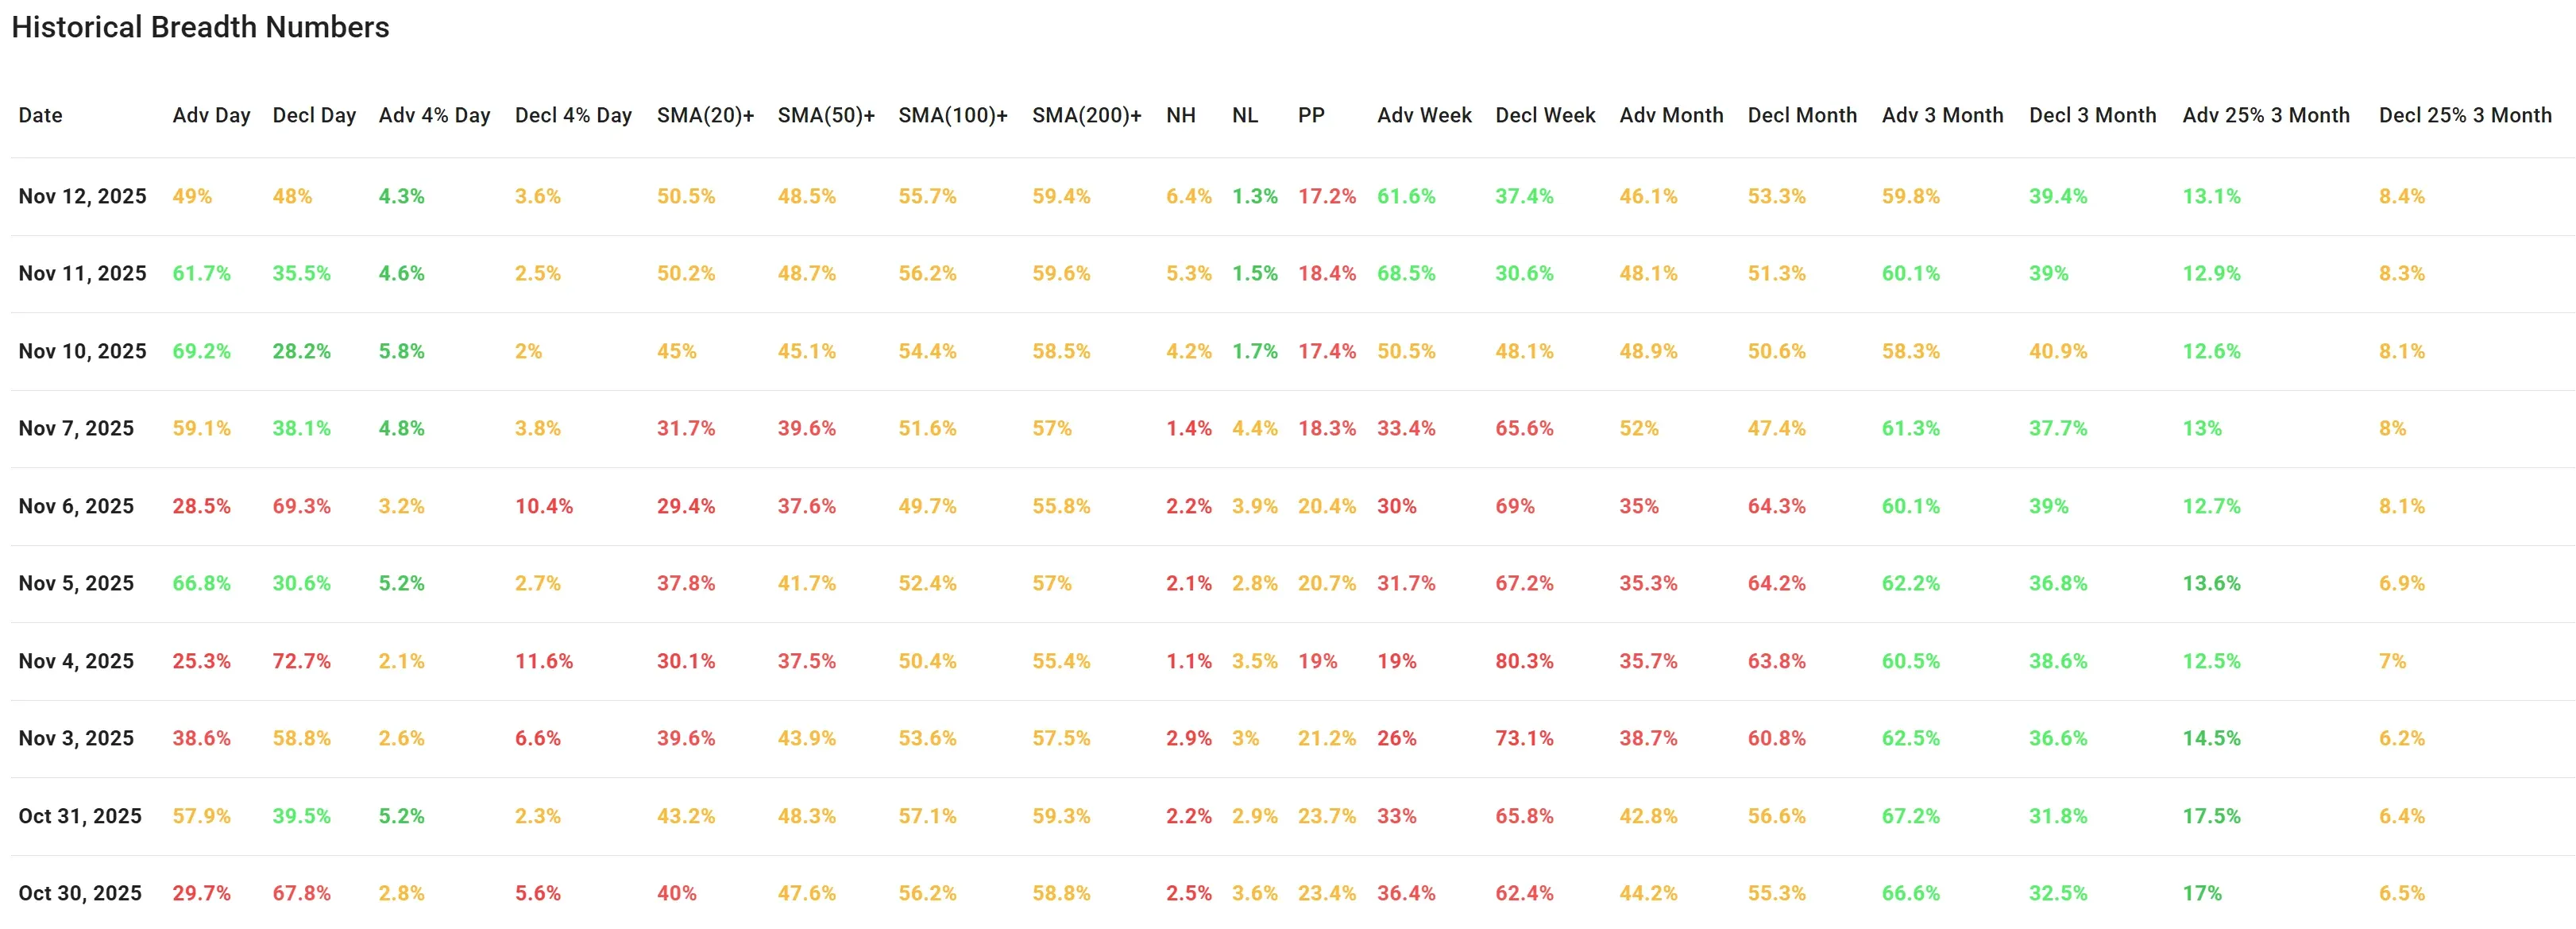
Daily Market Breadth Analysis – November 12, 2025 (After Market Close)
After Tuesday’s robust showing - with 61.7% of stocks advancing and just 35.5% declining - market breadth took a breather on Wednesday, November 12. The advance-decline ratio settled nearly flat at 49% vs. 48%, a notable drop in momentum. Importantly, while this doesn't erase the gains from earlier in the week, it does raise a red flag about the sustainability of the rebound.
Key Observations:
Advancers and Decliners:
The advancing share dropped to 49% from Tuesday’s 61.7%, while decliners crept up to 48%. This nearly even split indicates a more indecisive market tone.
4% Movers:
The percentage of stocks gaining more than 4% held steady at 4.3%, similar to the previous sessions. However, the percentage of stocks declining more than 4% increased to 3.6% (from 2.5%), signaling more pronounced losses in the weaker names.
SMA Participation (Short- and Long-Term):
Stocks above key moving averages remain stagnant:
- Above 20SMA: 50.5% (unchanged from 50.2%)
- Above 50SMA: 48.5% (flat)
- Above 100SMA: 55.7% (up slightly)
- Above 200SMA: 59.4% (slight drop from 59.6%)
These percentages suggest that while the short-term bounce improved technical participation earlier this week, follow-through has now stalled.
New Highs vs. New Lows (NH/NL):
- NH: 6.4% (improved from 5.3%)
- NL: 1.3% (declined from 1.5%)
The positive spread here supports the idea that overall damage is limited and the number of stocks achieving new highs continues to outpace those making new lows — albeit modestly.
Weekly & Monthly Breadth Trends:
- Weekly Advance: 61.6% (down from 68.5%)
- Monthly Advance: 46.1% (from 48.1%)
- Decliners over the month: still high at 53.3%
This cooling-off reflects that the broader base of the rally may be narrowing again.
Three-Month Breadth Stability:
These longer-term figures are holding steady:
- Advancing 3M: 59.8%
- Declining 3M: 39.4%
- Advancing >25% in 3M: 13.1% (up slightly)
- Declining >25% in 3M: 8.4% (unchanged)
The uptick in strong performers (13.1%) suggests some leadership remains intact, but broad participation is not accelerating.
Contextual Takeaway:
Wednesday’s pause in breadth doesn’t yet signal a reversal, but it does cool the enthusiasm from earlier in the week. With a mix of modest new highs, stalled moving average participation, and a softer PP reading, the data hints at consolidation rather than continued upside, unless stronger follow-through appears soon.
While there was no major economic data released Wednesday to explain the softer internals, it's possible the market is entering a wait-and-see mode ahead of Thursday’s inflation numbers or upcoming Fed commentary.
Breadth Trend Rating: Neutral with a Positive Bias

Momentum from early in the week remains partially intact, but today’s flattening breadth metrics reduce conviction. The trend is no longer strongly bullish but still skews slightly positive unless further deterioration occurs.
Kristoff - ChartMill
Next to read: Wall Street Searches for Balance as AMD Steals the Spotlight