

(All data & visualisations by ChartMill.com)
Daily Market Trend Analysis – November 11, 2025 (After Market Close)
Inside day candles for QQQ and IWM
Short Term Trend
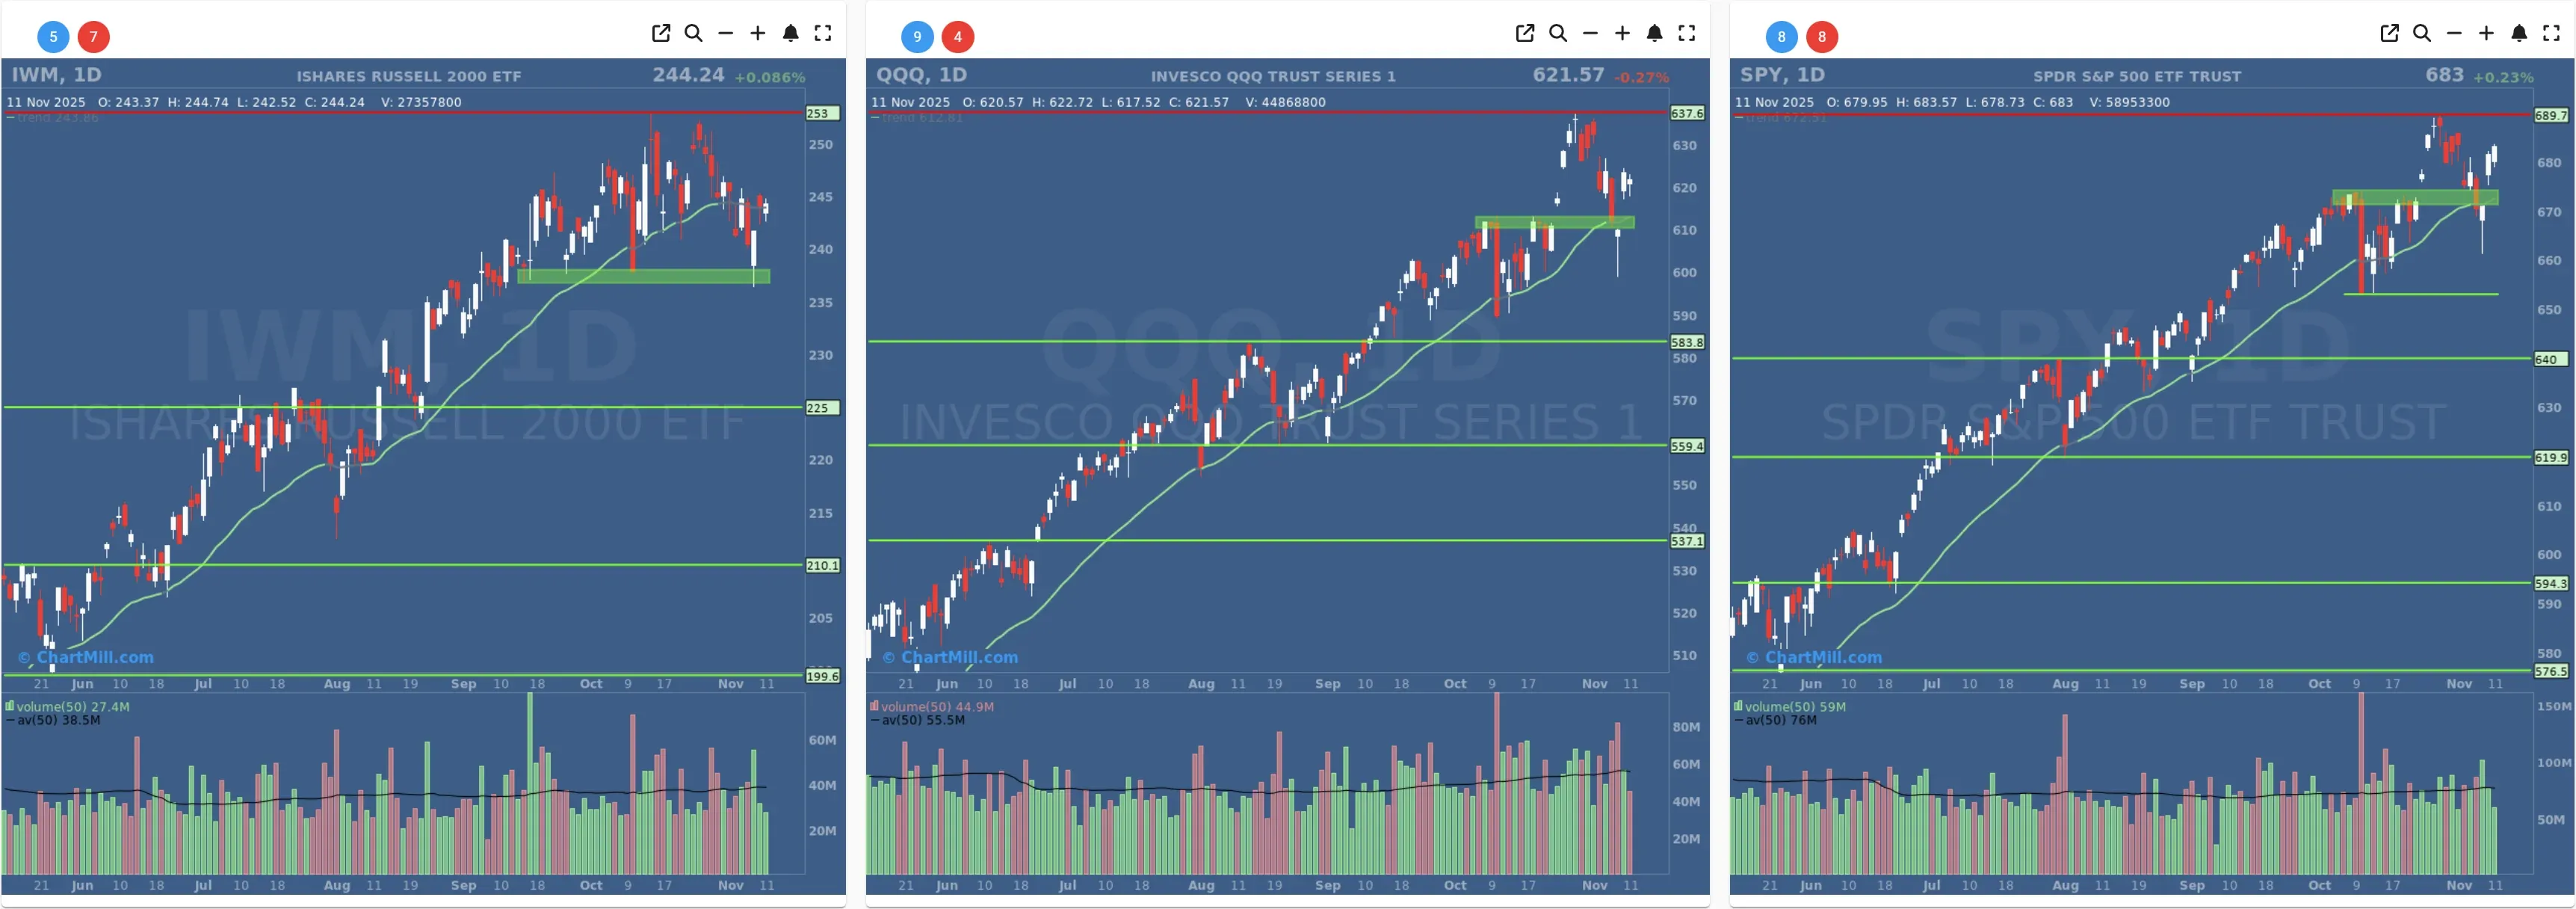
- Short-Term Trend: Neutral (No Change)
- Next Support at $653
- Next Resistance $674
- Volume: Below Average (50)
- Pattern: Up Day
- Short-Term Trend: Neutral (No Change)
- Next Support at $610
- Next Resistance $637
- Volume: Below Average (50)
- Pattern: Up Day - Inside Day Candle
- Short-Term Trend: Neutral (No Change)
- Next Support at $237
- Next Resistance at $253
- Volume: Well Below Average (50)
- Pattern: Up Day - Inside Day Candle
Long Term Trend
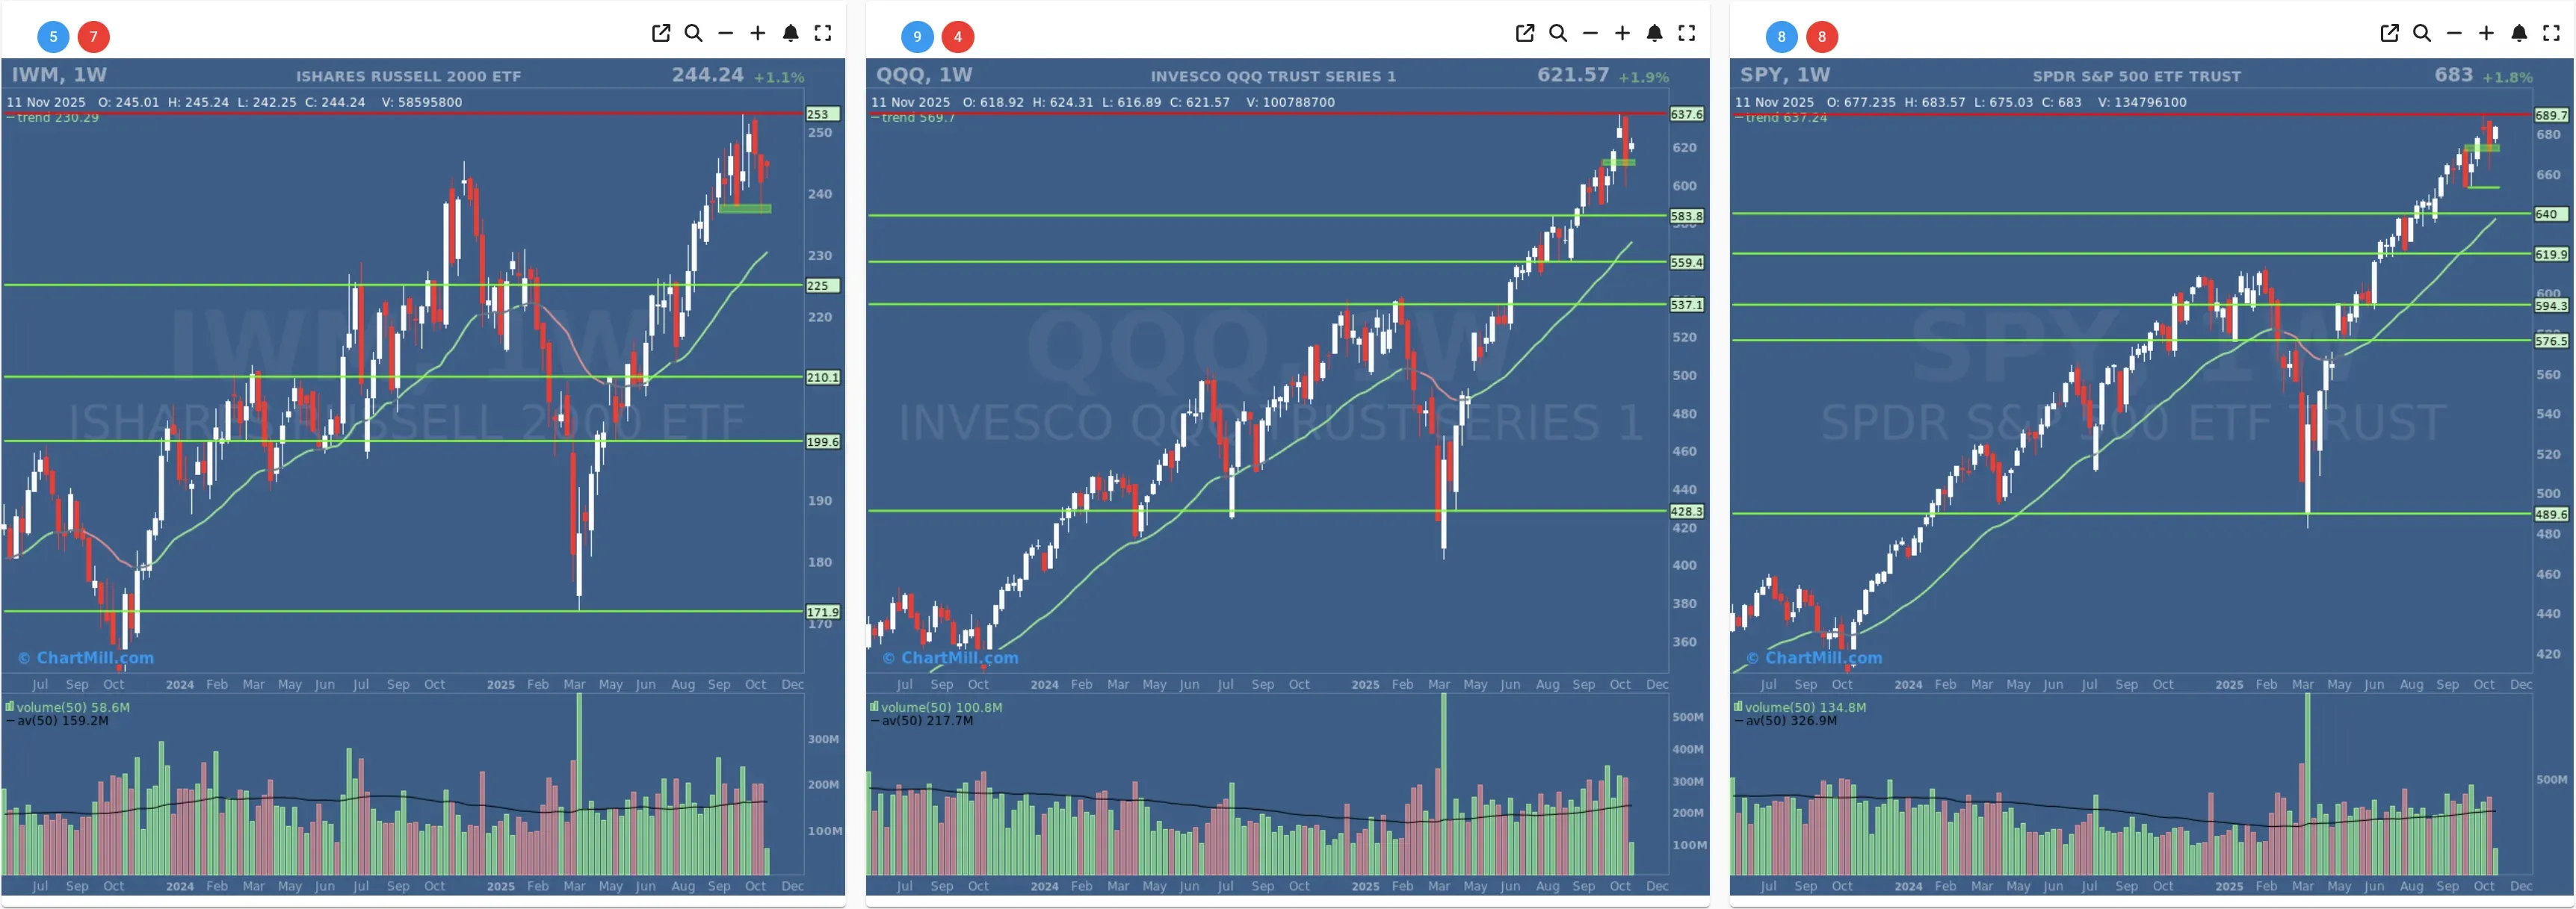
- Long-Term Trend: Positive (no change)
- Long-Term Trend: Positive (no change)
- Long-Term Trend: Positive (no change)
Daily Market Breadth Analysis – November 11, 2025 (After Market Close)
After Monday's strong session, Tuesday’s market breadth remained constructive, though signs of deceleration are emerging. While breadth remains positive overall, participation has narrowed slightly, and follow-through strength was moderate rather than broad-based.
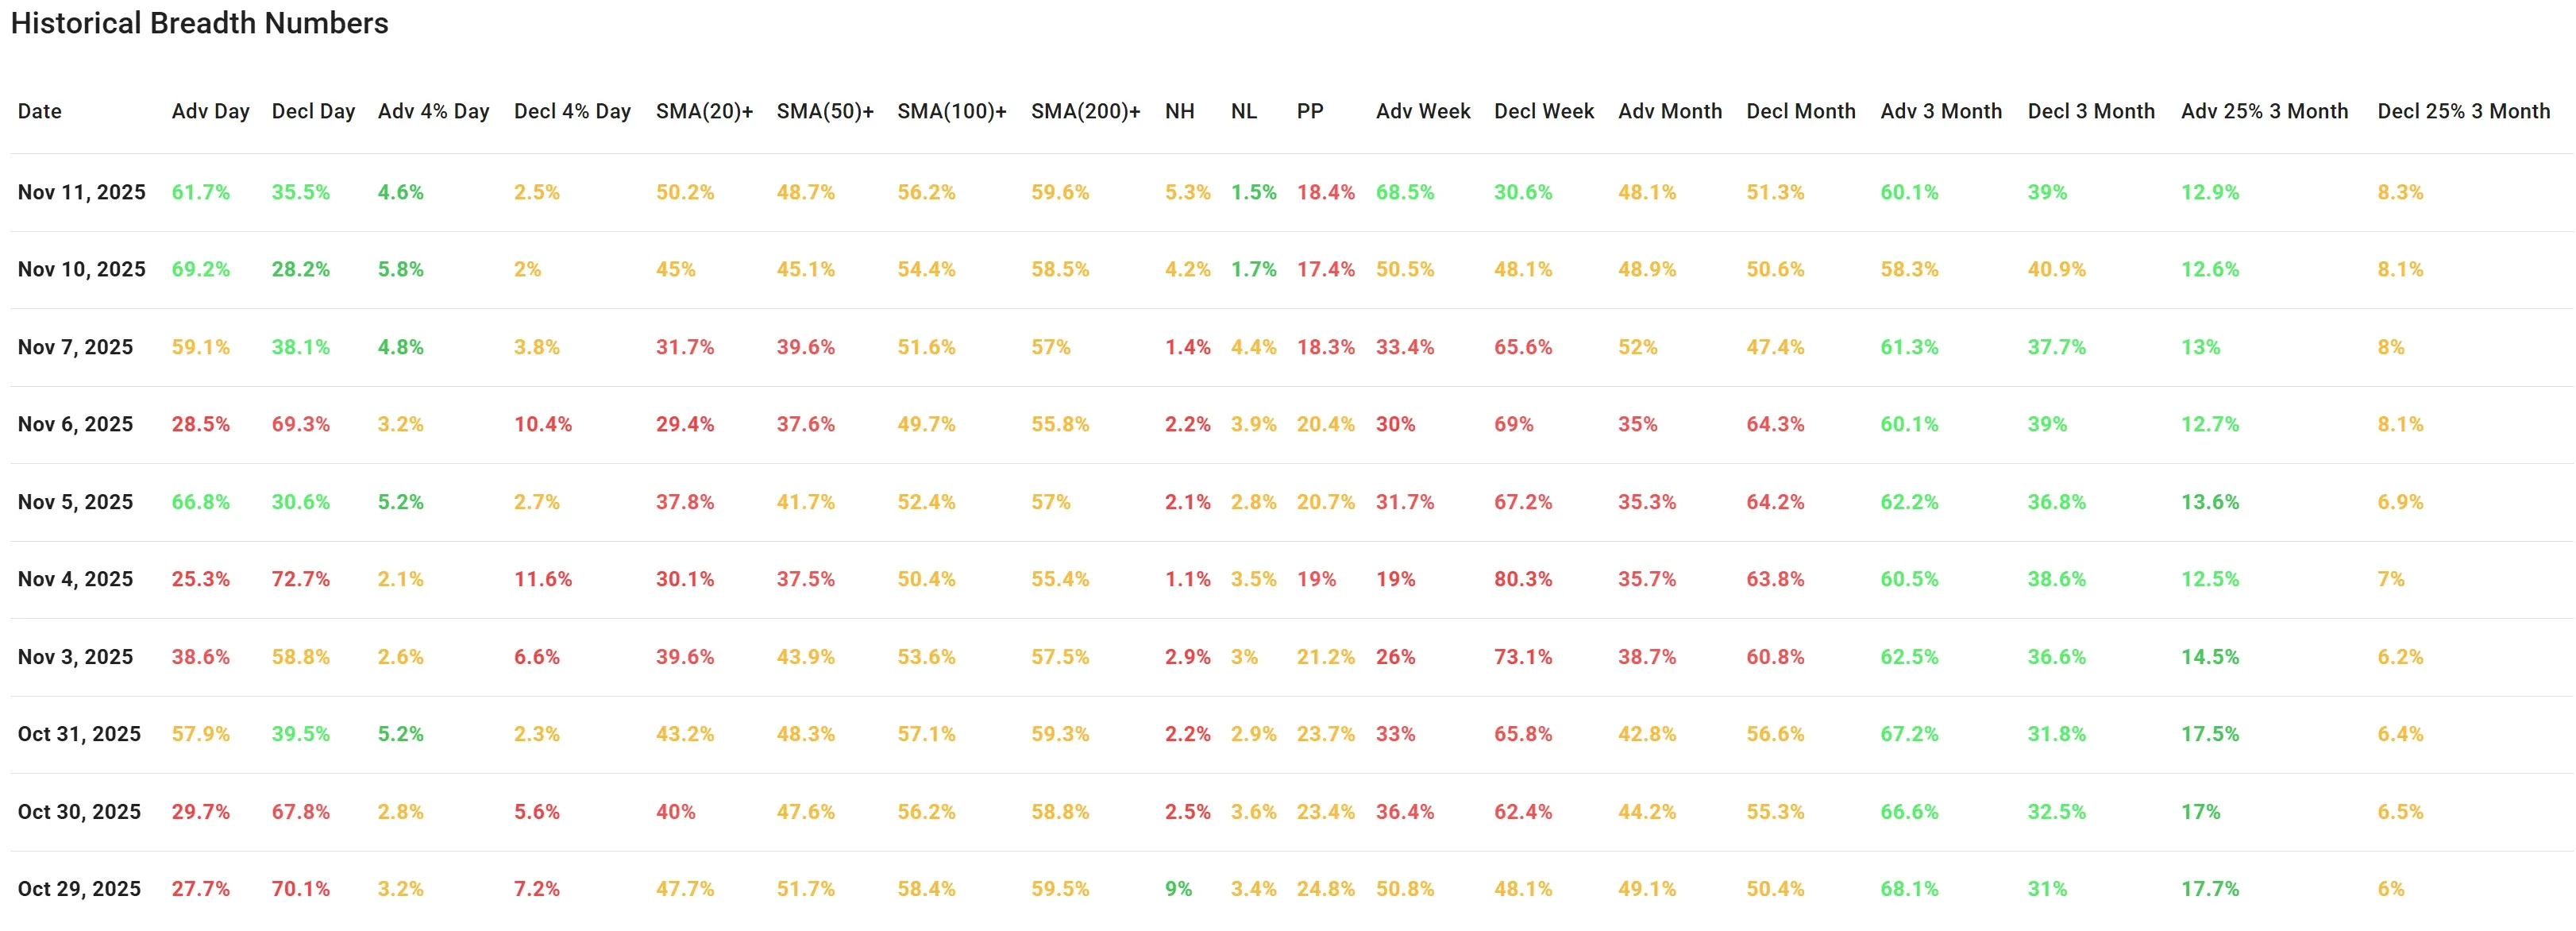
Tuesday’s session saw a modest cooldown in breadth after Monday's sharp rebound. The percentage of advancing stocks dipped to 61.7%, down from 69.2% the day before. While still solidly positive, this marks a notable deceleration in bullish participation.
Notably, only 4.6% of stocks advanced more than 4%, down from 5.8% on Monday, signaling fewer outsized gainers. Meanwhile, the percentage of stocks down more than 4% ticked up slightly to 2.5%, though still muted.
In terms of stocks trading above key moving averages:
-
SMA(20): rose to 50.2%, breaking above the key halfway mark for the first time since late October.
-
SMA(50): improved marginally to 48.7% from 45.1%.
-
SMA(100): gained slightly to 56.2%.
-
SMA(200): at 59.6%, a modest rise from Monday's 58.5%.
This slow but steady improvement across all SMA categories reflects a constructive shift in intermediate-term technical posture.
New Highs vs. New Lows showed a slight uptick in optimism:
-
New Highs (NH): 5.3%, up from 4.2%.
-
New Lows (NL): 1.5%, the lowest in the past 10 days.
On a weekly basis, breadth expanded again:
-
Advancing Week: 68.5% (up from 50.5%)
-
Declining Week: 30.6% (down from 48.1%)
Monthly metrics, however, remain mixed and signal lingering caution:
-
Advancing Month: slipped to 48.1% from 48.9%.
-
Declining Month: rose to 51.3% from 50.6%.
Three-month breadth remains constructive:
-
Advancing 3-Month: 60.1%
-
Declining 3-Month: 39%
-
Advancing 25% in 3 Months: 12.9% (flat vs. 12.6%)
-
Declining 25% in 3 Months: slightly higher at 8.3%
Interpretation & Context:
Tuesday’s action continues to support the narrative of improving market breadth, though at a more tempered pace than Monday. The short-term surge in participation has not fully reversed prior weakness but has stabilized key breadth metrics.
The rise in stocks above the 20/50/100-day SMAs is particularly encouraging, signaling that recent strength is lifting more names into constructive technical territory. However, the drop in 4% gainers suggest momentum may be slowing.
This type of pause is not unusual following strong up days and does not yet suggest a reversal. But it underscores the need to see continued improvement, especially in the percentage of stocks making new highs and strong breakouts, to sustain confidence in a broader uptrend.
No significant macroeconomic news or earnings surprises emerged during Tuesday's session that would have dramatically altered sentiment, allowing this breadth action to be interpreted primarily as internal market dynamics.
Breadth Trend Rating: Positive

The market breadth trend remains constructive, with signs of follow-through from Monday's strength. However, the lack of acceleration and still-fragile longer-term participation metrics suggest caution is still warranted.
Kristoff - ChartMill
Next to read: Dow Jones Hits Record as Shutdown Deal Nears, AI Sector Feels the Heat