

(All data & visualisations by ChartMill.com)
Daily Market Trend Analysis – November 18, 2025 (After Market Close)
Negative short term trend confirmation (second day) for IWM
Short Term Trend

- Short-Term Trend: Neutral (No Change)
- Next Support at $660
- Next Resistance $685
- Volume: Above Average (50)
- Pattern: Down Day - Triple Bottom - Clear upper and lower candle wicks (nervousness)
- Short-Term Trend: Neutral (No Change)
- Next Support at $600
- Next Resistance $627
- Volume: Slightly Above Average (50)
- Pattern: Down Day - Clear upper and lower candle wicks (nervousness)
- Short-Term Trend: Negative (No Change)
- Next Support at $225
- Next Resistance at $236
- Volume: Well Above Average (50)
- Pattern: Down Day - Lost Support - Weak Candle Close
Long Term Trend
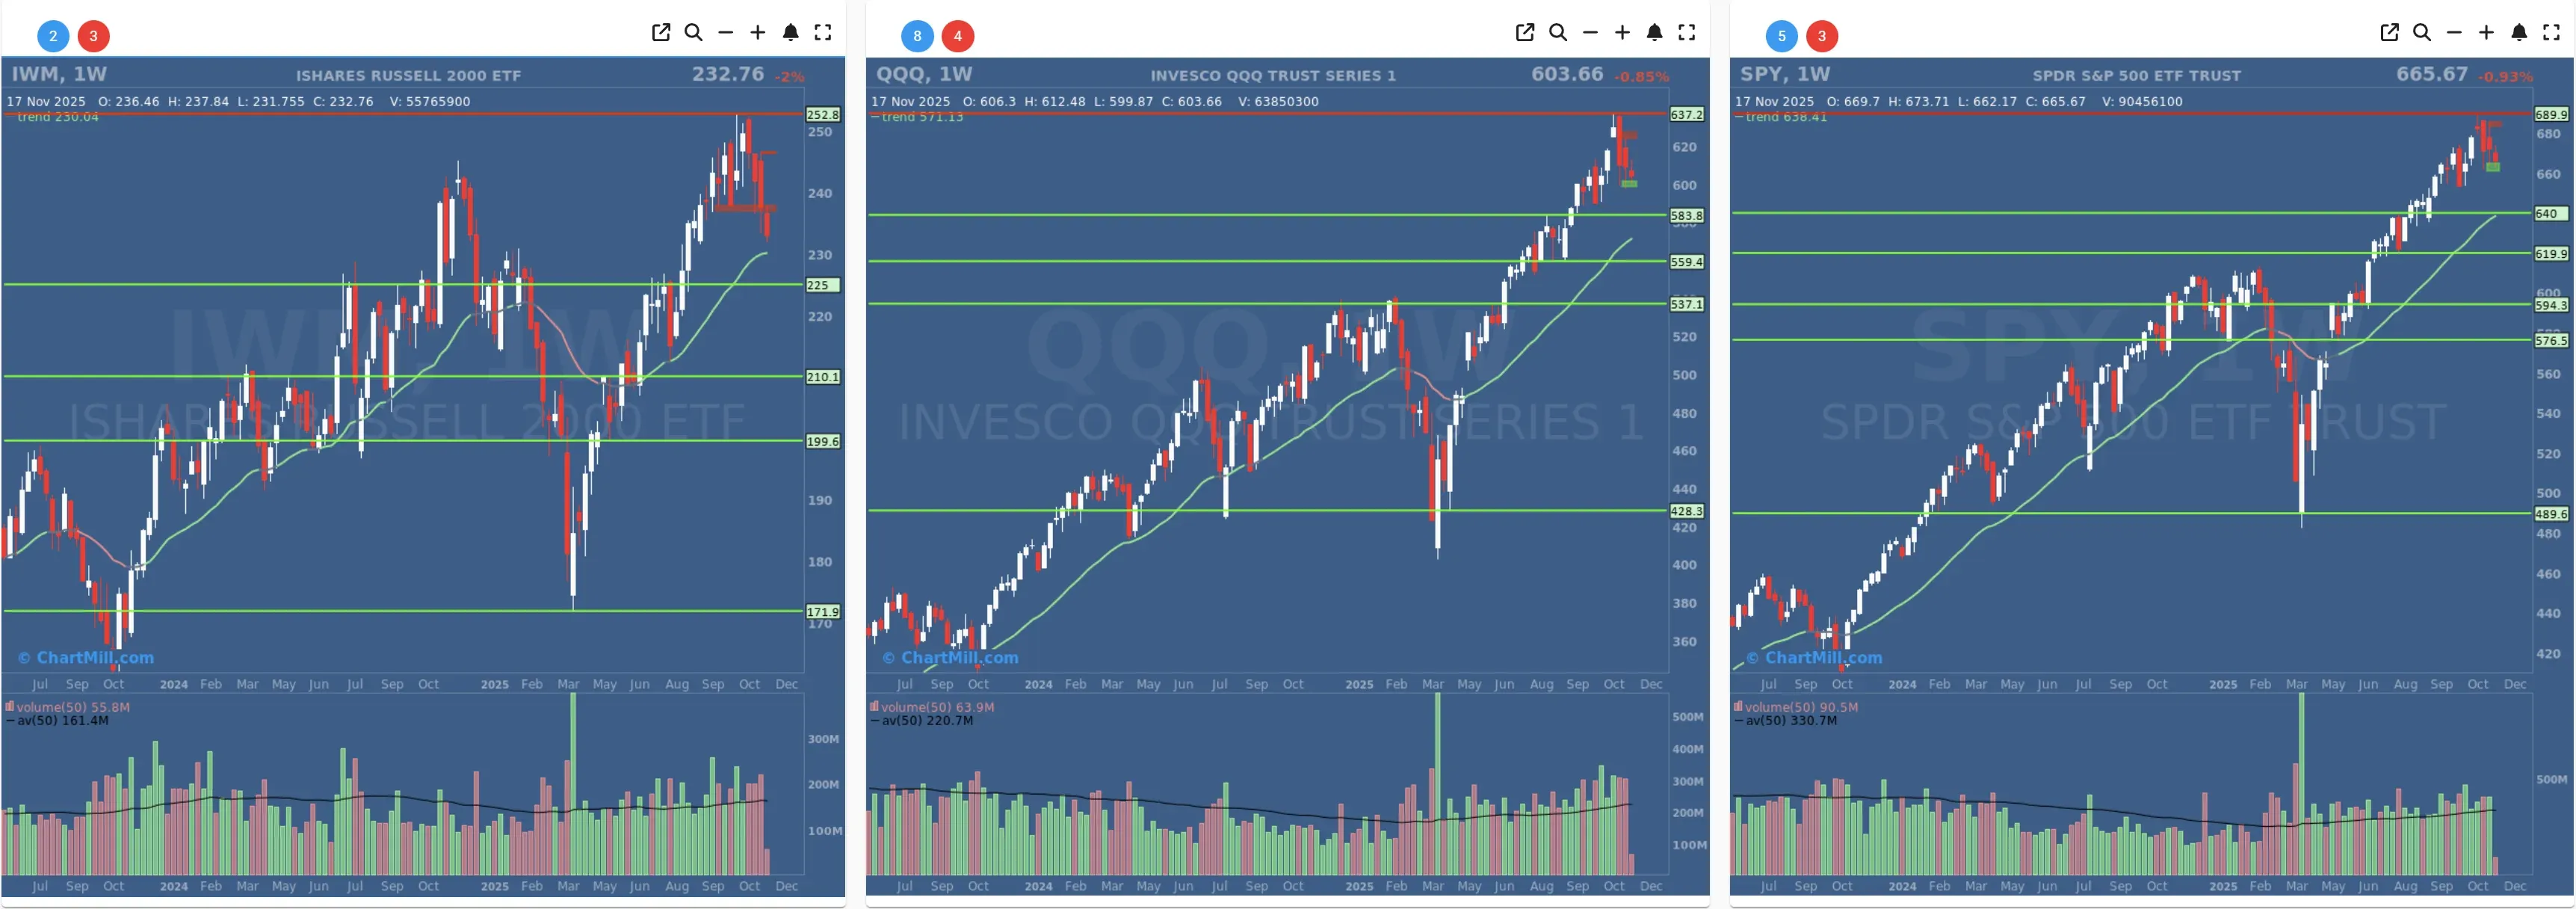
- Long-Term Trend: Positive (no change)
- Long-Term Trend: Positive (no change)
- Long-Term Trend: Positive (no change)
Daily Market Breadth Analysis – November 18, 2025 (After Market Close)
Monday’s session extended the weakness that first re-emerged on Friday. The deterioration is not dramatic, but it is consistent, and that consistency now matters more than any single day’s read.

Advancers vs. Decliners: Selling Regains Control
-
Adv Day: 20.3% (down sharply from Friday’s 38.7%)
-
Decl Day: 77.7% (up from 58.2%)
Friday already showed a tilt toward weakness, but today the imbalance amplified significantly. Fewer than one in four stocks advanced, marking the weakest daily adv/decl balance since Nov 13.
This confirms that Friday’s softness was not a one-off rebound failure but the start of an expanding short-term downwave.
- Adv 4% Day: 2.5% (vs. 2.6% Friday)
- Decl 4% Day: 9% (vs. 3.2% Friday)
The spike in 4% decliners shows broadening downside momentum.
Moving Averages: Short-Term Damage Accelerates, Medium-Term Weakens
-
SMA(20)+: 24.2%, a decisive drop from Friday’s 33.7%
-
SMA(50)+: 29.5%, also weaker
-
SMA(100)+: 43.7%, drifting lower
-
SMA(200)+: 53.1%, slightly softer but still above the 50% threshold
Friday hinted that the 20-day metric was beginning to fracture after losing its prior recovery. Monday confirms that deterioration: only about one in four stocks now trades above the 20-day average.
This is typically the first place weakness shows up, and today’s decline aligns with the downward turn already visible on Nov 14.
The medium-term (50- and 100-day) metrics continue their slow fade, consistent with the weakening internal trend highlighted last week.
Long-term structure (200-day) remains intact but is no longer improving, an important shift.
New Highs/New Lows: New Lows Expand Again
-
NH: 1.5% (up slightly from 1.2%)
-
NL: 4.7% (up from 4%)
The spread between highs and lows widened again. It is modest, but combined with the SMA deterioration, it signals a weakening tone that is becoming broad-based.
Weekly & Monthly Trends: Week Weakens Further
-
Adv Week: 22.1% (down from 44.2%)
-
Decl Week: 76.9% (up from 54.3%)
This is an important update: the weekly structure, which was still neutral on Friday, has now flipped decisively negative.
-
Adv Month: 26.5% (down)
-
Decl Month: 73.2% (up)
The monthly deterioration is persistent and now reaches levels typical of protracted corrective phases.
Three-Month View: Still Stable, But Losing Momentum
-
Adv 3M: 44.5% (down from 55.4%)
-
Decl 3M: 54.7% (up from 43.5%)
This is a notable shift.
The 3-month view had been one of the more resilient breadth components throughout recent instability. Monday’s sharp rotation - almost reversing Friday’s entire gain - suggests that the intermediate backdrop is beginning to roll over.
-
Adv 25% 3M: 9.4% (lower)
-
Decl 25% 3M: 11.8% (higher)
More stocks are now 25% off their 3-month highs than those gaining 25% over that period.
That marks a meaningful sentiment transition.
Putting It All Together: What Changed Since Friday?
Friday’s reading suggested:
- Short-term weakness re-emerging
- Medium-term wavering
- No collapse, but no traction on attempted stabilization
Monday confirms:
-
Weakness is not transitory
-
Downside pressure is broadening
-
Short-term and weekly trends now decisively negative
-
Intermediate-term (3M) finally showing strain
-
Long-term trend bending but not broken
This pattern is typical of markets entering a controlled, grinding correction, not a panic-driven breakdown.
No major news catalysts influenced the session; the weakness appears to be primarily internal and sentiment-driven rather than headline-driven.
Breadth Trend Rating: Negative
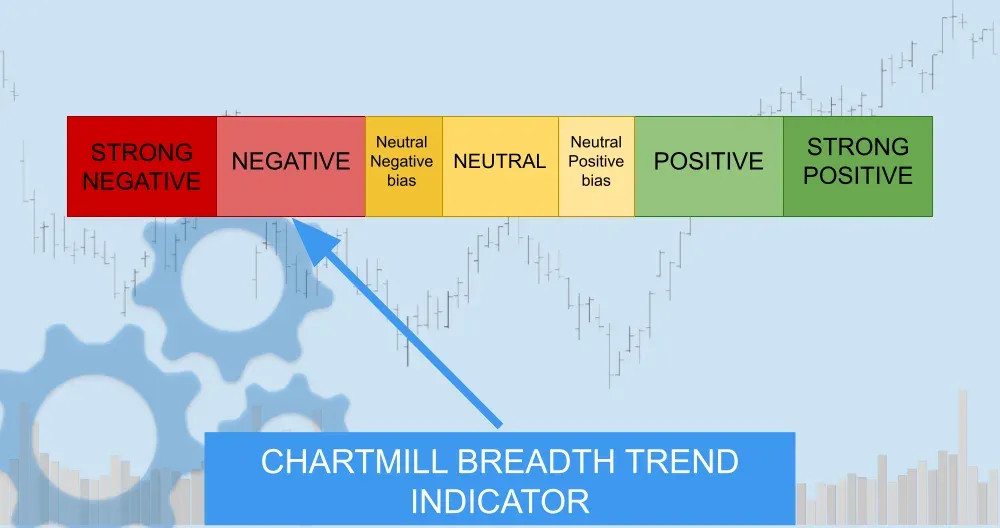
Not yet *“very negative,” *but clearly worse than the neutral-negative zone seen last week. The combination of short-term breakdowns and weekly deterioration moves the market one step deeper into negative territory.
Kristoff - ChartMill
Next to read: Wall Street Stumbles Ahead of Nvidia’s Big Moment