

(All data & visualisations by ChartMill.com)
Daily Market Trend Analysis – November 20, 2025 (After Market Close)
Selling pressure intensified across the board with weak internals confirming the technical breakdowns seen in major indices
Short Term Trend

- Short-Term Trend: Negative (no change)
- Next Support at $652
- Next Resistance $660 - $670
- Volume: Far Above Average (50)
- Pattern: Heavy Down Day - Very Weak Candle Close
- Short-Term Trend: Negative (no change)
- Next Support at $583
- Next Resistance $600
- Volume: Far Above Average (50)
- Pattern: Heavy Down Day - Very Weak Candle Close
- Short-Term Trend: Negative (No Change)
- Next Support at $225
- Next Resistance at $236
- Volume: Far Above Average (50)
- Pattern: Heavy Down Day - Very Weak Candle Close
Long Term Trend

- Long-Term Trend: !!TREND CHANGE - Neutral!! (from positive) - NOT CONFIRMED (waiting for weekly candle close)
- Long-Term Trend: Positive (no change)
- Long-Term Trend: Positive (no change)
Daily Market Breadth Analysis – November 20, 2025 (After Market Close)
Market action on Thursday confirmed and deepened the deterioration already underway.

Just 22% of stocks advanced on the day, while 75.9% declined, a sharp drop from Wednesday’s 34.9% advancers and 62.7% decliners. The number of stocks posting strong advances (up 4%+) was a meager 1.8%, while 11.7% of stocks dropped by at least 4%.
Key Weak Points:
Short-Term Trends Break Down Further, the percentage of stocks above key short-term moving averages continues to plunge:
-
SMA(20): down to 20.3% (from 23.1%)
-
SMA(50): 23.5% (down from 26.6%)
-
SMA(100): 35.4% (from 41.6%)
Momentum Erosion Continues:
- Just 1.7% of stocks hit new highs (NH), while 5% made new lows (NL).
That’s an uptick in lows and further evidence of increasing downside momentum. The percentage of stocks making pivot points also fell to 10.7% (from 8.9%), reflecting a breakdown in constructive setups.
Breadth on a Weekly and Monthly Basis Weakens:
- Weekly breadth figures show only 18.3% of stocks advancing, with over 80% declining.
- Monthly, the figures remain bearish: 21.5% advancing vs. 78.1% declining.
Longer-Term Averages Faltering Too:
- Even the number of stocks above their 200-day moving average fell again to 50.3%.
- A majority of stocks are now trading below all major SMAs (20/50/100/200).
Market Leadership Breakdown
Chart-wise, the major ETFs show the technical damage:
Based on the ChartMill Trend Indicator, Short term trend for both QQQ and SPY is shifted to Neutral again (see the charts above), because the intraday price opened above the indicator. However, taking into account the closing price, we are manually revoking this and maintaining a negative outlook for the short term.
-
QQQ: Broke below the November support level with high volume. Down 2.1% for the day. The short-term uptrend is now firmly reversed.
-
SPY: Lost the key support zone around 660. A volatile break to the downside suggests distribution.
-
IWM: Continues its sharp downward move, closing down 1.7%. It has decisively broken support and now trades below the October lows.
Trend Continuation from Nov 19:
The previous day already hinted at a negative shift, but the internal deterioration was slightly less severe. Thursday confirmed the bearish shift, especially in short-term participation (Adv% Day, SMA levels) and increased downside momentum.
Conclusion:
The overall picture now shows more than just short-term weakness, breadth metrics are flashing broad-based distribution. The synchronized breakdown across major ETFs and across almost all breadth dimensions (daily, weekly, monthly) confirms the shift. At this point, the burden of proof is firmly on the bulls.
Breadth Trend Rating: Negative
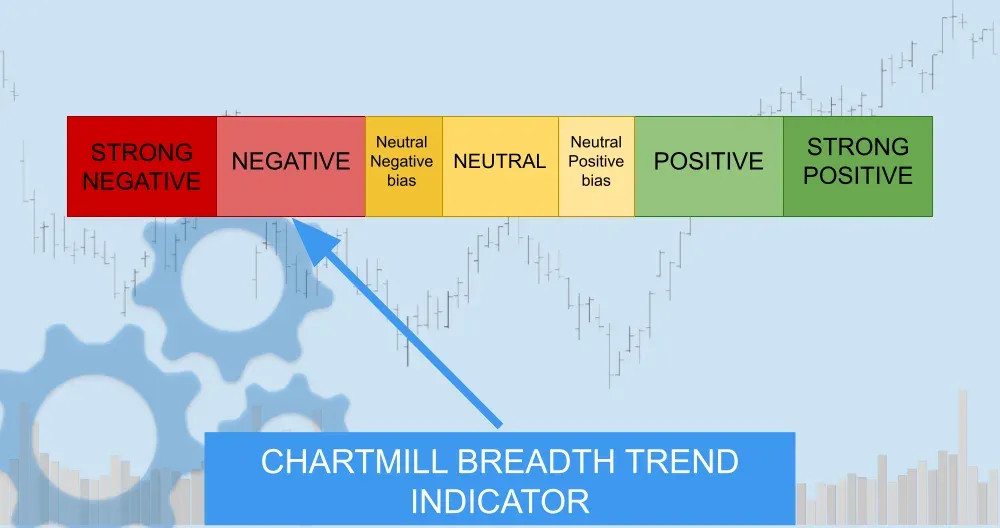
While not yet at panic washout levels, breadth is decisively deteriorating with both short- and medium-term indicators aligning to the downside.
Kristoff - ChartMill
Next to read: AI Rally Reverses as Wall Street Loses Its Nerve