

(All data & visualisations by ChartMill.com)
Daily Market Trend Analysis – November 17, 2025 (After Market Close)
Double bottom for SPY and QQQ
Short Term Trend

- Short-Term Trend: Neutral (No Change)
- Next Support at $660
- Next Resistance $685
- Volume: Well Above Average (50)
- Pattern: Up Day - Double Bottom
- Short-Term Trend: Neutral (No Change)
- Next Support at $600
- Next Resistance $627
- Volume: Well Above Average (50)
- Pattern: Up Day - Double Bottom
- Short-Term Trend: !!TREND CHANGE!! - NEGATIVE (from Neutral)
- Next Support at $236
- Next Resistance at $246
- Volume: Far Above Average (50)
- Pattern: Up Day - Failed Breakdown
Long Term Trend

- Long-Term Trend: Positive (no change)
- Long-Term Trend: Positive (no change)
- Long-Term Trend: Positive (no change)
Daily Market Breadth Analysis – November 17, 2025 (After Market Close)
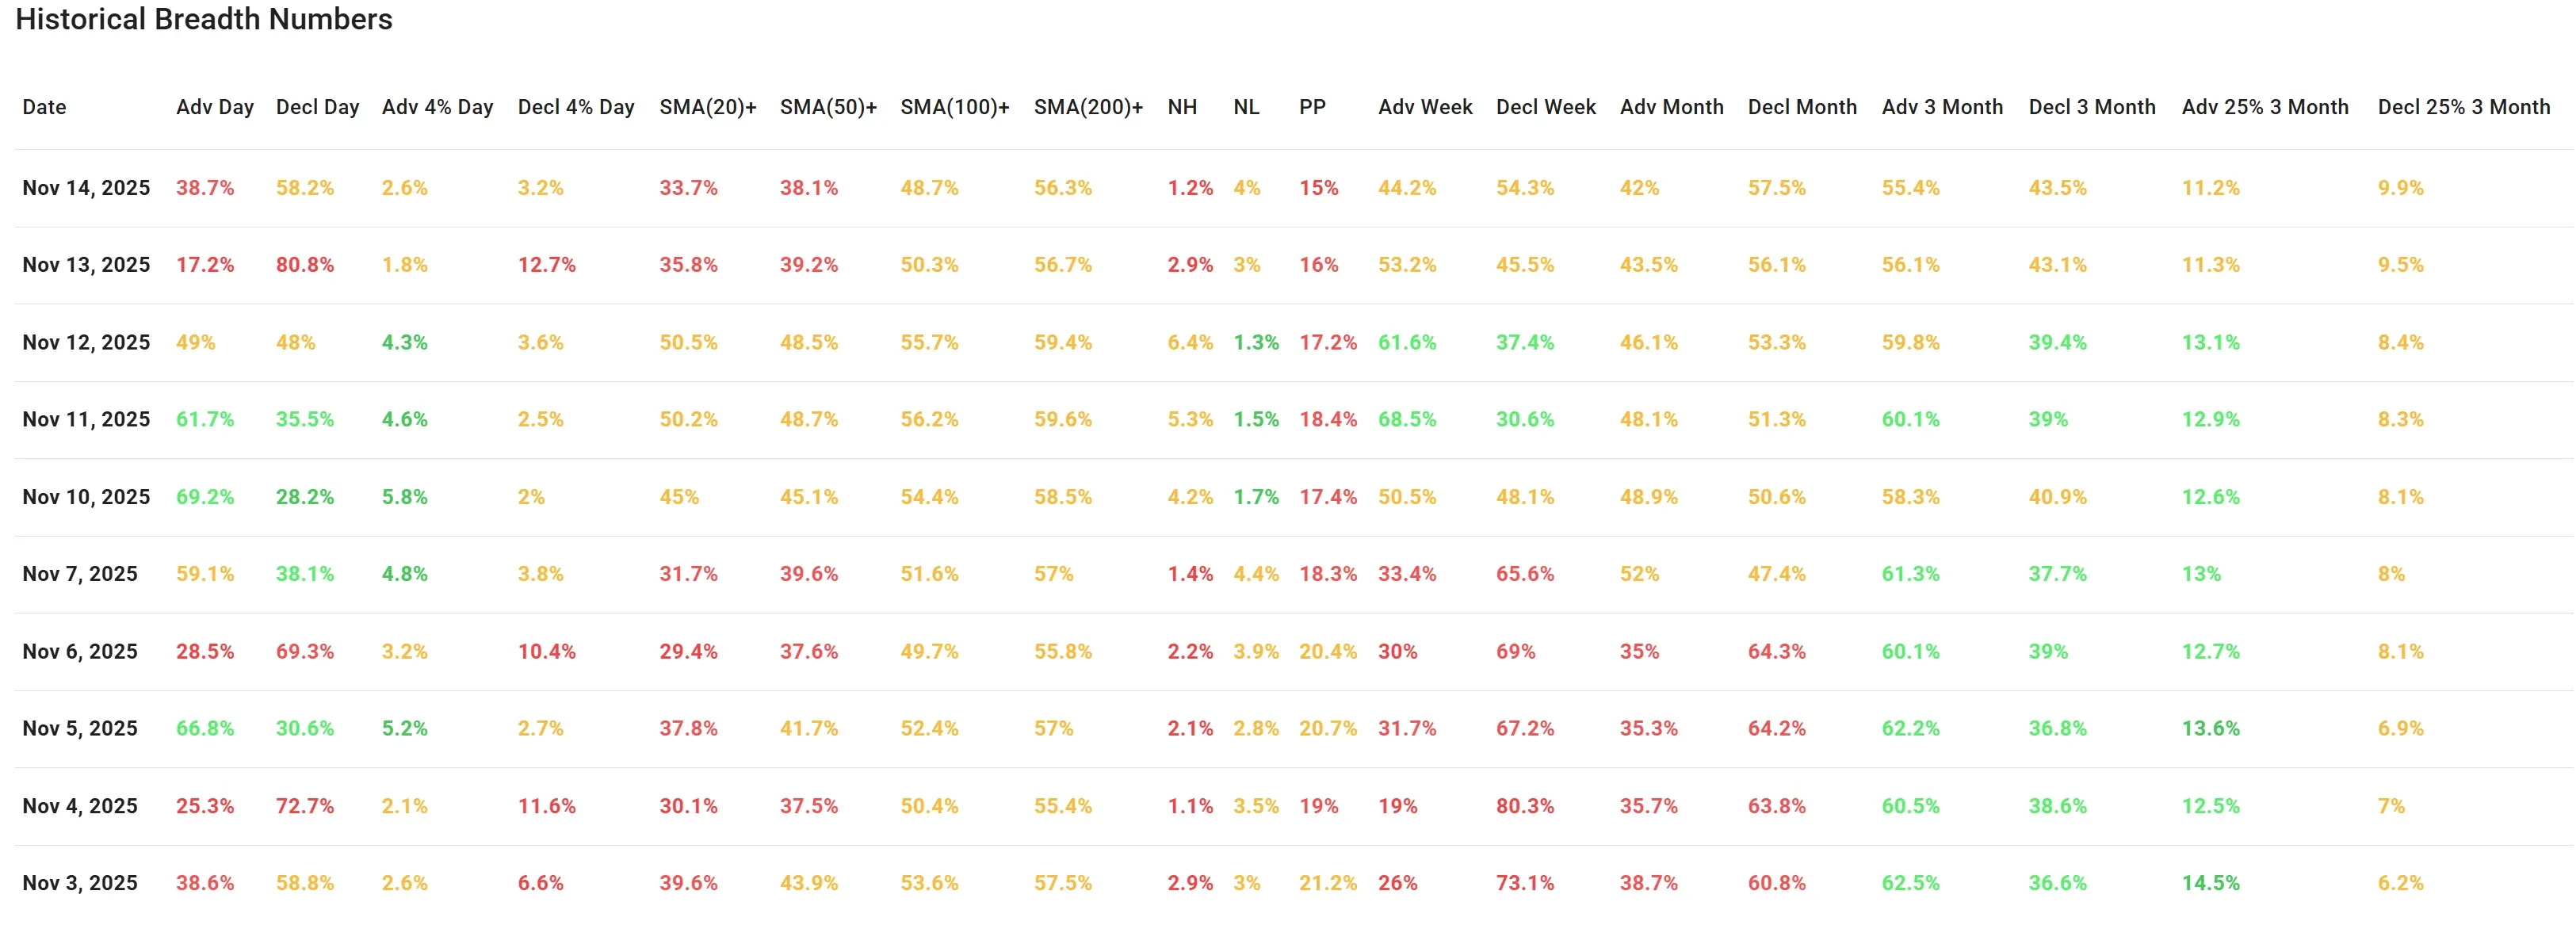
After a modest bounce in breadth metrics on Wednesday (Nov 12), Thursday (Nov 13) delivered a significant reversal, erasing earlier progress and exposing the fragility of that recovery. Friday’s session (Nov 14) offered no meaningful follow-through. Breadth data deteriorated again, although not as dramatically as Thursday’s collapse, suggesting sellers remain in control and buyers are hesitant to step in.
Daily Metrics Revert Lower Again
Advancers fell to 38.7%, after plunging to just 17.2% on Thursday. While this is a partial recovery, it still indicates more stocks declined than advanced.
Decliners remained high at 58.2%, though down from a staggering 80.8% the day before.
High-volatility movers remained muted:
-
Advancers > 4%: 2.6%
-
Decliners > 4%: 3.2%
These figures suggest Thursday’s panic selling eased somewhat, but bullish momentum remained absent.
Short-Term Averages Slipping Again
-
SMA(20)+: Down slightly to 33.7% (from 35.8%)
-
SMA(50)+: Dipped to 38.1% (from 39.2%)
-
SMA(100)+ and SMA(200)+ held steady at 48.7% and 56.3%, respectively
This continued slide in short-term moving average participation shows a weakening technical foundation. The longer-term averages have yet to follow, but are at risk if weakness persists into next week.
New Highs Collapse Again
-
New Highs (NH): Fell sharply to 1.2%, down from 2.9% on Thursday
-
New Lows (NL): Rose modestly to 4%, from 3%
The NH/NL divergence continues to reflect deteriorating leadership and a lack of breakout strength across the board.
Weekly and Monthly Breadth Trends Tilt Negative
-
Advancers (5-day) dropped to 44.2%, reversing the bounce seen earlier in the week
-
Decliners (5-day): Rose to 54.3%
Monthly trend:
-
Adv Month: 42% (down from 43.5%)
-
Decl Month: 57.5% (up from 56.1%)
These figures confirm that breadth is weakening on both weekly and monthly timeframes — not catastrophically, but steadily.
3-Month Trend Remains Cautiously Balanced
-
Advancers (3M): 55.4%
-
Decliners (3M): 43.5%
-
Advancers > 25% in 3M: 11.2%
-
Decliners > 25% in 3M: 9.9%
The 3-month view still suggests a neutral long-term environment — but it is now clearly under pressure from worsening short-term action.
Breadth Trend Rating: Neutral with Negative Bias
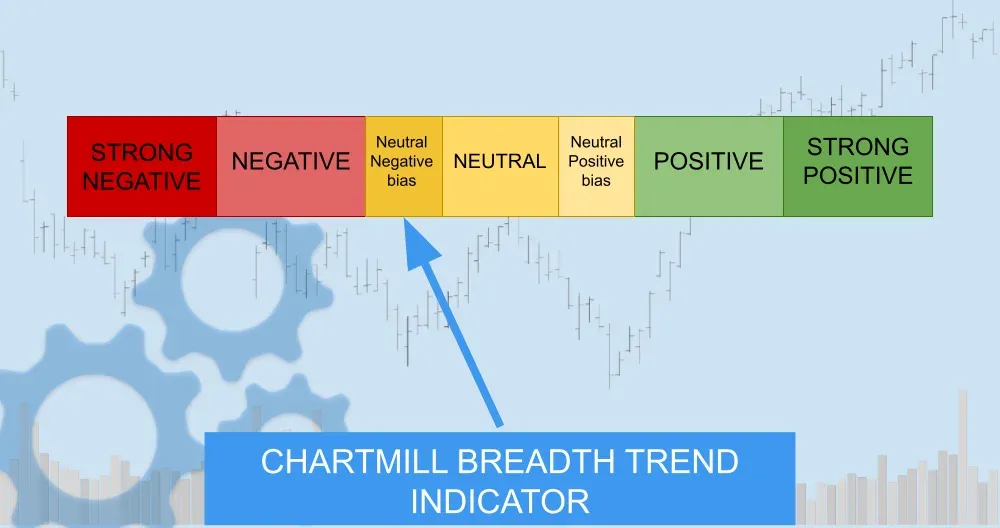
The brief optimism from Wednesday’s bounce has now fully faded. Thursday’s crash in breadth indicators was only partially repaired on Friday, and there’s little evidence of strength building beneath the surface. With new highs drying up, short-term averages breaking down, and even weekly metrics turning soft, the overall breadth trend leans bearish.
For now, the longer-term outlook remains somewhat neutral, but that can change quickly if this week doesn’t bring stabilization. Until then, caution remains warranted, especially for swing and momentum traders relying on broad market participation.
Kristoff - ChartMill
Next to read: Netflix’s Mega-Merger Rumors Stir the Tech Sector as Markets Brace for Nvidia’s Earnings