

(All data & visualisations by ChartMill.com)
Daily Market Trend Analysis – November 19, 2025 (After Market Close)
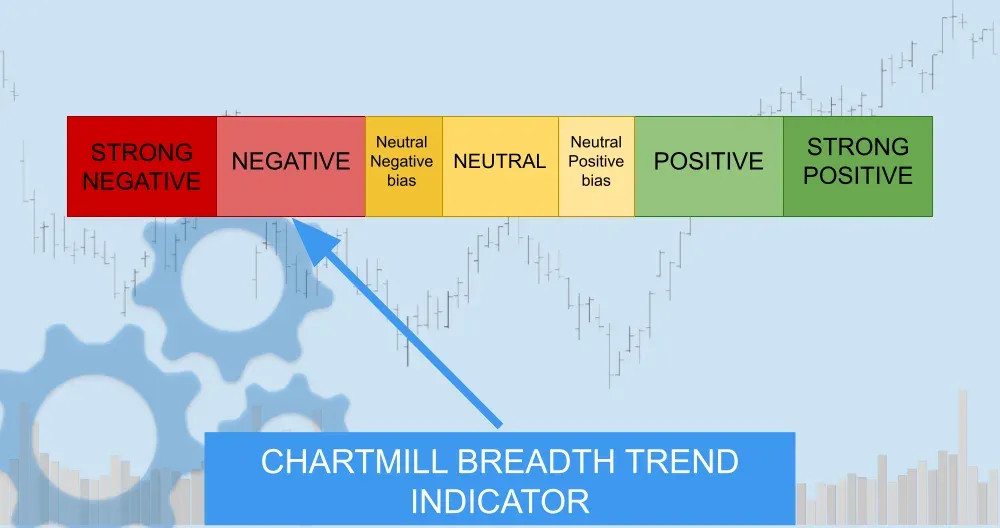
Despite breadth metrics showing a modest rebound on Tuesday (Nov 18), the broader technical picture remains fragile. The ChartMill short-term trend indicator flipped negative for both SPY and QQQ, confirming that the recent bounce lacked follow-through. The overall trend remains negative with a cautious tone.
Short Term Trend

- Short-Term Trend: !!Trend Change!! - Negative (from Neutral)
- Next Support at $652
- Next Resistance $660 - $670
- Volume: Far Above Average (50)
- Pattern: Down Day - Lost Support ($660) - big upper and lower candles wicks (nervousness)
- Short-Term Trend: !!Trend Change!! - Negative (from Neutral)
- Next Support at $589
- Next Resistance $600
- Volume: Slightly Above Average (50)
- Pattern: Down Day - Lost Support ($600) - big upper and lower candles wicks (nervousness)
- Short-Term Trend: Negative (No Change)
- Next Support at $225
- Next Resistance at $236
- Volume: Far Above Average (50)
- Pattern: Up Day
Long Term Trend

- Long-Term Trend: Positive (no change)
- Long-Term Trend: Positive (no change)
- Long-Term Trend: Positive (no change)
Daily Market Breadth Analysis – November 19, 2025 (After Market Close)
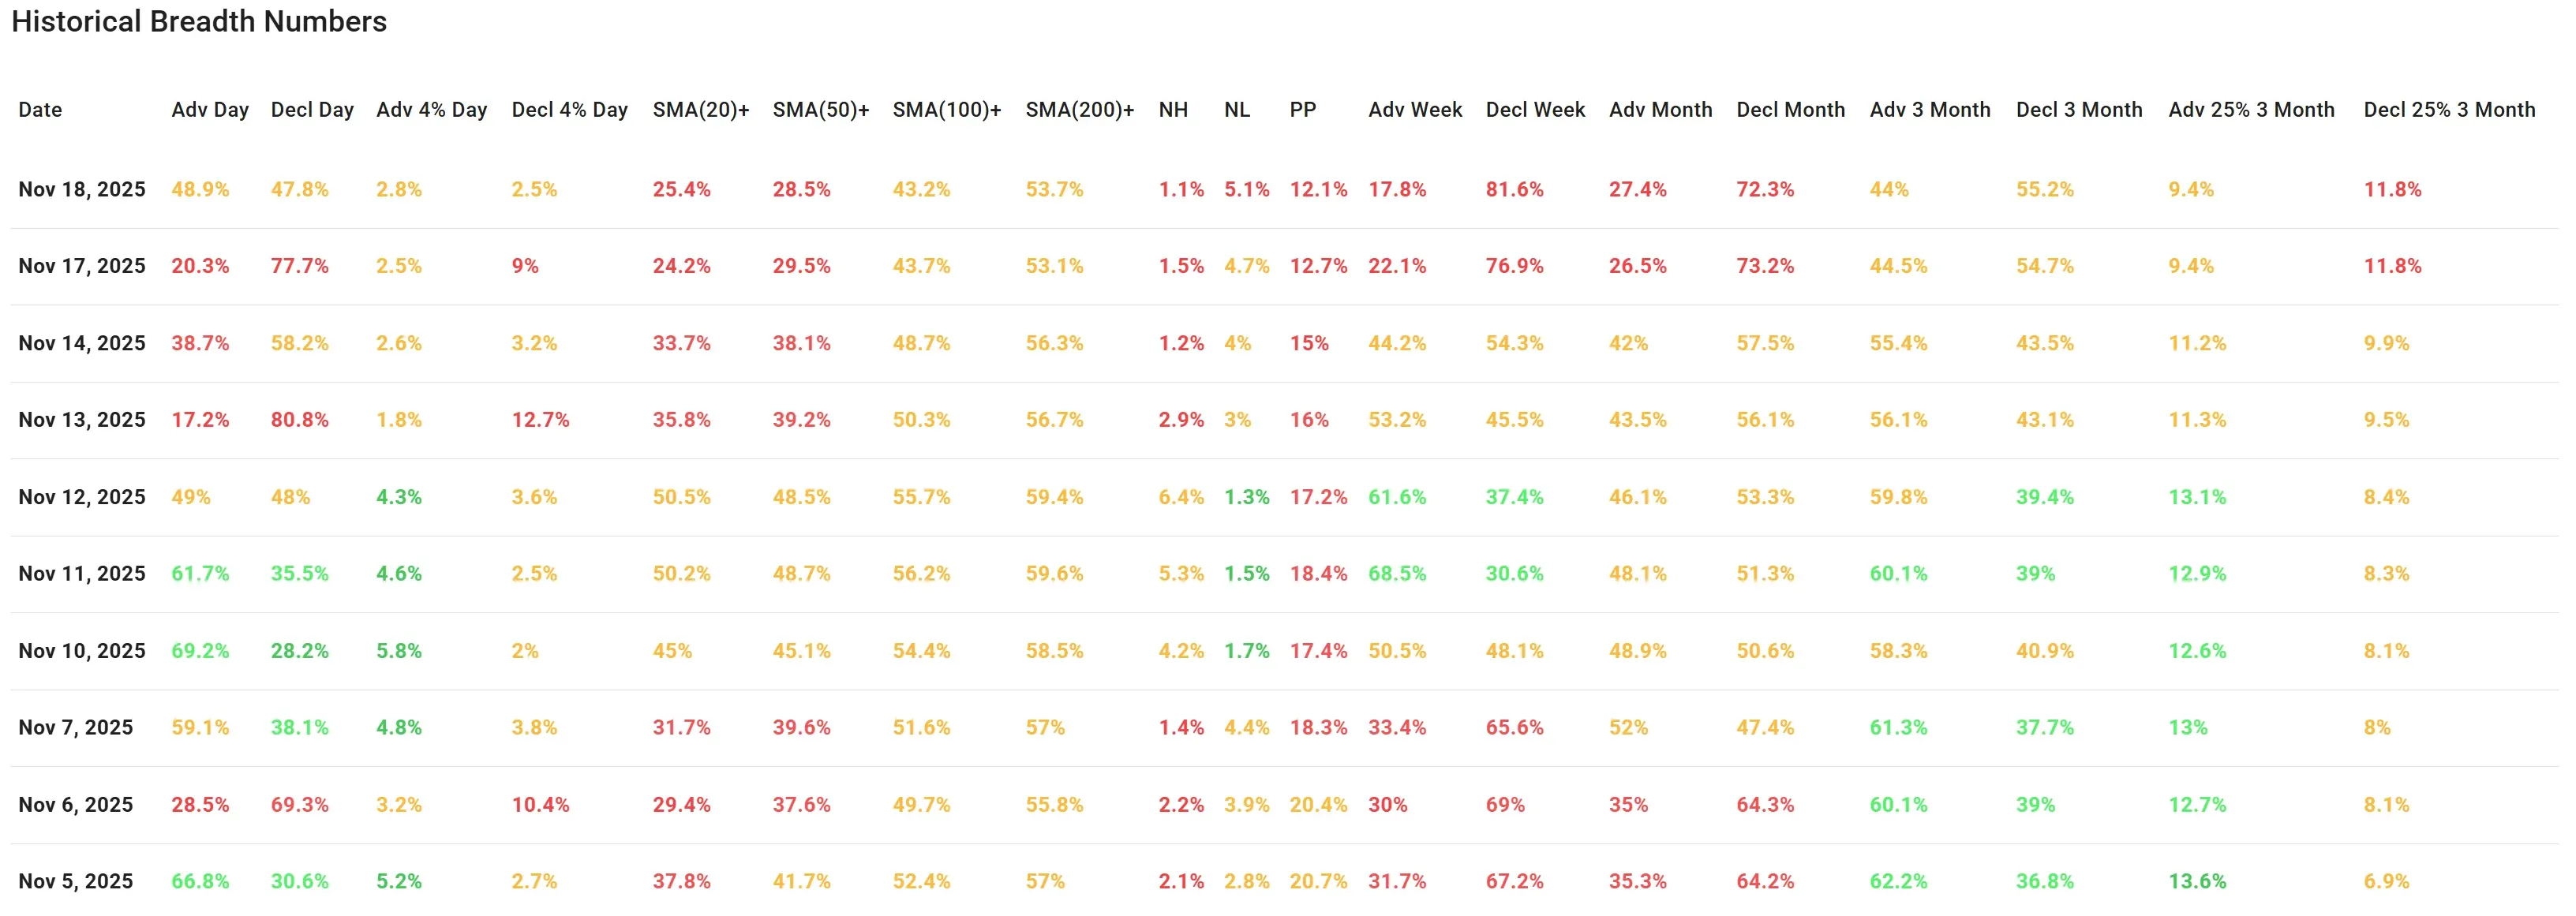
After Monday's sharp decline in market breadth, Tuesday (Nov 18) brought some short-term relief: advancers rose to 48.9%, and decliners dropped to 47.8%. At face value, this looks like stabilization. However, the technical backdrop does not confirm any shift in direction.
Both SPY and QQQ posted another red day on Tuesday, continuing their recent slide. More importantly, the ChartMill trend indicator for both ETFs turned negative, a clear signal that the short-term trend has shifted downward again after a failed attempt to reclaim the 30-day moving average (as circled on the charts).
The percentage of stocks trading above their SMA(20) and SMA(50) remains weak at 25.4% and 28.5%, respectively. These figures are not improving meaningfully, reinforcing the idea that the bounce was narrow and not broadly supported. New Highs remain scarce (1.1%), while New Lows (5.1%) remain elevated.
The weekly and monthly breadth outlook also shows a bearish bias:
-
Adv Week collapsed to 17.8%, with Decl Week climbing to 81.6%.
-
Monthly breadth is similarly skewed, with only 27.4% of stocks advancing over the last 20 sessions.
Even three-month breadth, often more stable, reflects deterioration:
-
Adv 3 Month: 44%
-
Decl 3 Month: 55.2%
-
Stocks up 25% over 3 months: just 9.4%
-
Stocks down 25% over 3 months: 11.8%
This confirms that while the intraday selling pressure may have paused, the trend direction has not changed. In fact, the inability to reclaim key levels combined with the rollover in the ChartMill trend signal underscores lingering weakness.
Updated Breadth Trend Rating: Negative
Despite a short-term uptick in breadth figures, the broader message remains bearish. With key index ETFs resuming their downtrend and failing to regain important moving averages, caution is warranted.
Kristoff - ChartMill
Next to read: AI Fever Turns Into AI Fatigue as Wall Street Loses Patience