

(All data & visualisations by ChartMill.com)
Daily Market Trend Analysis – November 25, 2025 (After Market Close)
All three indices are approaching major resistance levels.
Short Term Trend
- Short-Term Trend: Neutral (no change)
- Next Support at $650
- Next Resistance $667
- Volume: At Average (50)
- Pattern: Up Day - Strong Candle Close at Resistance
- Short-Term Trend: !!TREND CHANGE - NEUTRAL!! (from negative)
- Next Support at $580
- Next Resistance $614
- Volume: At Average (50)
- Pattern: Up Day
- Short-Term Trend: Neutral (no change)
- Next Support at $229
- Next Resistance at $245
- Volume: At Average (50)
- Pattern: Up Day - Strong Close at Resistance, Above Descending Trendline
Long Term Trend
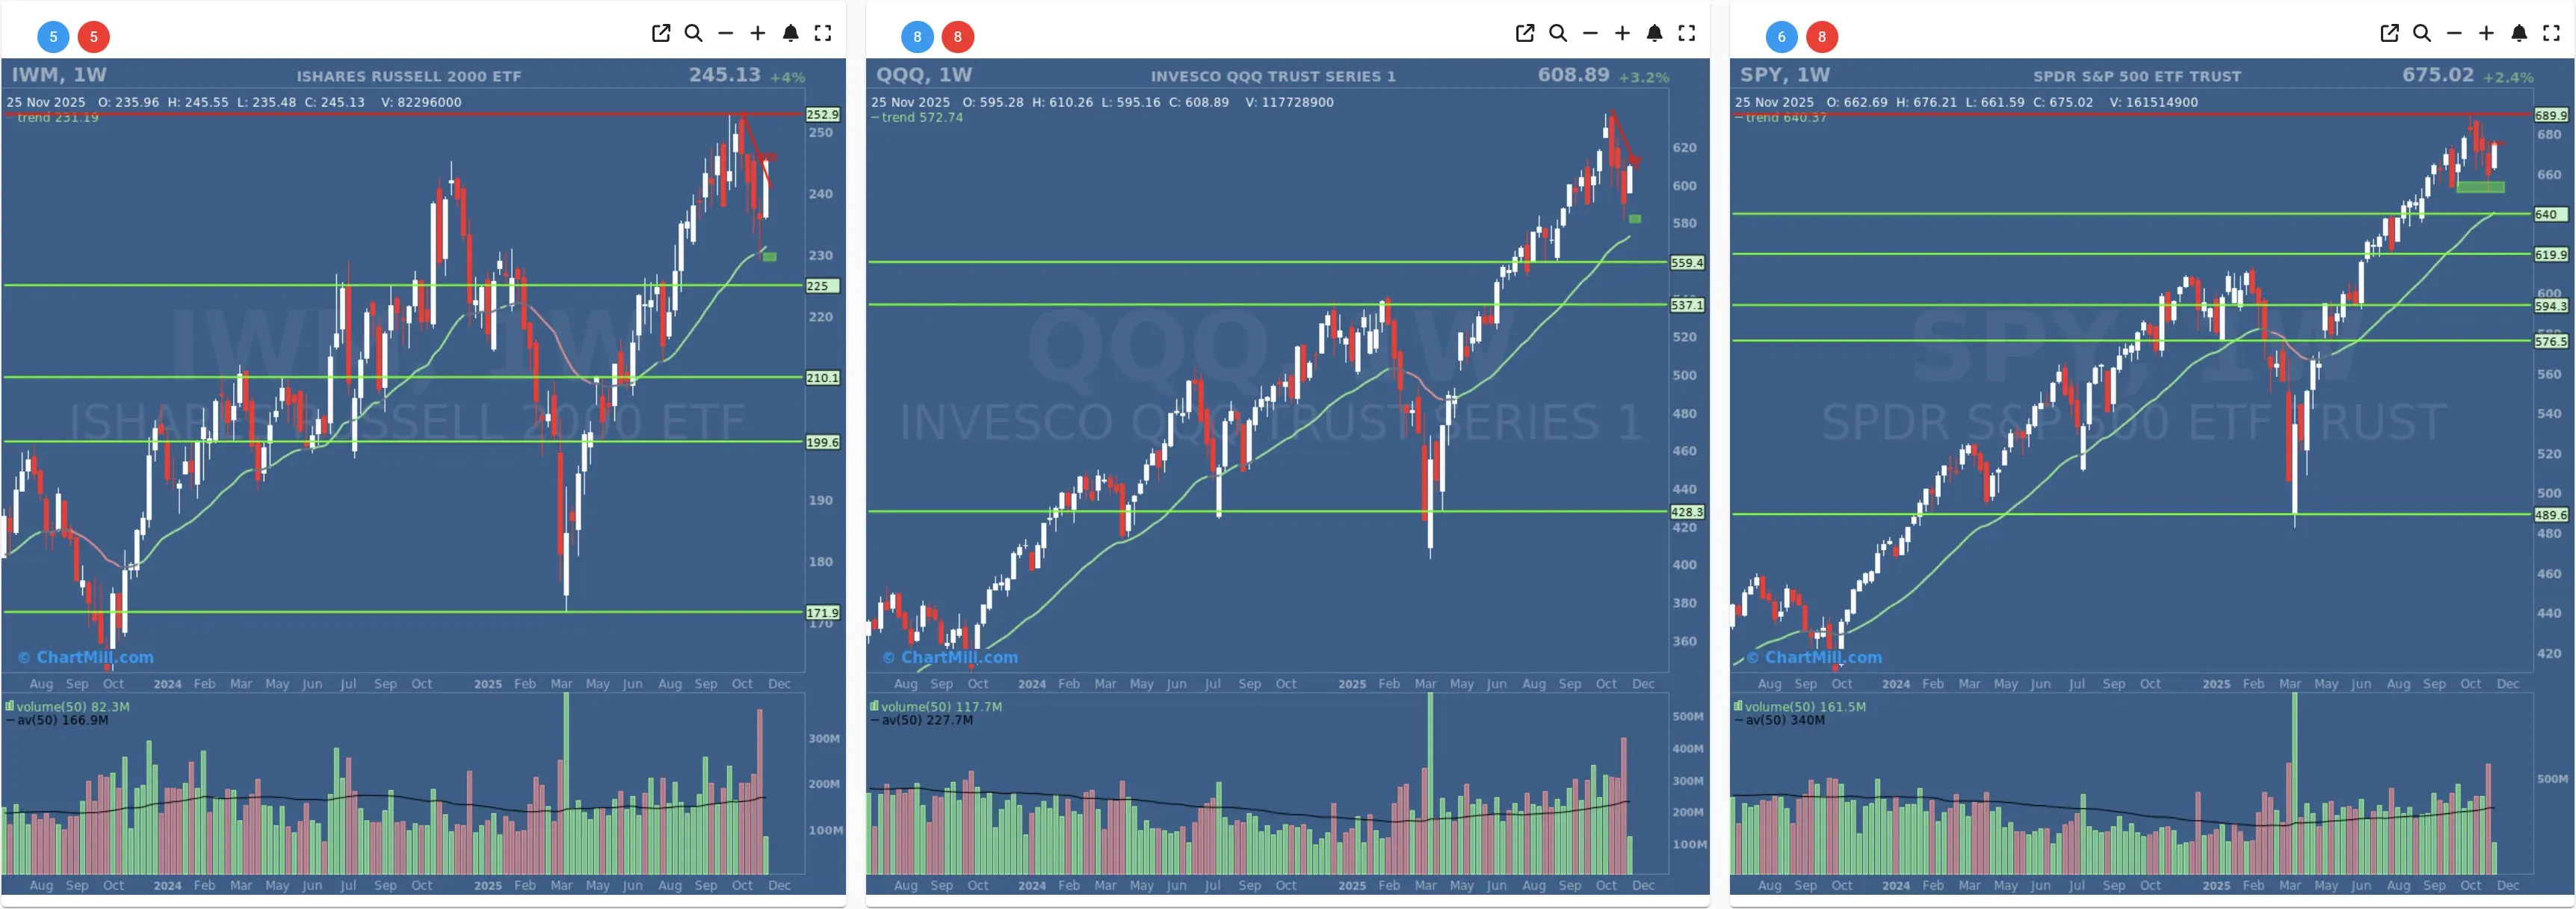
- Long-Term Trend: Positive (no change)
- Long-Term Trend: Positive (no change)
- Long-Term Trend: !!TREND CHANGE - POSITIVE!! (from neutral) - NOT CONFIRMED (intraweek close)
Daily Market Breadth Analysis – November 25, 2025 (After Market Close)
Following Monday’s strong bounce, breadth momentum extended on Tuesday, with 78.6% of stocks advancing and just 19% declining, reflecting widespread strength.

This continues the positive recovery sequence from last week’s washout, with three of the last four sessions showing very strong breadth (all above 68%).
Moreover, the percentage of stocks making 4%+ gains outpaced 4%+ losers by a wide margin (6.4% vs. 1.4%), reinforcing the underlying strength in individual names.
The percentage of stocks trading above their 20SMA, 50SMA, 100SMA, and 200SMA all rose significantly:
-
SMA(20)+: 54.4% (vs 39.1% previous day)
-
SMA(50)+: 46.7% (vs 35.6%)
-
SMA(100)+: 52.4% (vs 46.6%)
-
SMA(200)+: 58% (vs 55.1%)
These sharp daily improvements are meaningful - particularly the 15-point jump in stocks above their 20-day moving average - and reflect short-term momentum shifting in favor of the bulls.
Chart Highlights
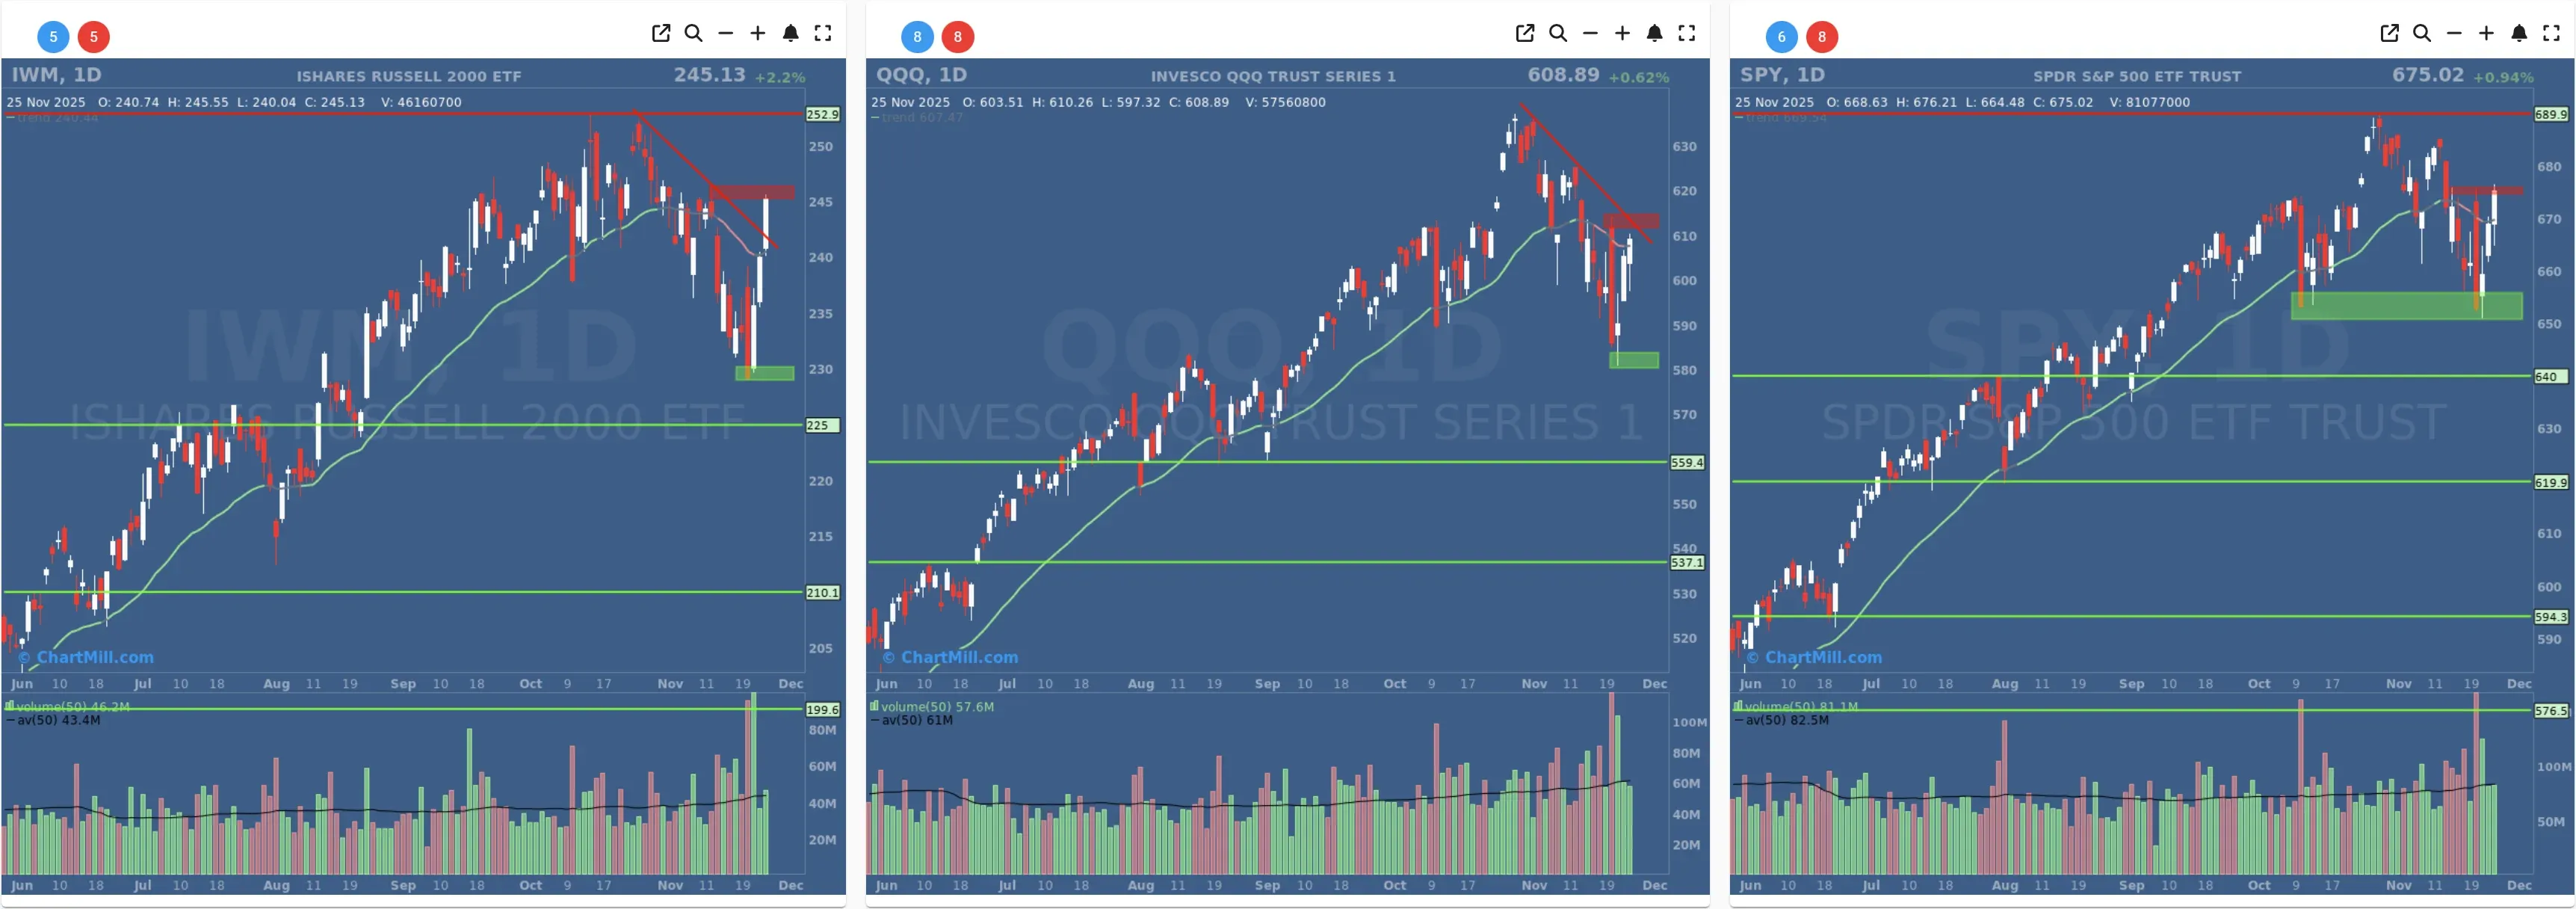
IWM (Russell 2000 ETF)
+2.2% on the day. IWM is pushing into a major horizontal resistance zone around 245–246, right where multiple prior highs converge. This test comes after a bounce off the 230–231 demand zone. The downtrend line has also been broken with force, suggesting strong rotation into small caps.
QQQ (Nasdaq-100 ETF)
+0.62% and continuing its advance after bouncing off the 590 support zone last week. QQQ also broke through a short-term trendline and is now back near the 610–615 resistance band.
SPY (S&P 500 ETF)
+0.94%, with SPY rebounding sharply off the highlighted support region (~652–655) and approaching a well-defined ceiling at 675–680. While volume remained healthy, SPY is still within its broader sideways range for now.
Contextual Metrics
Advance/Decline Ratios: All trending upward, with the weekly advance rate climbing to 70%, while the monthly advance metric jumped to 34.8%, up from 26.4%.
New Highs vs. New Lows: Modestly improving — NH rose to 3.9% while NL fell to just 0.7%, the lowest level in 10 days.
Percentage of stocks 25% above 3-month lows increased slightly to 10%, while those 25% below their highs decreased again (10.3%). These are not extreme, but the direction supports improving sentiment.
Conclusion and Trend Rating
The overall trend has improved markedly since last Thursday’s bottom, and Tuesday’s action confirms that the rally has broad internal support. All three indices are approaching major resistance levels, which could determine whether this bounce evolves into a more sustained uptrend or stalls out.
For now, market breadth indicates a firm shift toward bullish short-term momentum, although overhead technical resistance could temper the next move.
Market Breadth Trend Rating: Positive

This rating reflects the widespread strength in advancing stocks, improving moving average participation, and solid continuation of a breadth rebound off last week's lows.
Kristoff - ChartMill
Next to read: Alphabet’s AI Power Play Sends Shockwaves Through the Market