

(All data & visualisations by ChartMill.com)
Daily Market Trend Analysis – November 13, 2025 (After Market Close)
Weak candles closes for all index-etf's, SPY and QQQ turned neutral again (short term).
Short Term Trend

- Short-Term Trend: !!TRENDCHANGE!! Neutral (From Positive)
- Next Support at $660
- Next Resistance $685
- Volume: Well Above Average (50)
- Pattern: Down Day - Weak Candle Close
- Short-Term Trend: !!TRENDCHANGE!! Neutral (From Positive)
- Next Support at $600
- Next Resistance $627
- Volume: Well Above Average (50)
- Pattern: Down Day - Weak Candle Close
- Short-Term Trend: Neutral (No Change)
- Next Support at $236
- Next Resistance at $246
- Volume: Far Above Average (50)
- Pattern: Down Day - Weak Candle Close - At Support
Long Term Trend

- Long-Term Trend: Positive (no change)
- Long-Term Trend: Positive (no change)
- Long-Term Trend: Positive (no change)
Daily Market Breadth Analysis – November 13, 2025 (After Market Close)
Market breadth metrics took a sharp turn for the worse on Thursday.

The percentage of advancing stocks dropped dramatically to 17.2%, down from 49% the day before. At the same time, declining issues spiked to 80.8%, nearly a full reversal from the previous session’s balanced breadth.
This deterioration was not limited to moderate moves, only 1.8% of stocks rose more than 4%, while 12.7% declined by at least that amount. These figures are significant in signaling heavy downside participation across the board.
Participation also weakened under the surface:
-
SMA(20)+ and SMA(50)+ readings both fell to 35.8% and 39.2%, respectively. This is a stark contrast to the 50%+ levels seen just one day prior.
-
The longer-term moving averages (SMA100 and SMA200) remain more stable at 50.3% and 56.7%, but these typically lag, and a sharp rollover may be imminent if weakness continues.
-
New Highs dropped back to just 2.9%, while New Lows edged up to 3%, signaling renewed downside momentum at the extremes.
Over broader timeframes:
-
The weekly advance-decline ratio remains mixed (Advancing: 53.2%, Declining: 45.5%), but the reading masks the sudden shift in daily sentiment.
-
On a monthly basis, advancers fell to 43.5%, while decliners rose to 56.1%, continuing the longer-term bearish trend.
The 3-month perspective shows a broader loss of momentum:
-
Advance 3M has dropped back to 56.1%, the lowest since Nov 4.
-
Decline 3M rose to 43.1%, the highest since Oct 31.
Notably, advancers with +25% gains over 3 months slipped again to 11.3%, from 13.1% the day before.
Context and Interpretation
This dramatic reversal casts doubt on the durability of the recent bounce seen earlier in the week. The market breadth data from November 11 and 12 showed improvement - rising advance-decline ratios, increasing SMA participation, and expanding pivot breakouts - but that progress was decisively reversed on November 13.
Notably, this collapse occurred despite no major economic news releases or earnings shocks during the session, suggesting the move was largely driven by renewed selling pressure, perhaps linked to profit-taking or increasing concern over macro conditions.
Breadth Trend Rating: Negative
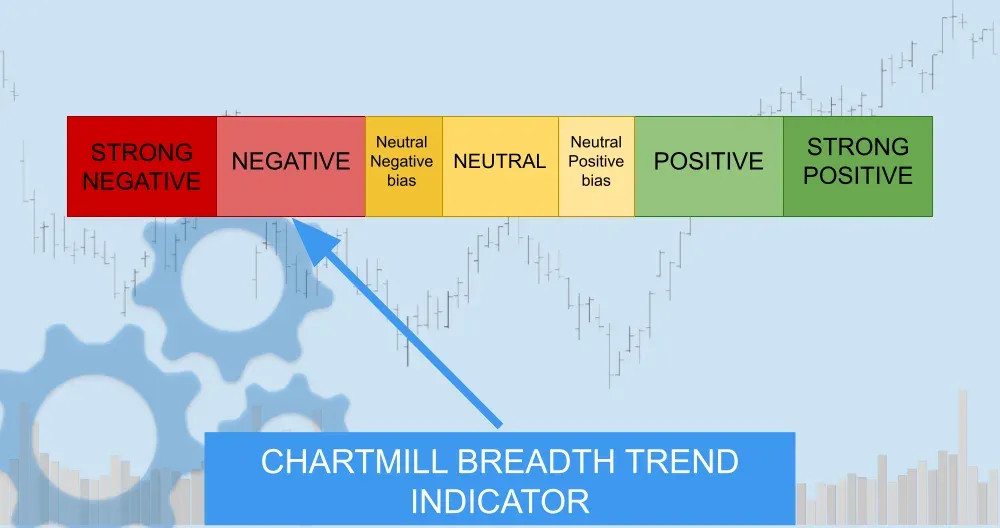
The trend has quickly reverted from a tentative neutral-positive bias earlier this week to a clearly negative stance. The swift and broad-based deterioration in participation leaves little doubt about the current pressure on equities, especially below the surface.
Kristoff - ChartMill
Next to read: Tech Stocks Tank as Rate Cut Hopes Fade, Wall Street Takes a Breather