

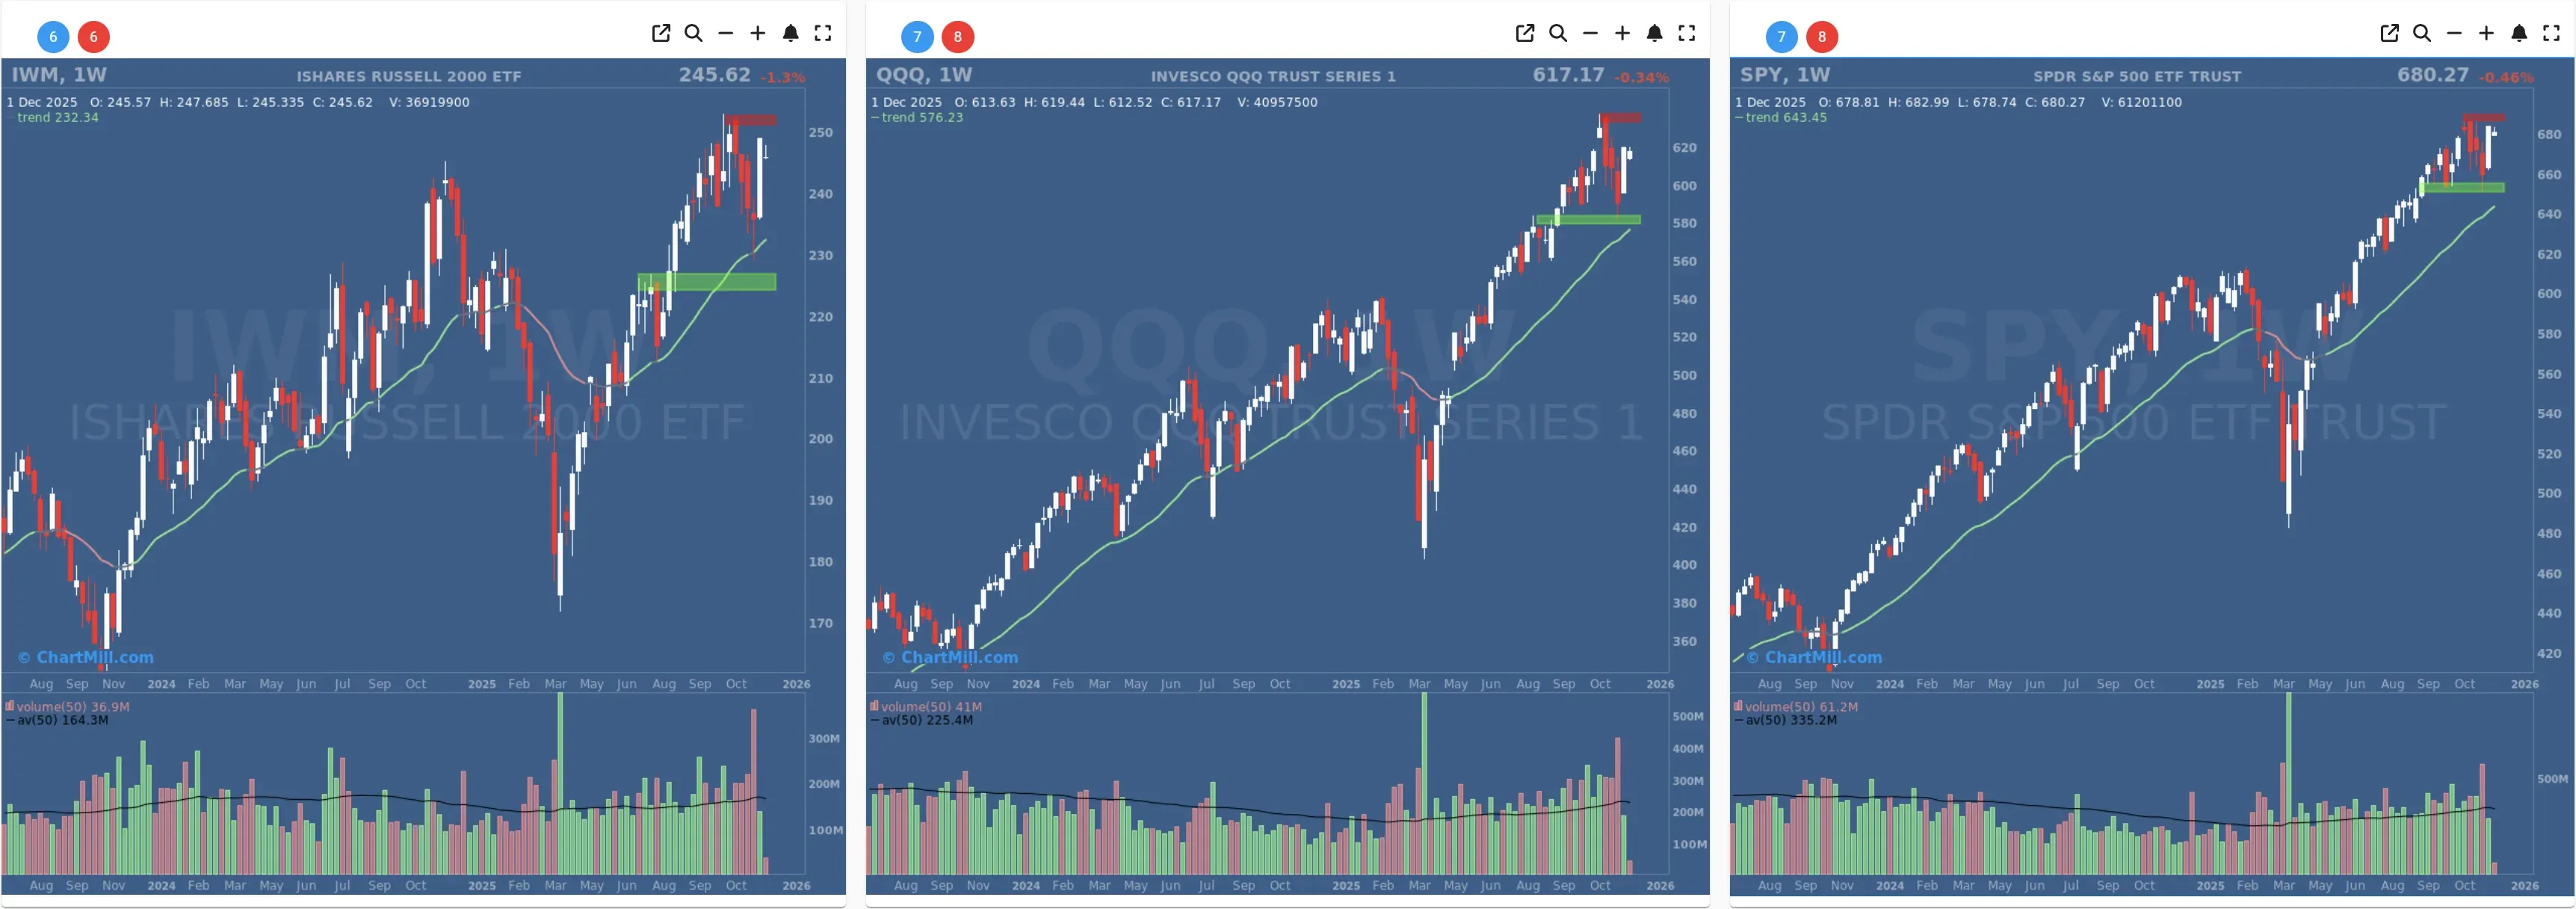
Index overview – red day at overhead resistance
SPY fell about 0.5%, pulling back from the upper end of its recent trading range and still trading comfortably above the highlighted support zone around the prior breakout area.
QQQ slipped roughly 0.3%, consolidating between the green support band and the red resistance zone. The ETF remains above its rising 20-day average.
IWM underperformed with a drop of about 1.3%, reversing lower right underneath a major resistance area after a sharp November rebound. Small caps again prove to be the most volatile segment of the market.
So price action was clearly negative on the day, but within ongoing uptrends that were extended into nearby resistance, a natural place to see some profit taking.
Short Term (Daily)

Long Term (Weekly)
Daily breadth – clear distribution day after the thrust
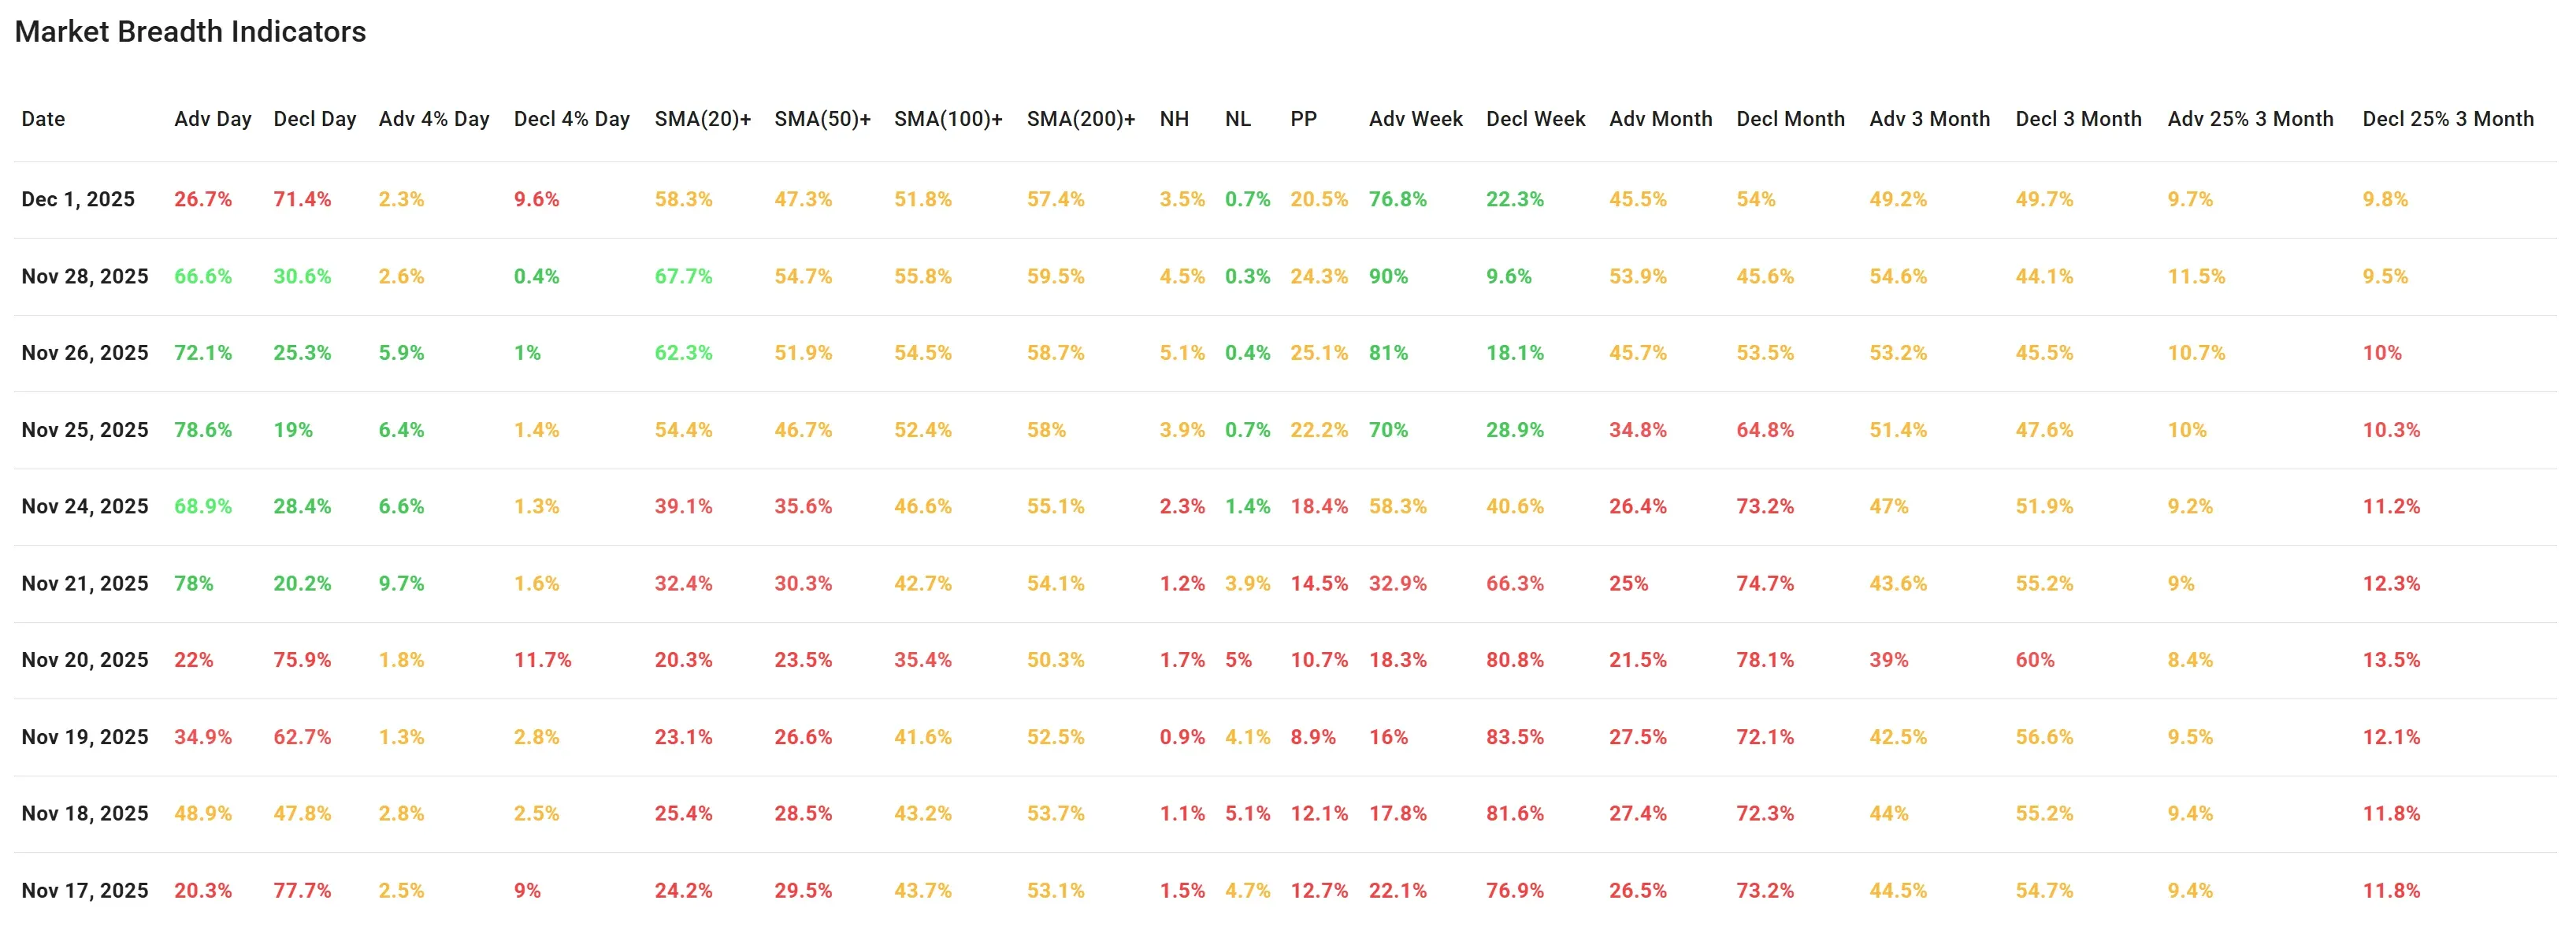
The short, post-holiday session on Friday (Nov 28) showed broad strength (about two-thirds of stocks advancing). Monday flipped that picture:
Advancers vs decliners (day):
-
Advancers dropped from 66.6% (Nov 28) to 26.7% (Dec 1).
-
Decliners jumped to 71.4%.
4% movers:
- Only 2.3% of stocks gained 4% or more, while 9.6% fell at least 4%.
That is the first clearly distribution-like reading since the mid-November low.
Versus the previous breadth update around Nov 26, where we saw back-to-back sessions with more than 70% of stocks advancing, Monday marks a distinct cooling of the short-term thrust. The message: buyers are no longer in clear control on a one-day basis, even though the indices only gave back modest ground.
Trend breadth – pullback, but still far better than mid-November
Despite the weak day, the percentage of stocks above key moving averages remains in much healthier shape than two weeks ago:
-
Above 20-day SMA: down from 67.7% (Nov 28) to 58.3%, a meaningful step back, but still a majority of stocks in short-term uptrends.
-
Above 50-day SMA: slipped from 54.7% to 47.3%, just under the 50% line.
-
Above 100- and 200-day SMAs: hold around 52–57%, very similar to recent readings and well above the levels of Nov 17–20, when only about 43–53% of stocks were above those longer averages.
So Monday damaged the short-term (20–50 day) breadth, but intermediate and longer-term trend breadth remains constructive. The November recovery is intact; it’s just no longer accelerating.
New highs, new lows and Pocket Pivots
-
New highs (NH) eased only slightly to 3.5% of stocks, still clearly above new lows (NL) at 0.7%.
-
NL remains extremely muted compared with the mid-November stress phase, when double-digit percentages of stocks were down 25% or more over three months.
-
Pocket Pivots pulled back from 24.3% to 20.5%, another sign that the very strong upside momentum of last week is cooling but not collapsing.
Taken together, the leadership picture is still tilted to the bullish side (more highs than lows), just less emphatically so than before Thanksgiving.
Multi-timeframe view – weekly still strong, monthly converging to neutral
The rolling advance/decline ratios across longer windows help to separate noise from trend:
Weekly breadth:
Advancing stocks over the last 5 sessions remain high at 76.8%, versus 90% just before the weekend.
That’s still a very strong short-term uptrend when looked at over several days, confirming the November surge from the mid-month lows.
Monthly breadth:
Over the past month, advancers are at 45.5% vs 54% decliners, essentially neutral with a slight negative skew, but improving versus the clearly weak readings seen around Nov 19–20.
Three-month picture:
Advancers sit near 49–50%, with decliners just under 50%, basically balanced.
The share of big winners and losers (±25% over 3 months) is almost symmetrical: 9.7% strong gainers vs 9.8% big losers. This is a notable shift from a few weeks ago, when losers dominated this bucket.
Compared with our last detailed breadth analysis before Thanksgiving, the story is:
-
The intermediate trend has turned from clearly negative to roughly balanced/constructive,
-
The very strong short-term thrust has now experienced its first shake-out day at resistance.
Putting it all together
The indices remain in uptrends but encountered overhead resistance, especially in IWM.
Monday’s breadth was decisively negative, with a clear majority of stocks down and an elevated number of 4% decliners, a classic digestion/distribution day after a strong run.
Longer-term breadth metrics (above 100- and 200-day averages, new highs vs lows, 3-month winners vs losers) still reflect the significant repair done since mid-November and do not yet signal a renewed downtrend.
Relative weakness in small caps suggests that risk-on segments are more vulnerable here, while large-cap indices mask some of the underlying softness.
In other words, the November breadth thrust is intact but no longer accelerating. The market is transitioning from an “all-clear” rally phase into a more selective and choppy environment, where pullbacks and rotation under the surface are likely as long as indices sit below resistance.
Breadth trend rating
Current breadth trend: neutral with a positive bias

The underlying trend remains materially better than it was in mid-November, but Monday’s broad-based pullback and softening short-term metrics argue against a fully “positive” rating. For now, the bias stays modestly constructive, with the caveat that further heavy selling days like today would quickly drag the rating back toward neutral.
Kristoff - ChartMill
Next to read: Disney’s Fox and Rabbit Steal the Show as Bitcoin Crash and Soft ISM Data Knock Wall Street Lower