

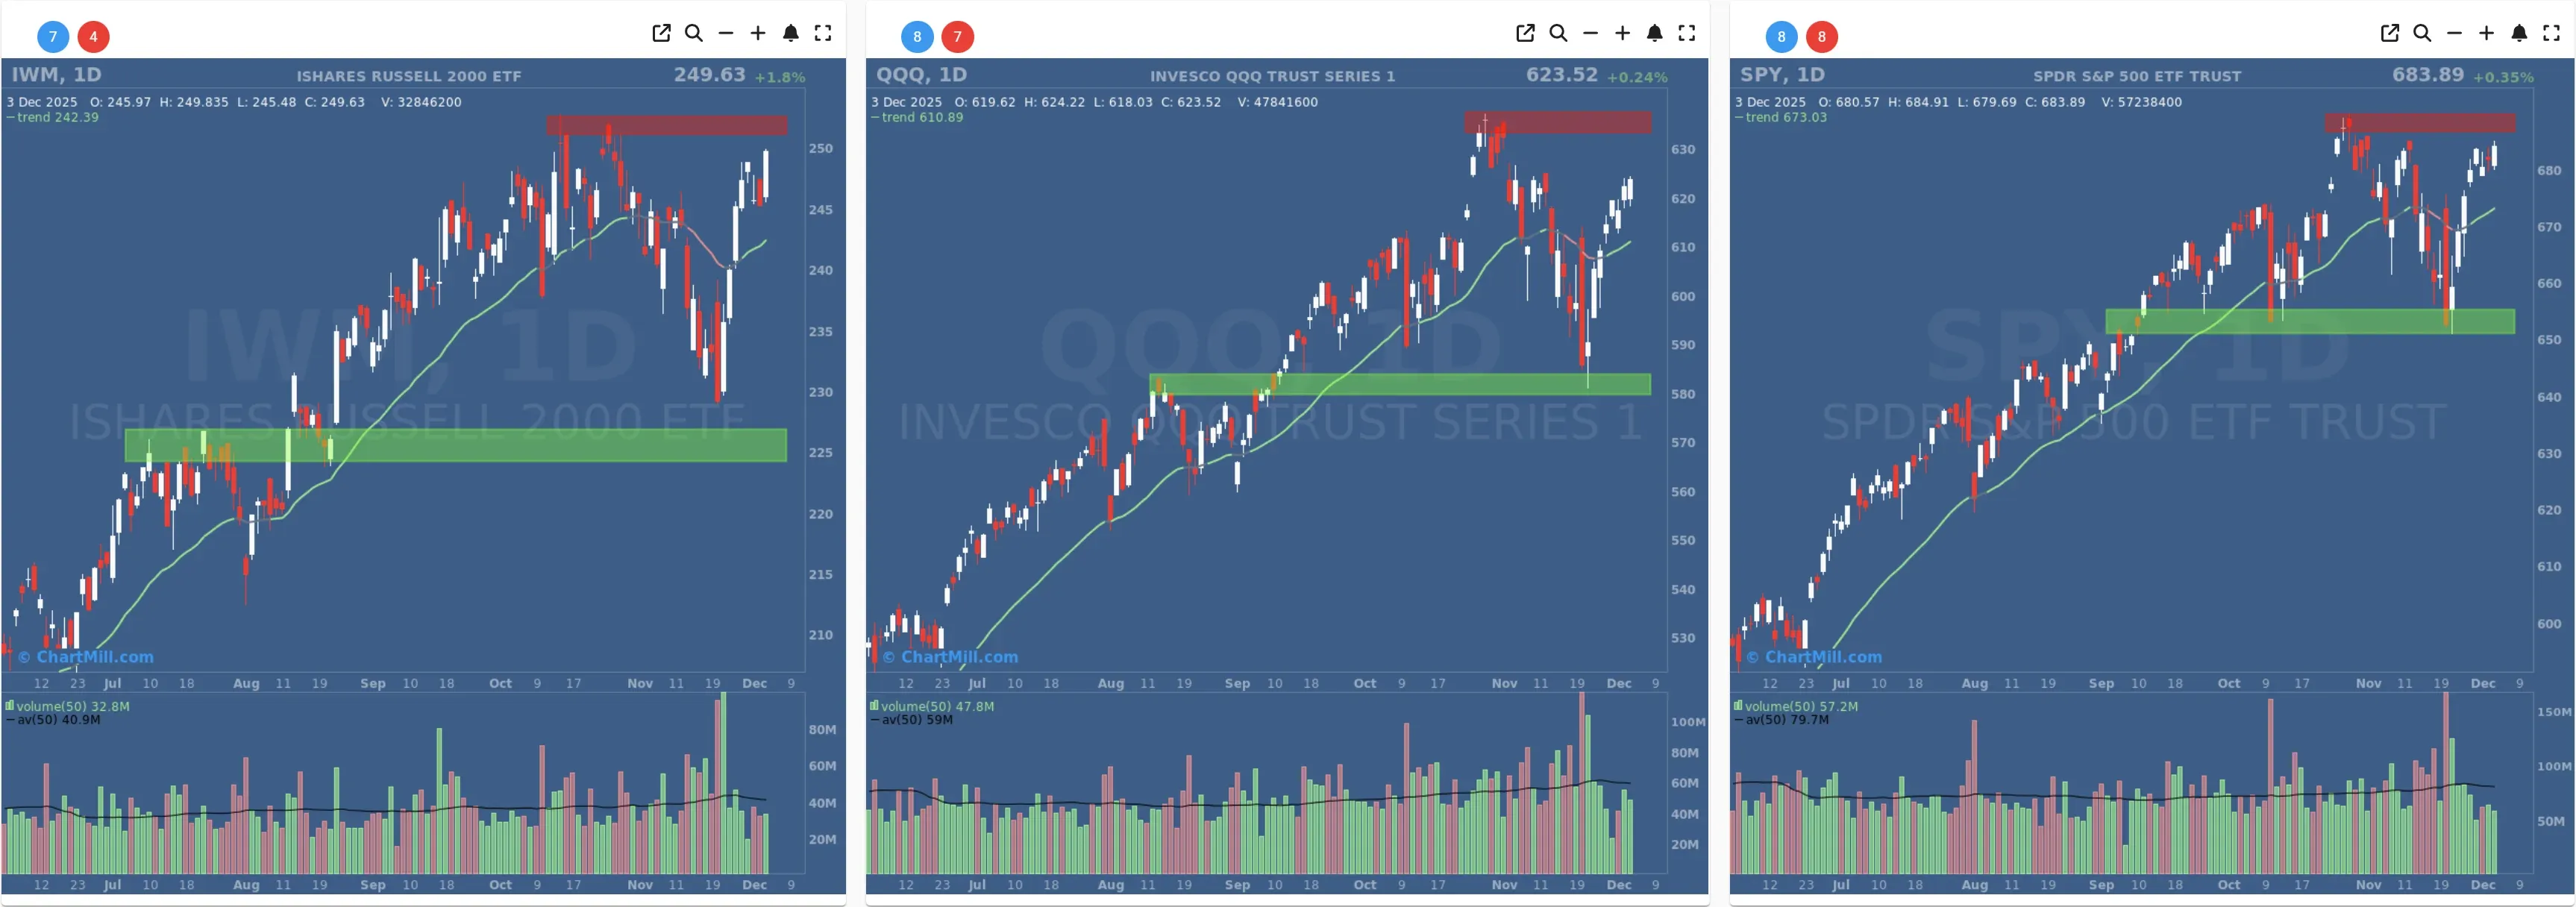
Index overview – SPY, QQQ and IWM
SPY added about 0.35%, pushing further into the upper part of its recent consolidation band. Price is back near the red resistance zone drawn around the prior highs, with the ChartMill Trend Indicator rising steadily below and the green support area around 655–660 now well defended after last week’s successful retest.
From a price perspective, SPY remains in a strong uptrend on both the daily and weekly charts, but short-term it is again bumping its head on resistance rather than breaking cleanly to fresh highs.
QQQ gained 0.24% and is trading just beneath its own resistance area around the late-November peak. Monday’s sell-off briefly threatened to turn that prior breakout into a failed move, but the swift two-day rebound has put QQQ back on the front foot. On the weekly chart the ETF is still in a steep, orderly uptrend with price comfortably above our ChartMill Trend Indicator.
Tech leadership remains intact; the question now is whether QQQ can punch decisively through the current ceiling.
IWM (small caps) was the clear standout, rallying 1.8% and almost fully revisiting the red resistance band around its recent highs. After lagging for much of this advance, small caps have now staged a strong multi-day recovery from the green support zone identified in prior updates.
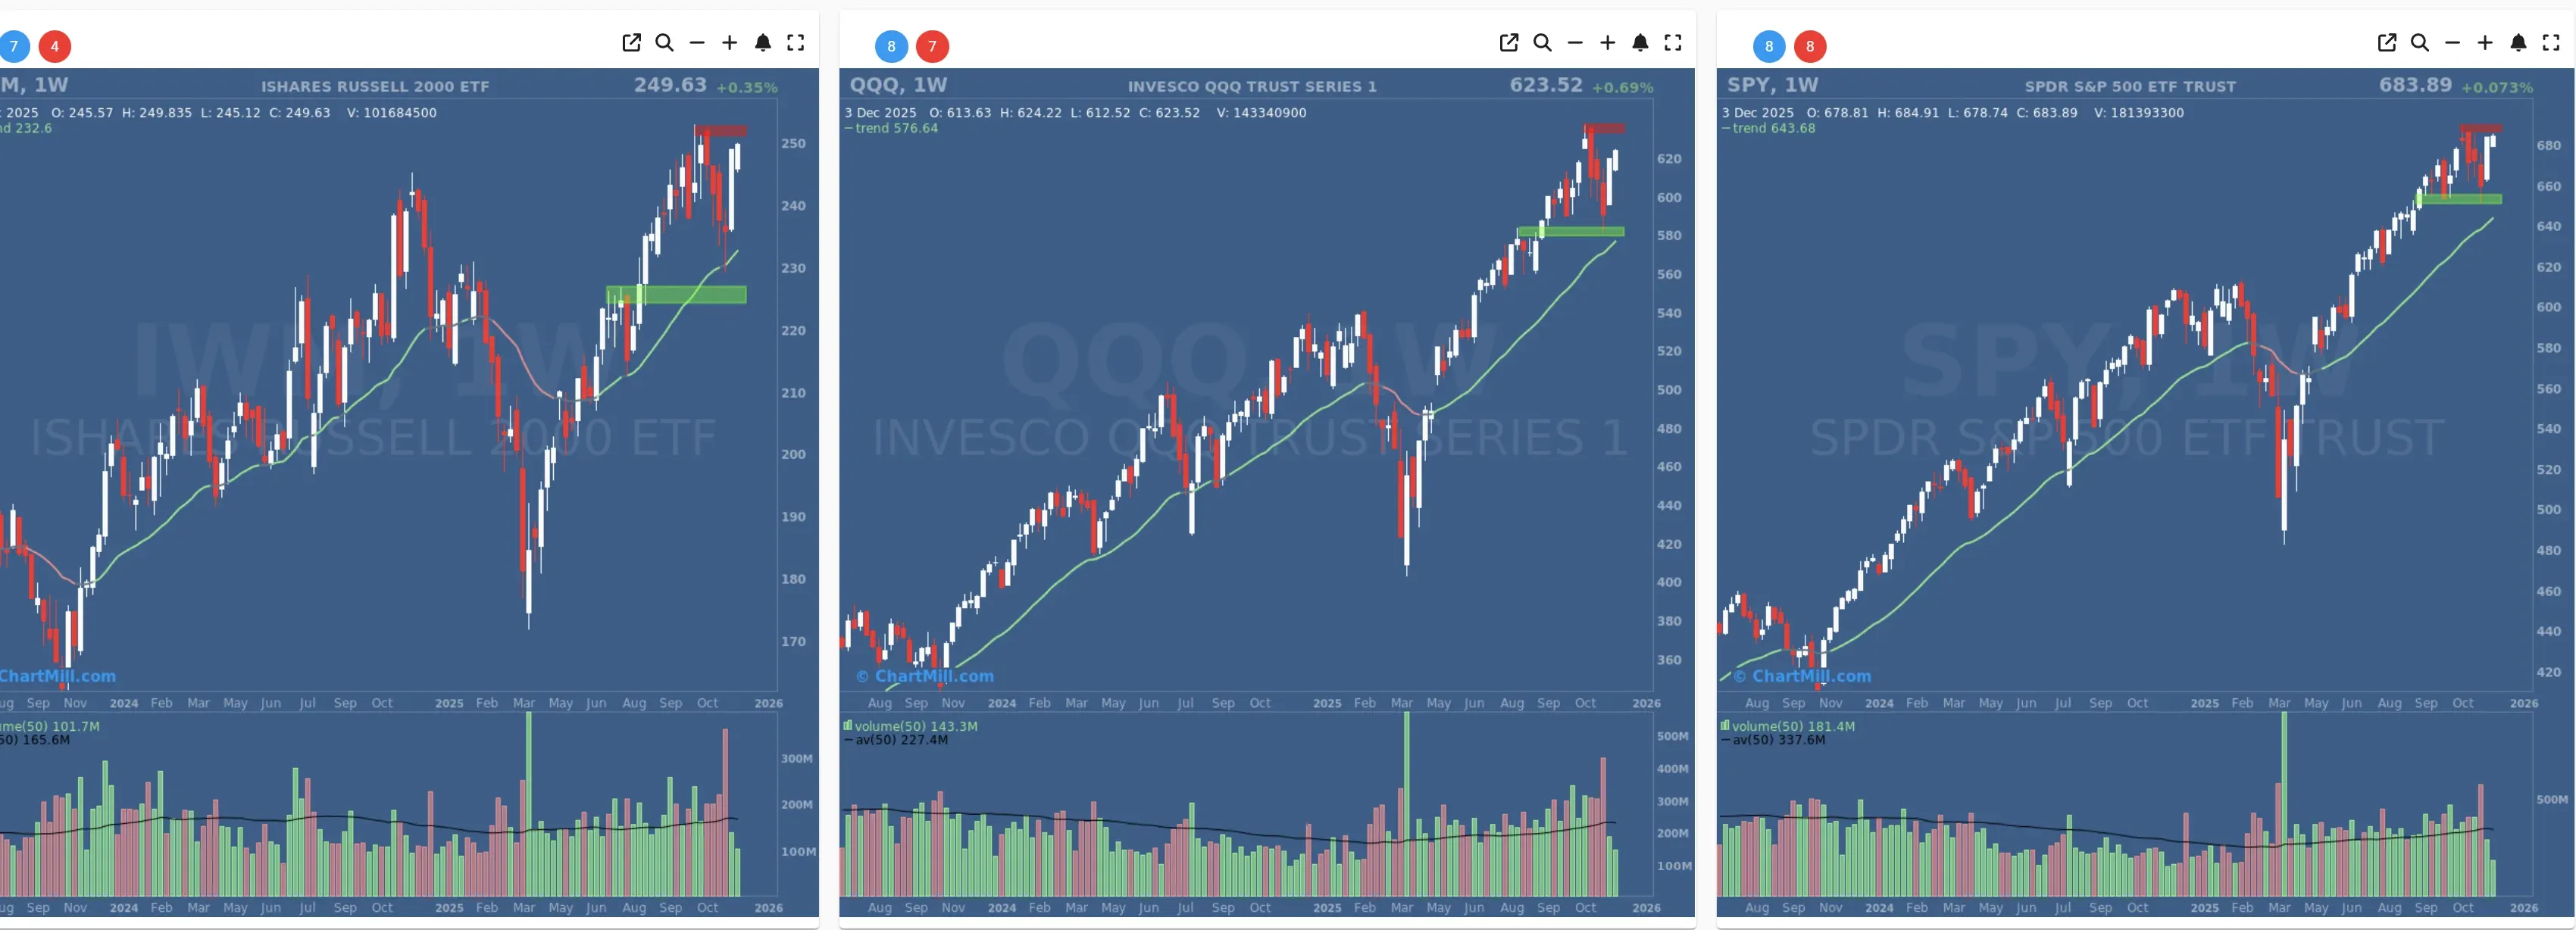
On the weekly timeframe IWM is grinding higher again after a short consolidation, but it still needs a convincing breakout above ~250 to confirm that small caps are fully back in the leadership group.
Short Term (Daily)
Long Term (Weekly)
In yesterday’s (Dec 2) breadth review we noted that price indices had bounced off support, but breadth was only neutral: advances and declines were roughly balanced, and we were waiting for confirmation that buyers, not just dip-buyers in a few mega caps, were back in charge. Today’s numbers delivered that confirmation.
Short-term breadth – a broad-based risk-on day
Advancing vs. declining issues (day):
-
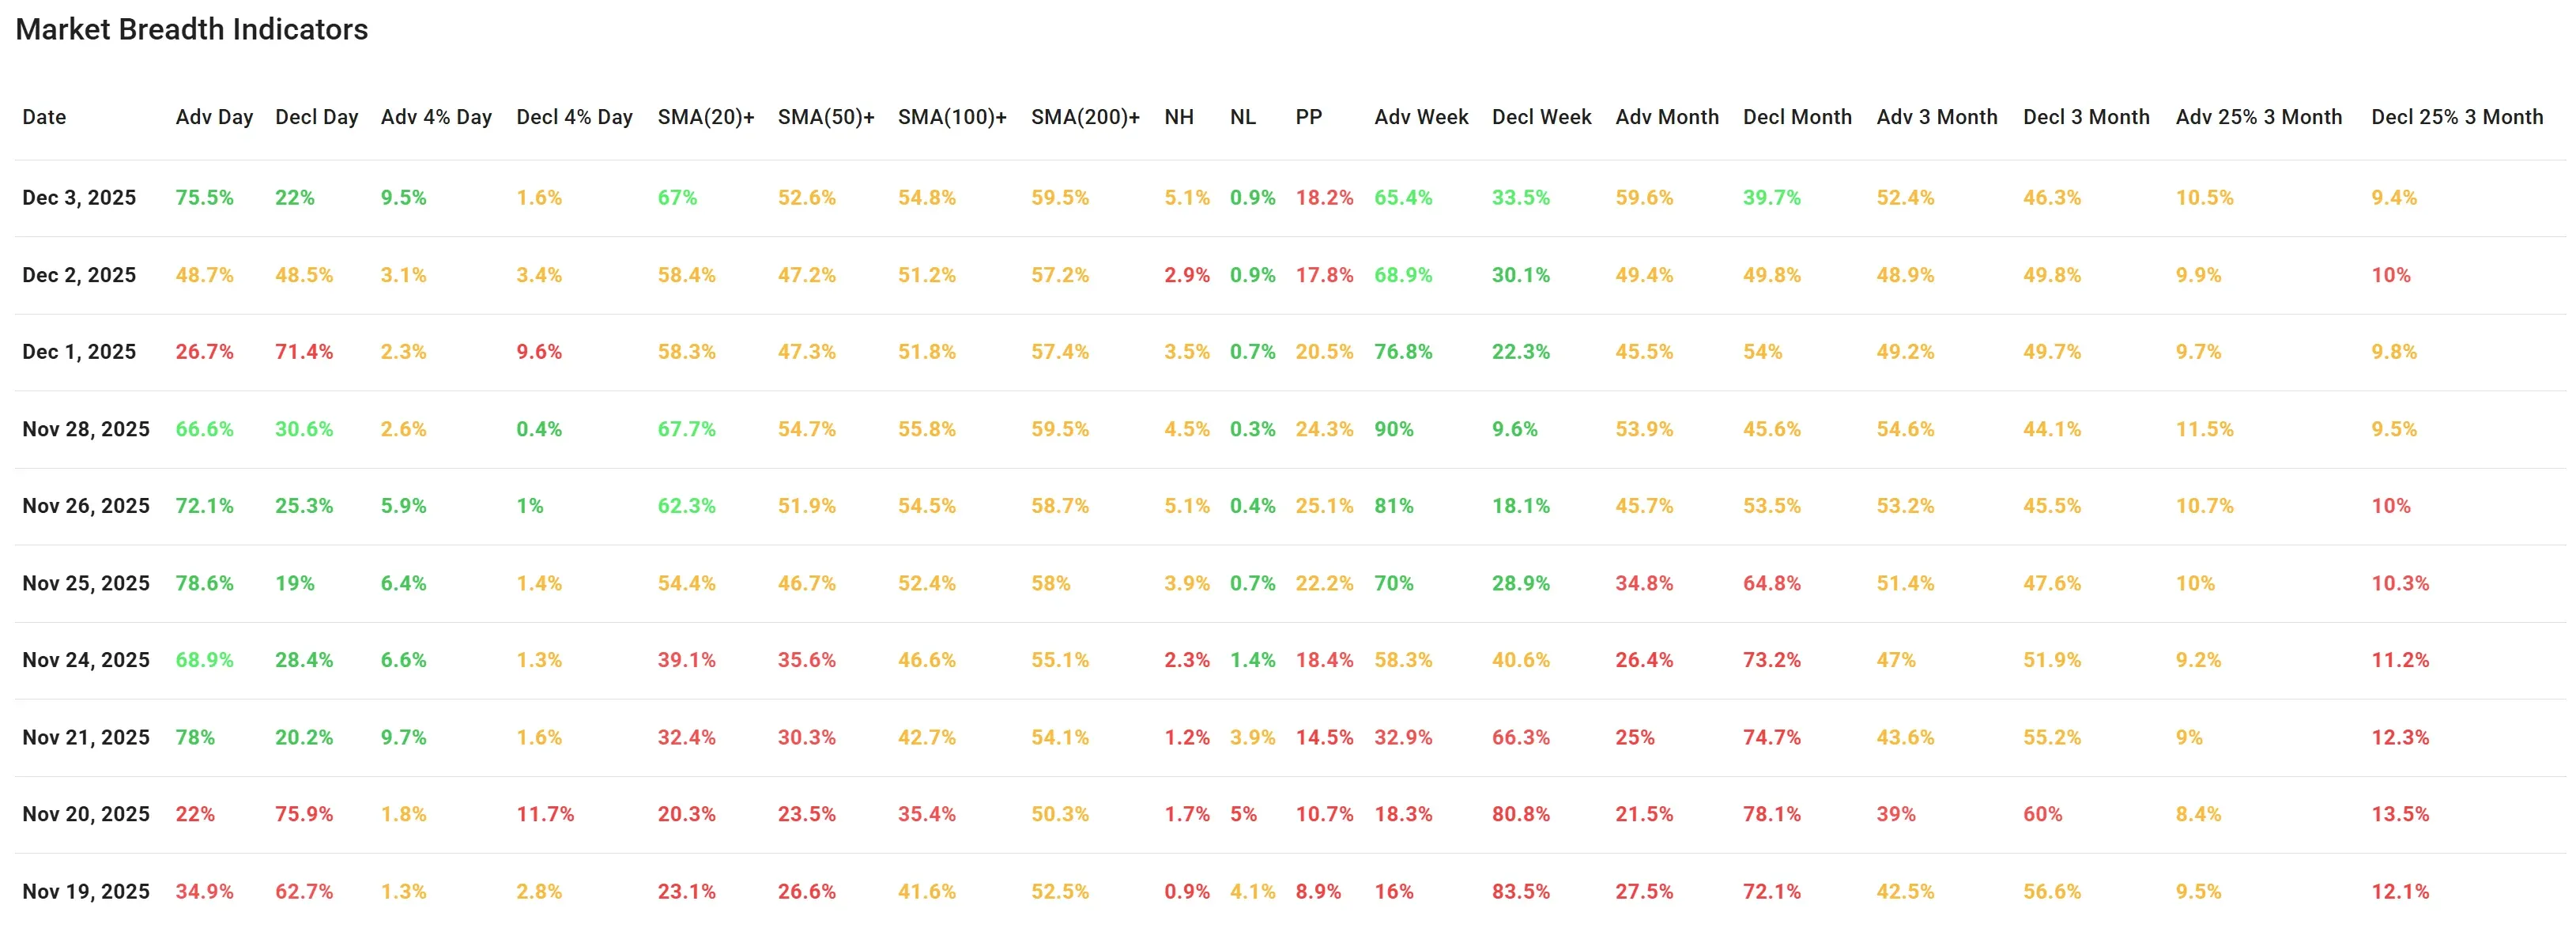
Advances: 75.5%
-
Declines: 22%
This is one of the strongest up-days in the last two weeks, comparable to the powerful sessions on Nov 25–26. It stands in stark contrast to Monday’s washout, when only 26.7% of stocks advanced and 71.4% declined, and it improves meaningfully on Tuesday’s 50/50 split.
Big movers (±4%):
-
Advancers +4%: 9.5%
-
Decliners −4%: 1.6%
Leadership participation has clearly improved: not only did most stocks close higher, but a notable subset moved strongly higher. That is a healthier profile than Tuesday, when big advancers and decliners were roughly balanced (3.1% vs. 3.4%), and even more so compared with Monday’s stress session where large losers outnumbered large winners by more than 4:1.
New highs / new lows:
-
New highs: 5.1%
-
New lows: 0.9%
New highs continue to outpace new lows by a comfortable margin, and new lows remain pinned at very low levels. The new-high figure is not yet explosive, but compared with the mid-November readings (where new lows briefly spiked above 4–5%), the improvement is unmistakable.
Pocket pivots (PP): 18.2% of stocks flashed a pocket-pivot-type accumulation signal, a slight uptick from 17.8% on Tuesday. The absolute level is a bit lower than the late-November peak above 24–25%, but still indicates a reasonable amount of institutional-style buying under the surface.
Taken together, the daily breadth statistics describe a broad, not narrow, advance: most stocks participated, the losers’ camp was small, and an above-average group of names posted outsized gains.
Trend participation – more stocks back above key moving averages
Participation above the major moving averages improved across the board:
-
Above 20-day SMA: up from 58.4% to 67%
-
Above 50-day SMA: up from 47.2% to 52.6%
-
Above 100-day SMA: up from 51.2% to 54.8%
-
Above 200-day SMA: up from 57.2% to 59.5%
The key milestone here is the 50-day cohort: back above the 50% threshold after hovering just below it for two sessions. Short-term weakness around Nov 19–20 pushed many stocks under their intermediate trendlines, but since then we’ve seen a steady climb: 50-day participation has risen from roughly 23–30% in mid-November to above 50% now.
This broadening of participation is consistent with what we see on the charts: not just mega-caps but an expanding set of sectors and market caps (including IWM) are re-aligning with the dominant uptrend.
The medium-term breadth measures, which smooth out daily noise, also took a constructive step forward:
-
Weekly performance breadth:
-
Advancing week: 65.4%
-
Declining week: 33.5%
The bulk of the market is positive over the rolling one-week window, even with Monday’s hit still included. That’s slightly softer than the extreme 90% reading from Nov 28 but remains clearly supportive.
1-month performance breadth:
-
Advancing month: jumps from 49.4% to 59.6%
-
Declining month: falls from 49.8% to 39.7%
This is a notable inflection: as of yesterday, the 1-month tape was essentially 50/50; today it shifts to a clear majority of stocks being up on a one-month basis. Recent weakness is being absorbed rather than turning into a sustained downswing.
3-month performance breadth:
-
Advancing 3-month: rises from 48.9% to 52.4%
-
Declining 3-month: eases from 49.8% to 46.3%
Here too, the balance has just swung back to the positive side, though only modestly. Over a quarter-year horizon the market is constructive but not extended, which leaves room for continuation if current conditions persist.
3-month ±25% movers:
-
Up >25%: 10.5%
-
Down >25%: 9.4%
For the first time in this recent sequence, there are slightly more big winners than big losers over the last three months. The gap is small, but the direction is encouraging: leadership is forming at the top of the distribution rather than at the bottom.
Putting it all together – breadth trend rating
Over the last ten trading days, the pattern has been:
-
A brief bout of severe weakness around Nov 20, which we previously flagged as a warning shot but not (yet) a full trend change.
-
A powerful breadth recovery into late November, with several 70–80% advance days.
-
A sharp but contained pullback on Dec 1 at index resistance, followed by Tuesday’s neutral consolidation.
-
Today’s broad, decisive up-day, led by small caps and supported by improving participation above all key moving averages.
The unresolved question from yesterday’s analysis was whether Monday’s sell-off marked the start of a larger distribution phase at the highs, or just another shakeout within an ongoing advance. Given Wednesday’s breadth and price action, the evidence has shifted clearly toward the latter: so far, it looks like another shakeout that was quickly bought.
At the same time, the indices are again pressing into well-defined resistance zones with only moderate new-high expansion and a still-modest share of stocks up more than 25% over three months. That argues for respect of the uptrend, but also for awareness that the market is not in a “blow-off” phase yet and could still see choppy trading around these levels.
Breadth trend rating: Positive
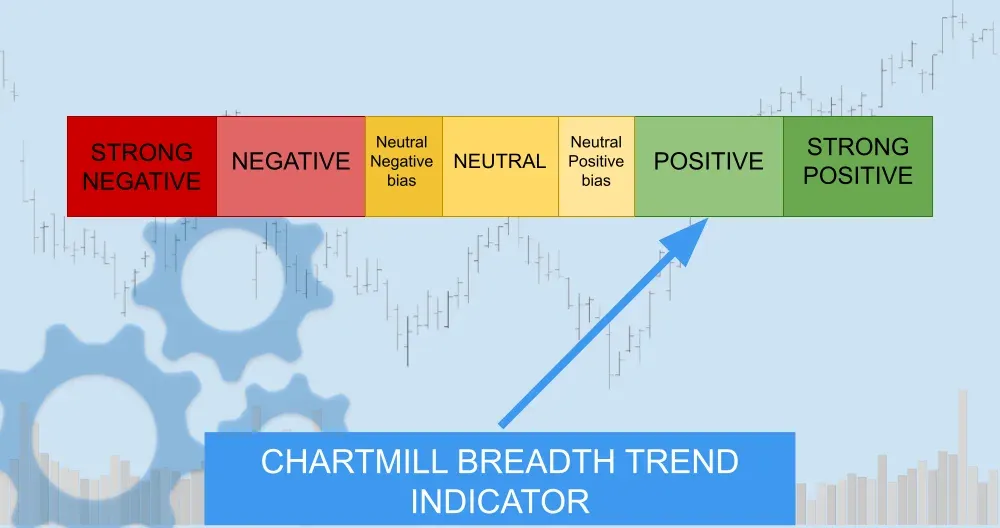
The short- and medium-term data now align on the bullish side: strong advance/decline ratios, improving moving-average participation, and monthly/3-month metrics that have flipped back to majority-positive. It’s not “very positive” yet because resistance overhead is still unbroken and long-term leadership is not excessively broad, but for now the benefit of the doubt clearly goes to the bulls.
Key things to watch next
-
Whether SPY and QQQ can finally break above their current red resistance bands on expanding new highs.
-
If IWM can convert today’s surge into a sustained breakout above ~250, confirming a more durable small-cap participation phase.
-
The persistence of daily breadth: maintaining advance ratios above 60% and keeping new lows below 1% would reinforce today’s return of risk-on sentiment.
Kristoff - ChartMill
Next to read: Weak Jobs, Strong Hopes: Wall Street Bets on Fed Cuts While AI Hype Hits a Speed Bump