

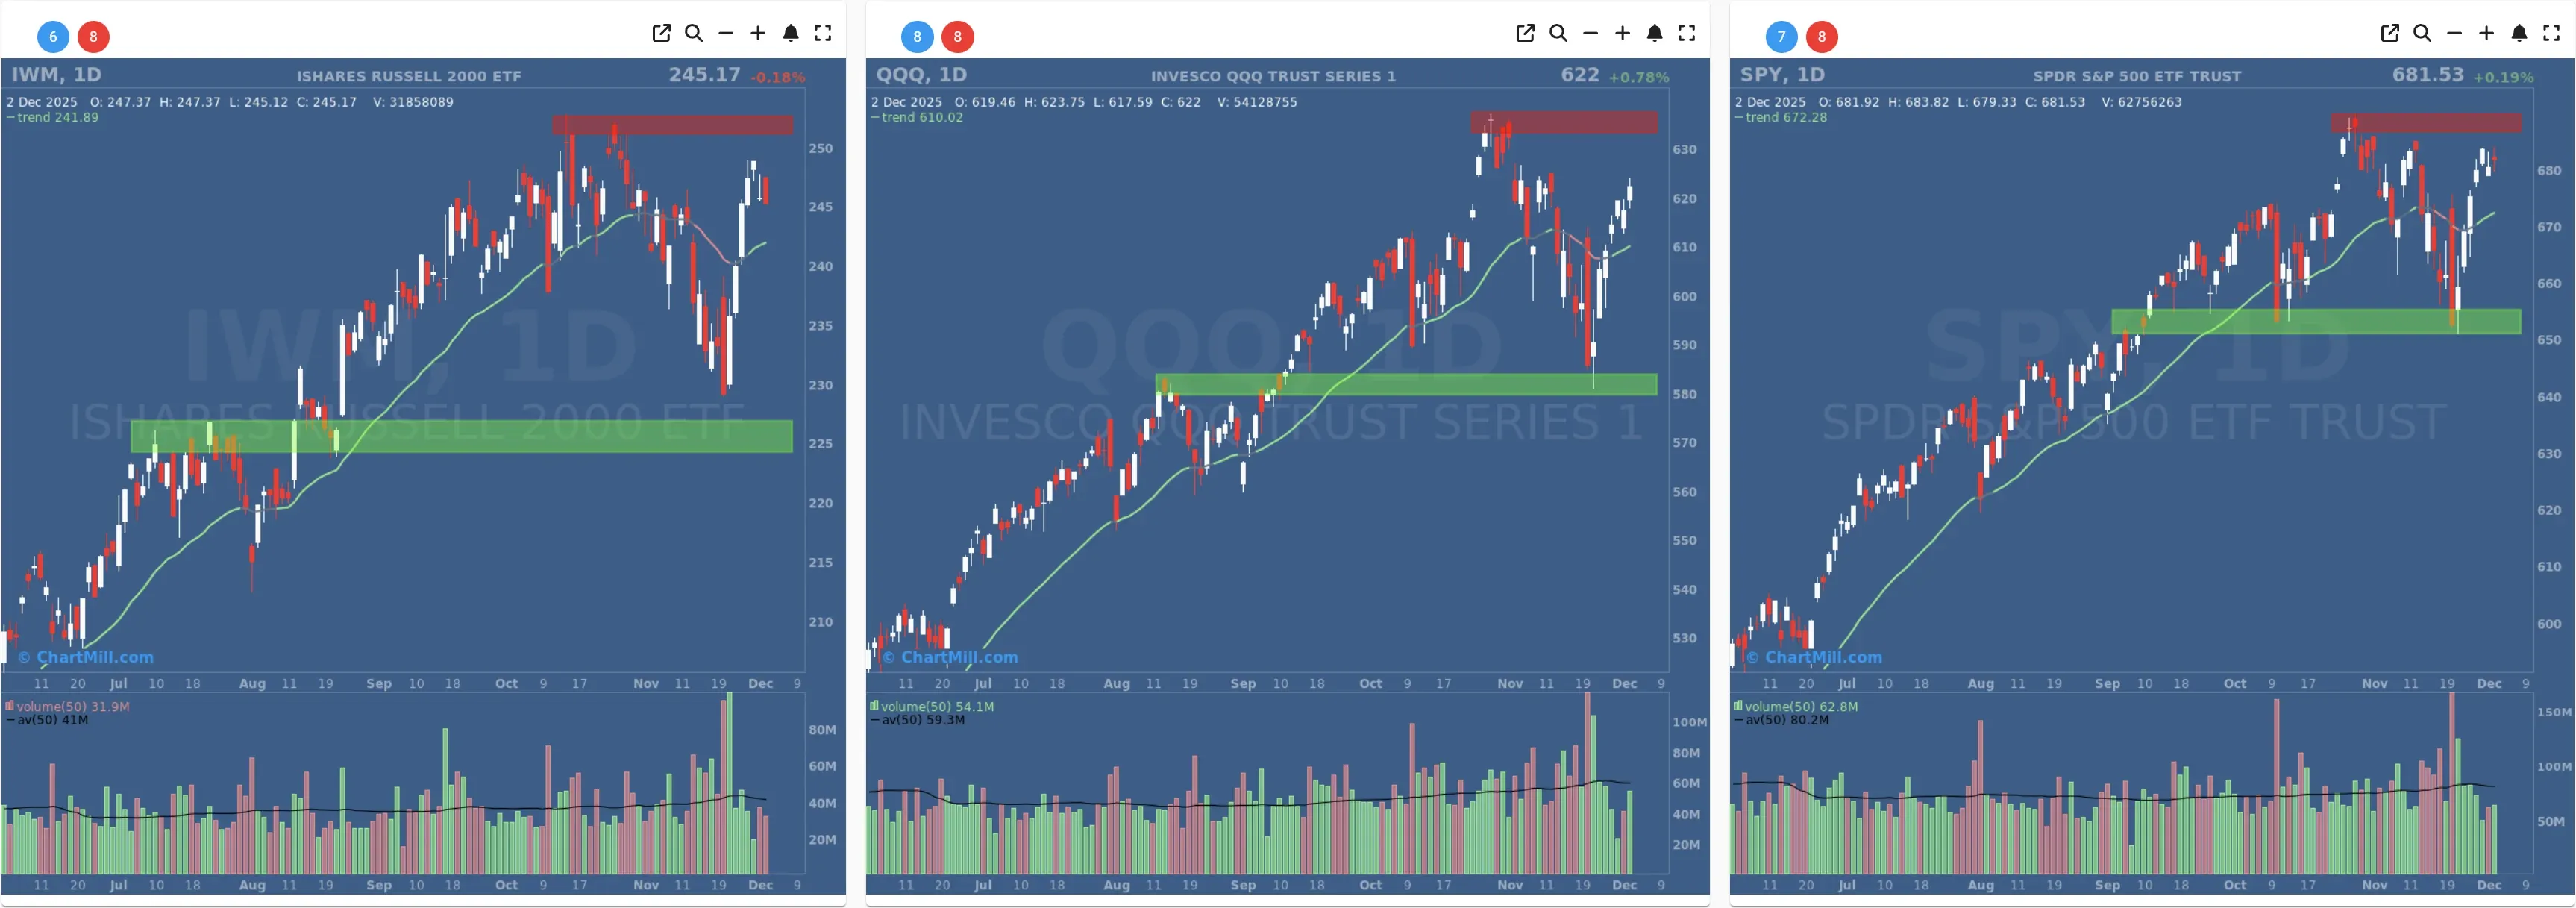
Index overview – mixed day near resistance
SPY closed slightly higher around +0.2%, finishing just below the recent resistance zone highlighted on the chart.
Monday’s sharp drop was partially repaired, leaving a short-term trading range under the red resistance band and above the green support zone around the prior breakout area.
The 20-day moving average is still rising and price remains comfortably above it, so the primary trend stays bullish even as upside progress slows.
QQQ outperformed with a gain of about +0.8%, reclaiming a good portion of Monday’s loss.
Price sits close to all-time highs and back inside the upper consolidation area. Tech and growth leadership is still intact.
The pullback now looks more like a one-day shakeout than the start of a deeper correction, at least for the large-cap growth space.
IWM slipped roughly -0.2%, lagging both SPY and QQQ.
Small caps remain below their recent high and are backing off from the resistance band marked on the chart.
On the weekly timeframe, IWM is still in a clear uptrend, but the recent bar shows more hesitation than in SPY/QQQ, hinting at some early rotation away from the more speculative end of the market.
Takeaway: Index behaviour is consistent with “orderly digestion near highs” rather than a decisive trend change. SPY and QQQ bounced; IWM hesitated. That divergence matches what we see under the surface in the breadth data: strength is still present, but leadership is becoming more selective.
Short Term (Daily)
Long Term (Weekly)

Short-term breadth – from broad sell-off to almost balanced
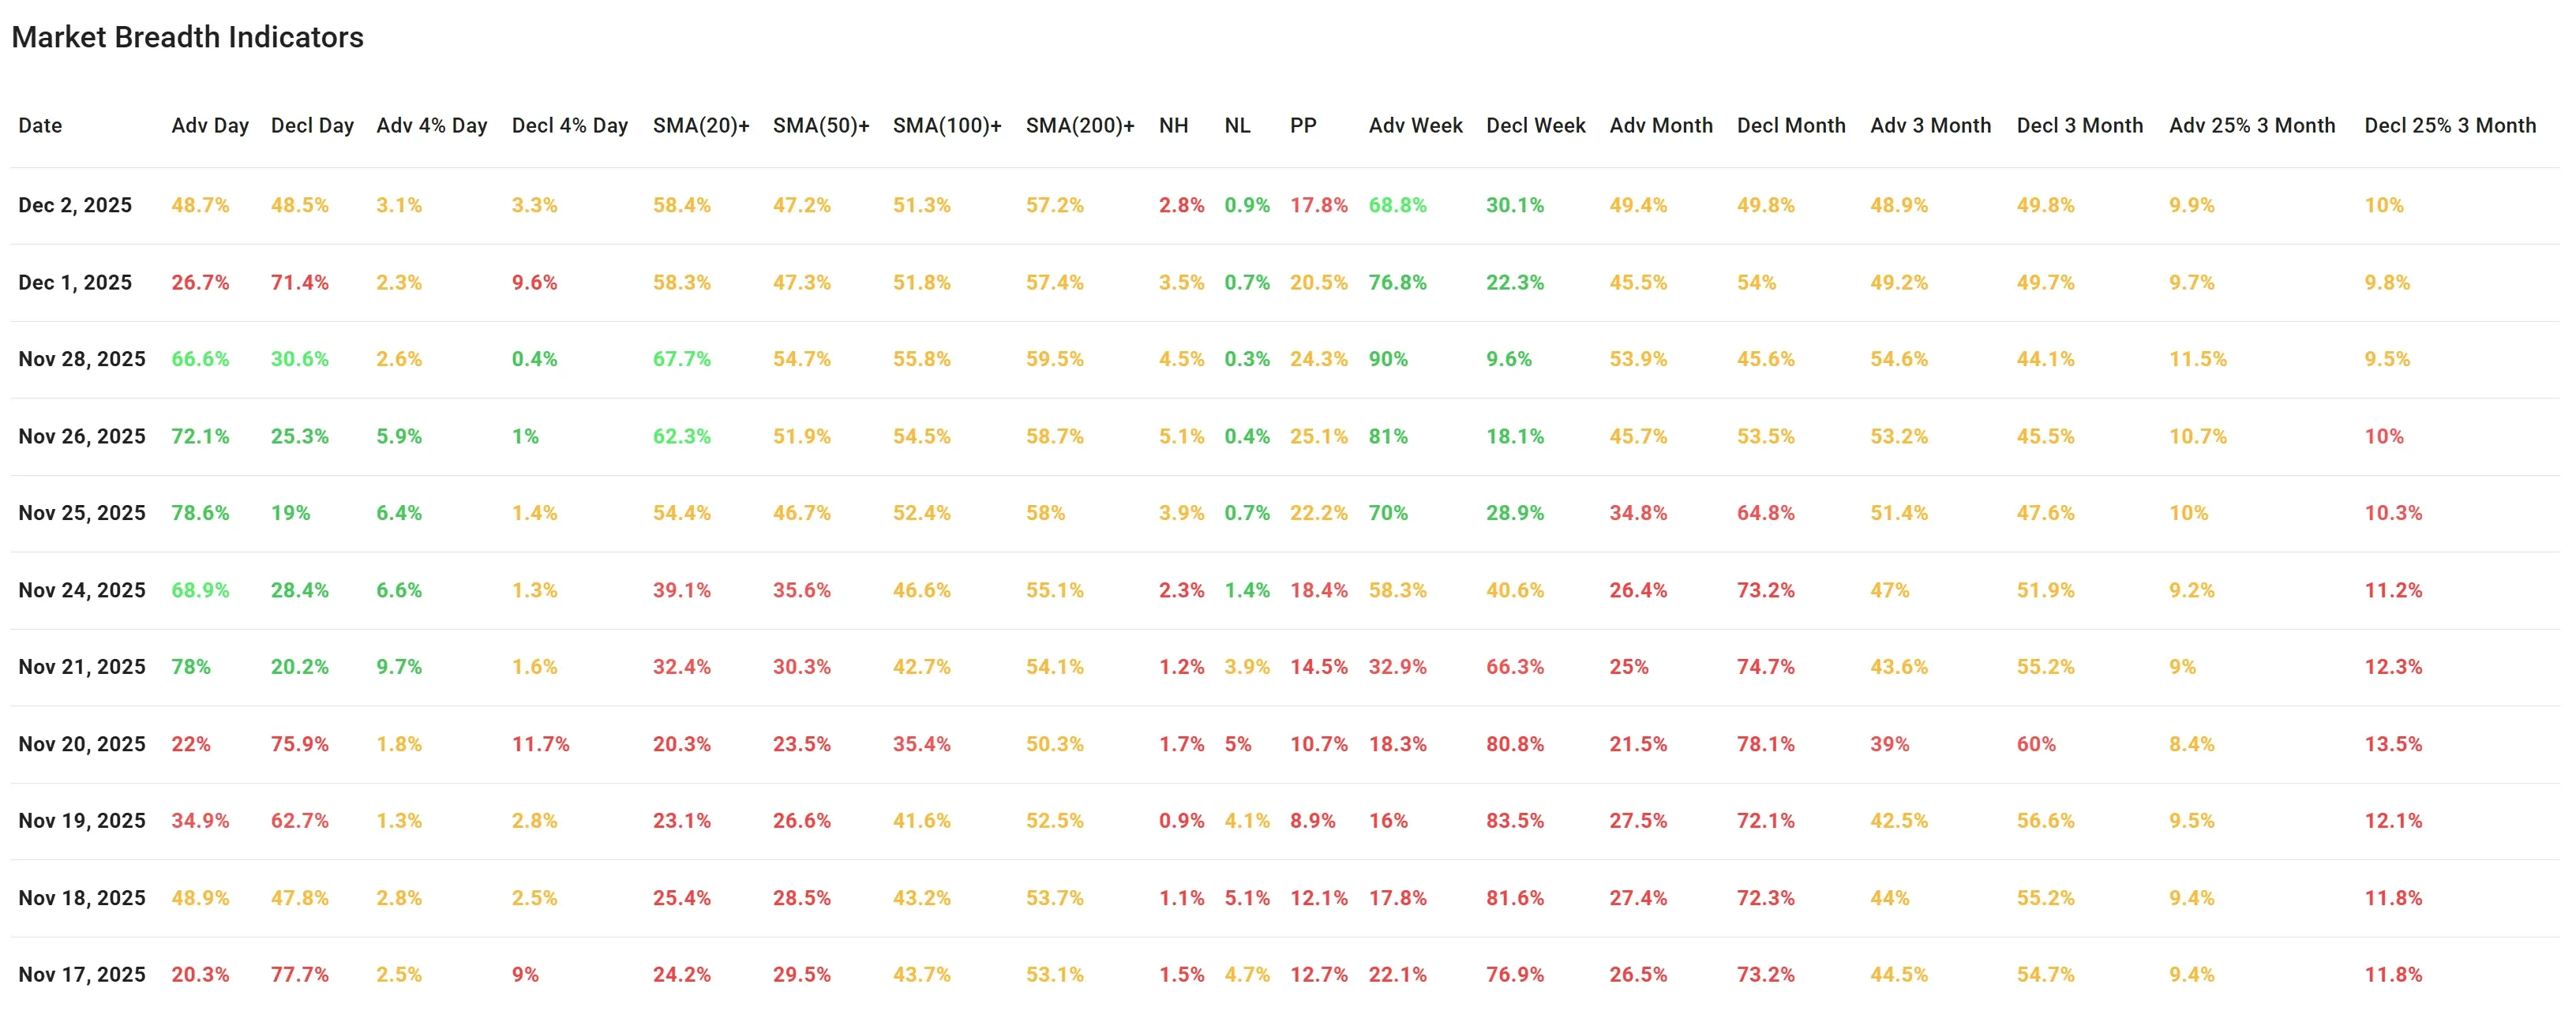
Breadth on Monday, Dec 1 was clearly negative, it was one of the weakest one-day readings since the Nov 20 setback and we flagged it as a potential distribution day after a series of very strong breadth sessions the week before.
On Tuesday, Dec 2, that pressure eased noticeably:
-
Advancing vs. declining: 48.7% vs 48.5% – essentially a stalemate.
-
4% movers: 3.1% up ≥4% vs 3.3% down ≥4% – extreme moves sharply reduced on both sides.
So instead of a second wave of broad selling, the market transitioned into a pause day: neither bulls nor bears dominated. This is exactly the type of follow-up you want to see if Monday was mainly profit-taking after a strong run, rather than the start of a new corrective leg.
Medium-term breadth – still constructive despite the wobble
Despite Monday’s hit, the medium-term indicators remain reasonably healthy:
-
Above 20-day SMA: 58.4% (virtually unchanged from 58.3% on Dec 1).
-
Above 50-day SMA: 47.2% (vs 47.3% yesterday).
-
Above 100-day SMA: 51.3% (down only slightly from 51.8%).
-
Above 200-day SMA: 57.2% (vs 57.4%).
In other words, more than half of the universe is still in established uptrends based on the 100- and 200-day averages, and just under half are above the 50-day. Monday’s drop barely moved these medium-term gauges.
The weekly breadth series reinforces this message:
-
Advancing week: 68.8%
-
Declining week: 30.1%
Even with Monday included, nearly seven out of ten stocks are up over the last five trading days, thanks to the very strong cluster of breadth readings seen between Nov 21 and Nov 28 (multiple days with 66–79% advancers). That prior thrust is still doing most of the heavy lifting for the trend.
Longer-term breadth – momentum cooling, but no structural damage
Looking at the broader window:
-
Advancing month: 49.4% vs Declining month: 49.8% – essentially flat.
-
Advancing 3-month: 48.9% vs Declining 3-month: 49.8% – likewise balanced.
-
Up at least 25% in 3 months: 9.9%
-
Down at least 25% in 3 months: 10.0%
These readings tell us that the big 3-month winners and losers are matched in size, and the average stock isn’t strongly skewed one way or the other over that timeframe. That’s not what you’d see if the market were in a sustained downtrend, but it also says the explosive upside momentum from earlier in the quarter is moderating.
The new high / new low data shows a similar pattern:
-
New highs: 2.8% (down from 3.5% on Monday and 4.5% on Nov 28).
-
New lows: 0.9% (slightly up from 0.7%, but still low).
New highs continue to outnumber new lows by roughly 3:1, which remains a positive sign. However, the percentage of stocks pushing to new highs has been slipping from its peak late last week, confirming that the rally is maturing and fewer names are leading.
The Pocket Pivot metric (percentage of stocks in stronger breakout/leadership configurations) also eased to 17.8% from 20.5% on Monday and 24.3% last Friday, another indication that leadership is narrowing.
Comparing with the previous breadth update
In yesterday’s analysis (Dec 1), the main takeaway was:
After an extended stretch of strong breadth (Nov 21–28), the market finally printed a broad, heavy down day. However, medium- and longer-term indicators stayed supportive, so we viewed it as a warning shot rather than evidence of a completed top. We highlighted the importance of follow-through: either continued selling to confirm a shift in character, or quick stabilisation to label the move as a shakeout.
Today’s session clearly fits the second scenario:
-
No follow-through damage. Short-term breadth reverted from heavily negative to essentially neutral.
-
Indices held support zones. SPY and QQQ bounced off their nearby support / breakout regions, and remain above rising moving averages.
-
Leadership narrowed but didn’t disappear. QQQ’s outperformance versus a flat IWM suggests investors are still comfortable owning large-cap growth, even if they’re more cautious further down the cap spectrum.
So, relative to yesterday, the overall story has shifted from “watch this carefully” to “shakeout contained for now, but momentum is cooling.”
Interpreting sentiment and possible drivers
Given the context - indices at or near all-time highs after a strong multi-week advance - the combination of monday’s broad sell-off and tuesday’s neutral, low-intensity session is consistent with profit-taking and short-term positioning adjustments rather than a sudden deterioration in fundamentals. Without tying it to any specific headline, the behaviour fits a market digesting gains and reassessing risk at elevated levels.
Small-cap underperformance (IWM) hints at a mild risk-off tilt beneath the surface, but as long as new lows remain scarce and medium-term breadth stays above 50%, this looks more like rotation than outright risk aversion.
Breadth trend rating
Taking all indicators together:
-
Strong weekly breadth and healthy new high vs new low balance.
-
Medium-term averages still show a majority of stocks in uptrends.
-
Short-term breadth has recovered from Monday’s shock but did not swing back to clearly bullish.
-
Leadership is narrowing (QQQ vs IWM) and breakout momentum is cooling.
Current breadth trend rating: neutral with a positive bias.

The underlying trend remains constructive, but the market is clearly in “earn it” mode near resistance: upside is still possible, yet further digestion or brief corrective phases would not be surprising, especially if small caps continue to lag or if we see additional distribution days build up near the highs.
Kristoff - ChartMill
Next to read: Wall Street Rebounds as Boeing Takes Off, MongoDB Soars and Bitcoin Snaps Back Above $91K