
Index overview – SPY, QQQ and IWM
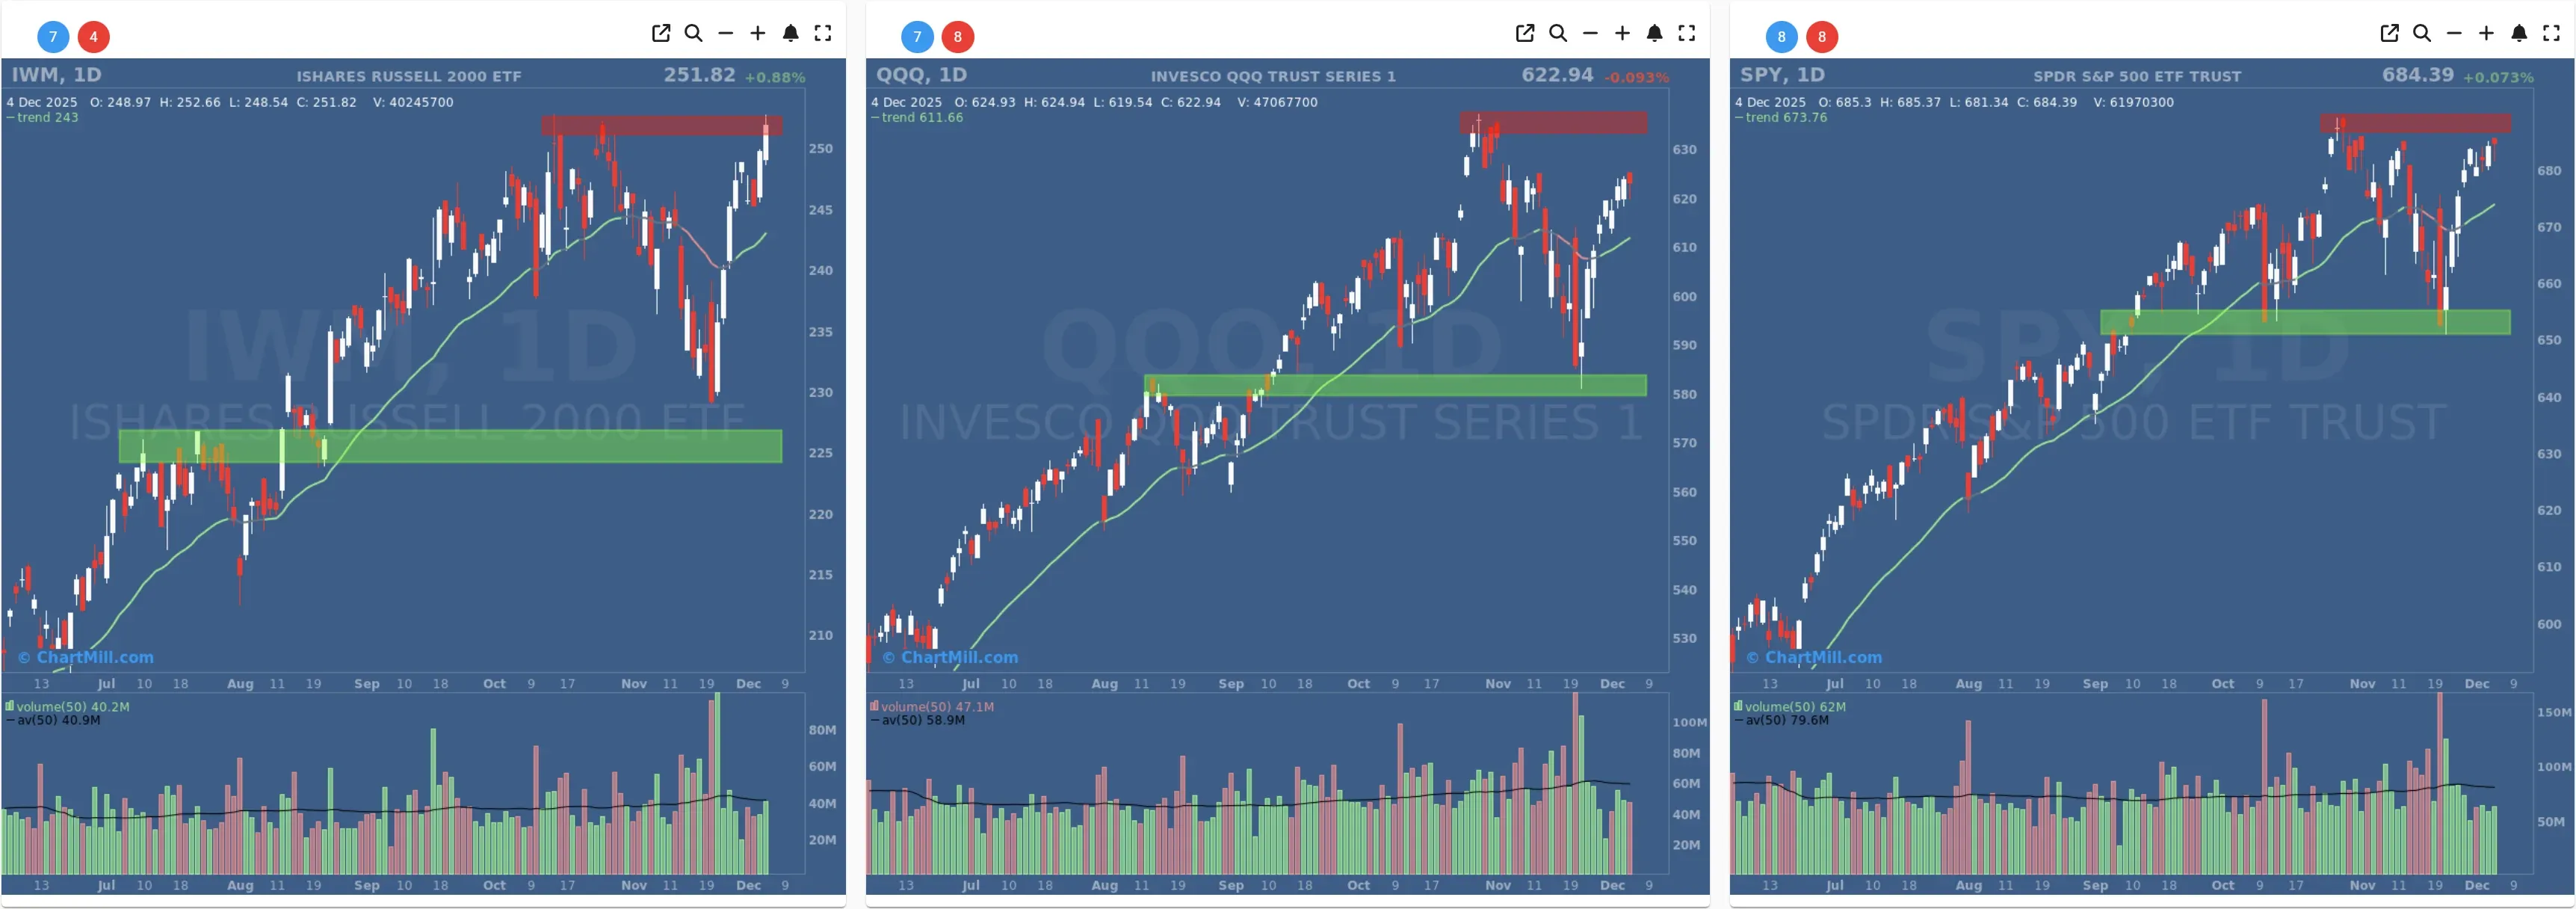
SPY is back in the upper part of its recent range, essentially retesting the red resistance band around the prior highs. Price sits comfortably above the ChartMill Trend Indicator and well above the green support area created by the late-November pullback.
Compared with yesterday’s strong candle, today looks more like a smaller follow-through bar, buyers kept control, but momentum cooled as SPY presses into overhead supply.
QQQ shows the same pattern in a slightly stronger form. After yesterday’s broad-based surge, QQQ is now only a few points below its recent peak, with a clear rising trend on the daily and weekly charts.
The ETF is stretched above its support zone around 590–600, suggesting the trend is intact but short-term risk/reward is less favorable until we either get a clean breakout above the red zone or a controlled pullback.
Small caps continue their catch-up move. IWM has rallied sharply off the green support zone near 228–230 and is now pushing directly into a major resistance area around 250–252 that has capped rallies several times in the past. On the weekly chart this area still looks like a potential double top.
A decisive breakout by IWM would be an important confirmation that the rally is broadening beyond mega caps; for now, it’s a strong move into resistance, not yet a confirmed breakout.
Short Term (Daily)
Long Term (Weekly)
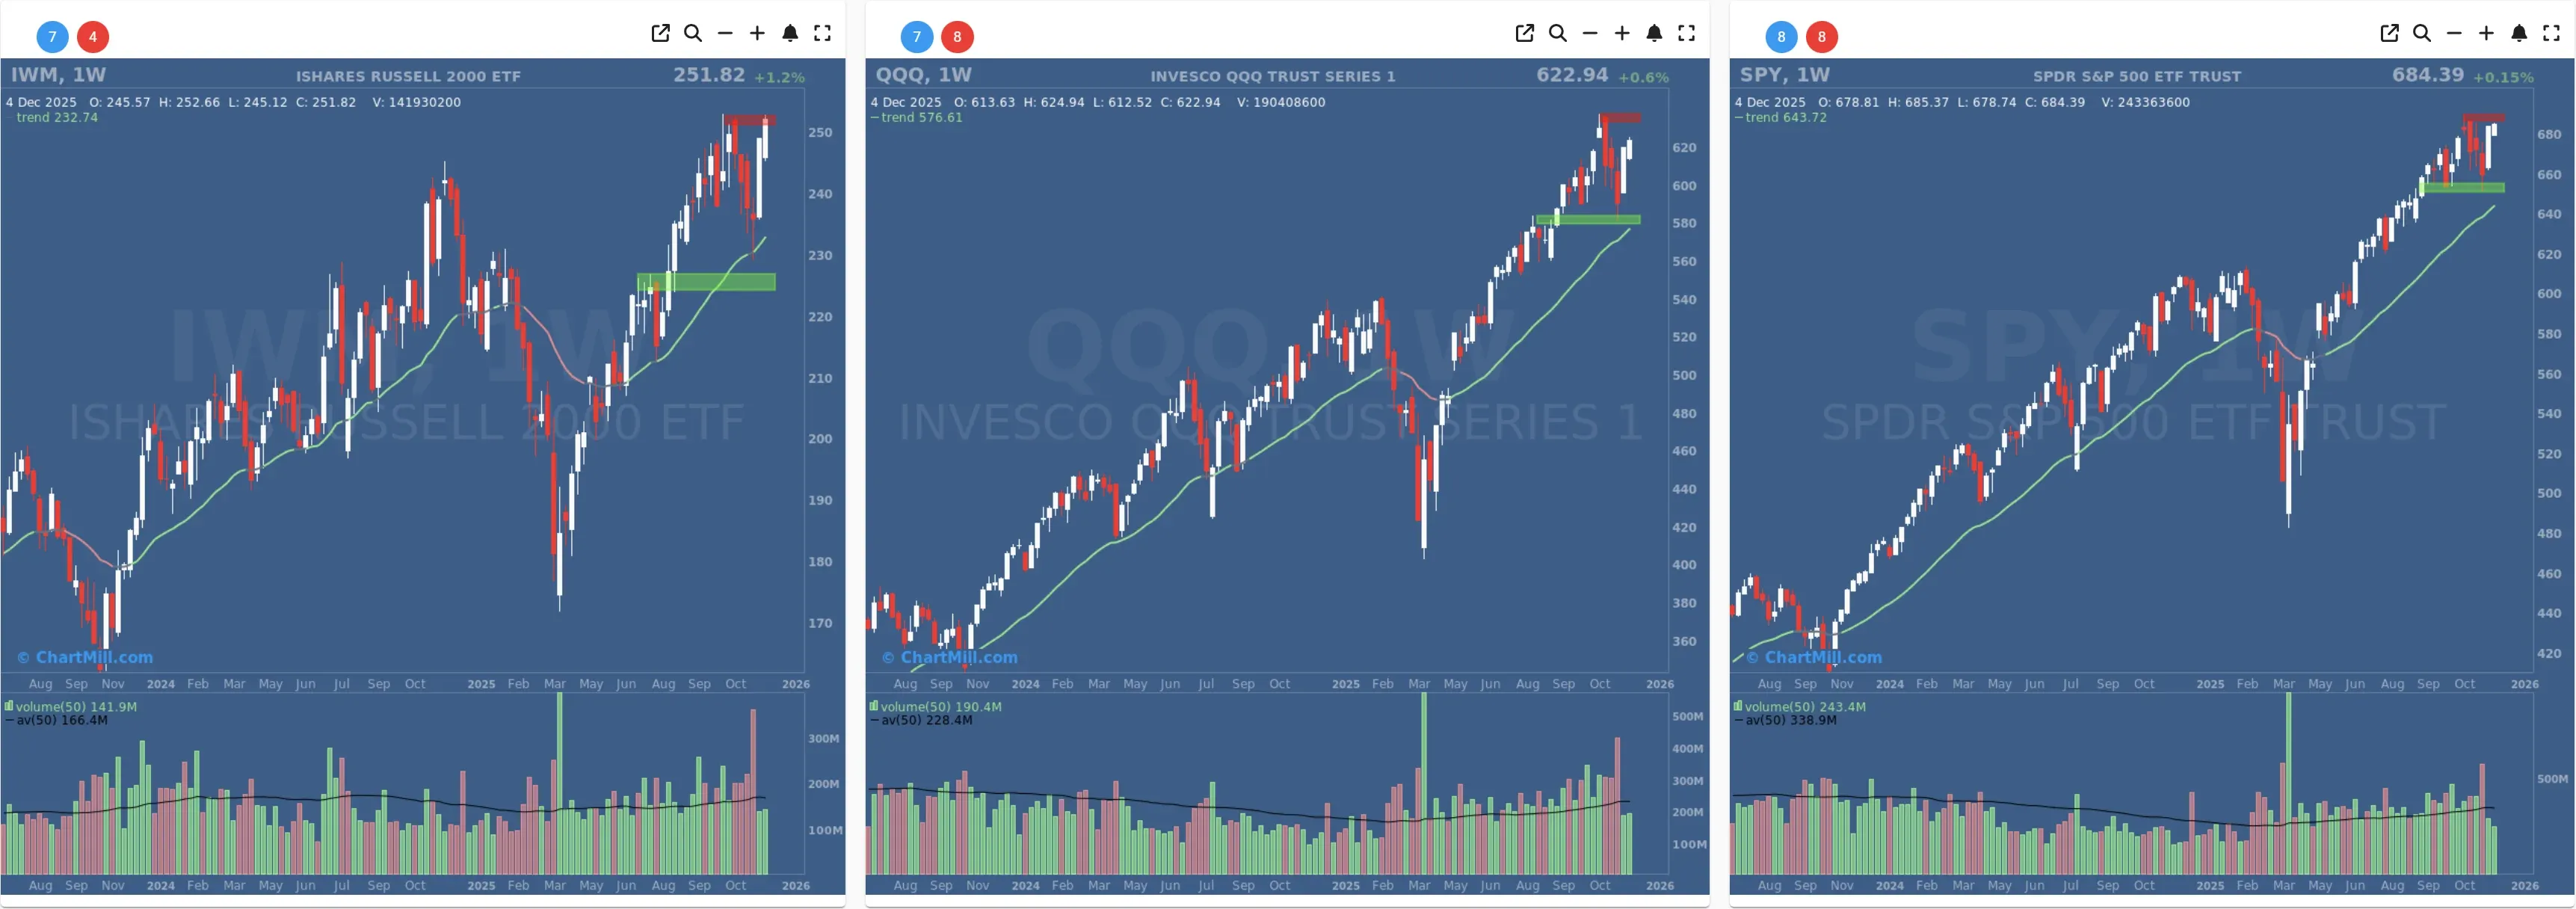
Across all three ETFs the weekly trend remains firmly up, but all are now pressing against clearly defined resistance bands. That fits well with the breadth data: positive, but no longer in “all-out thrust” mode.
Short-term breadth – cooling after yesterday’s surge

Comparing today with the previous session:
-
Advancing vs. declining issues (day)
-
Today: 53.5% advancers vs. 43.5% decliners
-
Yesterday: 75.5% vs. 22%
The market shifted from a very strong breadth surge to a mild positive bias. Buyers still had the upper hand, but the move was no longer one-sided.
-
Big movers (±4%)
-
Advancers +4%: 6.8% (down from 9.5%)
-
Decliners −4%: 1.4% (slightly below 1.6%)
We still see more big winners than losers, but the intensity of the thrust eased.
Stocks above key moving averages
-
Above 20-day: 67.6% (virtually unchanged from 67%)
-
Above 50-day: 53% (up slightly from 52.6%)
-
Above 100-day: 54.3% (slightly below 54.8%)
-
Above 200-day: 59.4% (flat vs. 59.5%)
These readings confirm a stable uptrend: a clear majority of stocks trade above short- and long-term moving averages, but there is no new expansion in participation yet.
-
New highs vs. new lows
-
New highs: 5.8% of stocks
-
New lows: 0.7%
New highs ticked up slightly, new lows remain very low. Breakouts are happening, but they are not yet explosive, leadership remains selective.
The sequence of the last four sessions is instructive: a very weak breadth day on Dec 1, a neutral day on Dec 2, then a strong thrust on Dec 3 and a more moderate positive day yesterday. Net-net, the bulls have clearly wrestled back control after Monday’s wobble.
Medium-term breadth – constructive, not euphoric
Looking at the rolling windows:
1-week breadth:
-
Advancing week: 60.9%
-
Declining week: 37.9%
Short-term breadth over the last week remains firmly positive despite today’s calmer session.
1-month breadth:
-
Advancing month: 58.1%
-
Declining month: 41.1%
The one-month window still favors advancers by a decent margin, even after the sharp down day on Dec 1.
3-month breadth:
-
Advancing 3-month: 52.3%
-
Declining 3-month: 46.4%
Over three months the picture is more balanced – this has been a grind higher with rotations, not a straight-line melt-up.
Big 3-month winners/losers (±25%)
-
Up ≥25%: 11.3%
-
Down ≥25%: 9.1%
There are more medium-term winners than losers, but the gap is modest. Enough leadership to sustain the trend, not enough to scream “late-stage blow-off”.
Overall, the medium-term message is that breadth is broadly supportive of the rally but far from extreme.
Takeaways and risk balance
-
The primary trend remains up across SPY, QQQ and IWM on both daily and weekly time frames.
-
Breadth has shifted from a powerful thrust (yesterday) to a more normal, slightly positive day as indexes press up against resistance.
-
Participation above key moving averages is healthy and stable rather than accelerating. Constructive, but not a fresh breadth breakout.
-
New highs are improving, new lows are subdued, which is exactly what the bulls want to see as long as it continues.
For active traders this often argues for being selective: focusing on pullbacks in strong names or waiting for clean breakouts with confirming breadth rather than chasing everything that is already extended.
Breadth Trend Rating
On the 1–7 scale, current breadth trend rating: 6 – positive
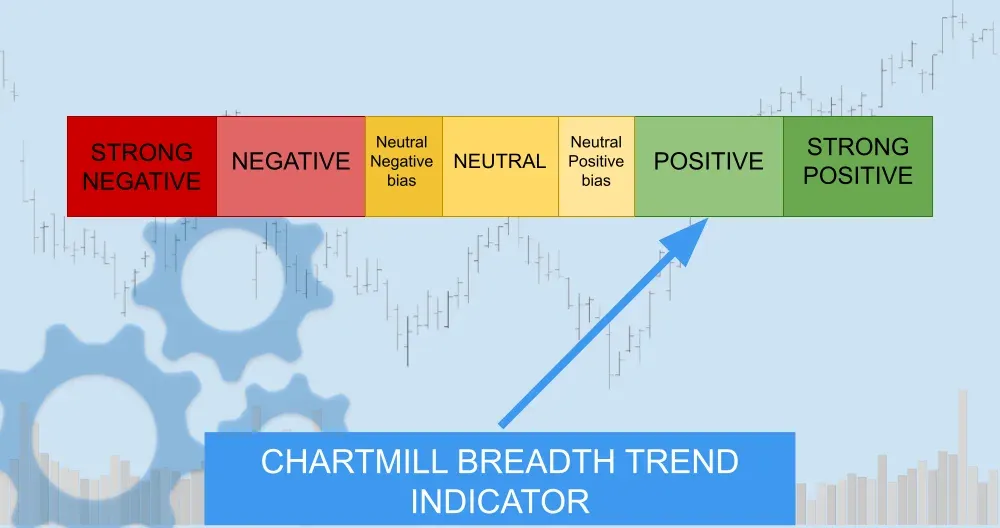
Breadth remains clearly supportive of the uptrend, but the latest data show cooling momentum as the rally meets resistance. This is still a favorable environment for the bulls, just one that is gradually shifting from “thrust” to “manage risk and look for higher-quality entries.”
Kristoff - ChartMill
Next to read: Thrifty Shoppers and a Metaverse Diet: Discount Chains Shine as Wall Street Waits on the Fed