
(All data & visualisations by ChartMill.com)
Daily Market Trend Analysis – September 09, 2025 (After Market Close)
US Index-ETF's showing volatility contraction patterns near all-time high levels (SPY & QQQ in particular).
Short Term Trend
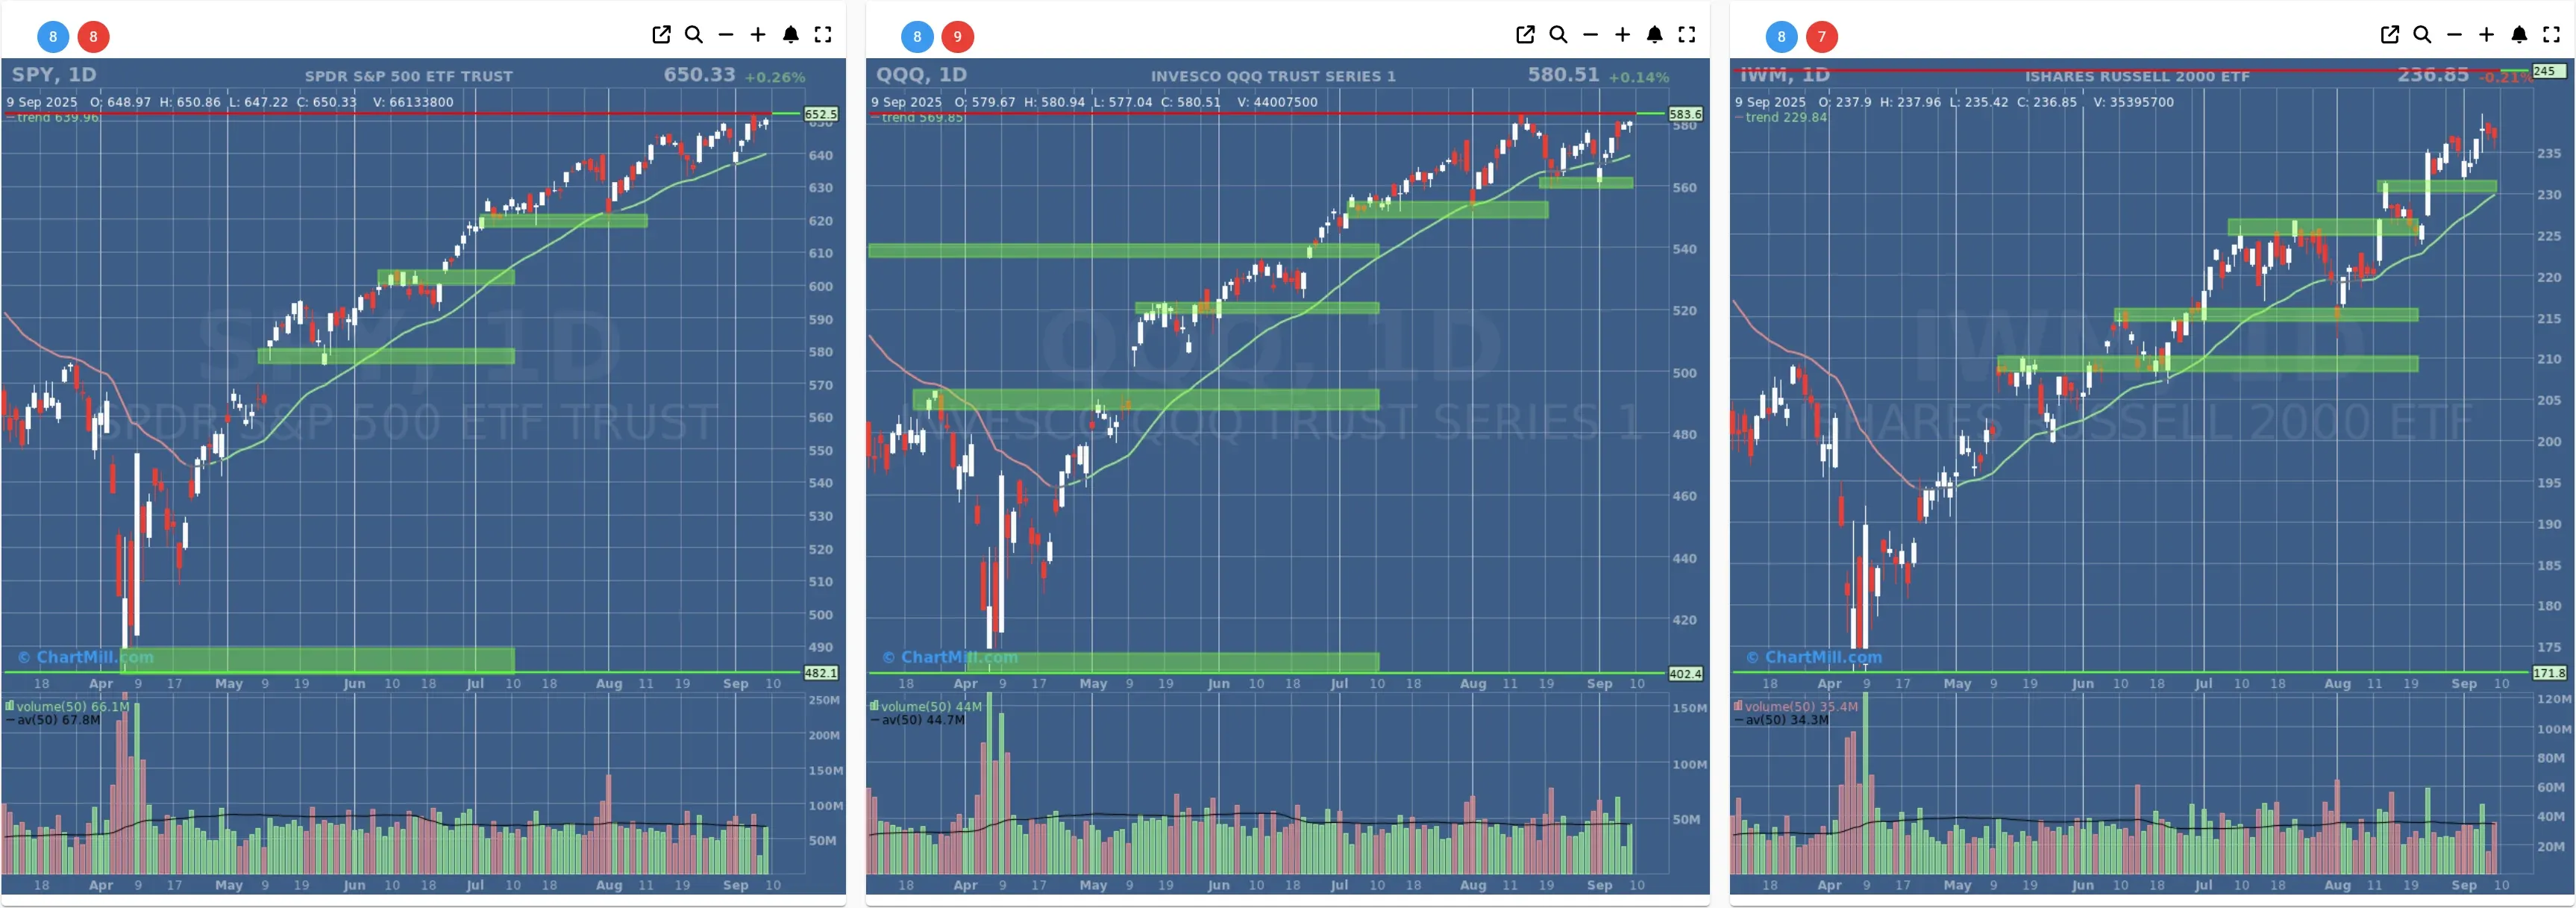
- Short-Term Trend: Positive (no change)
- Next Support at $640 - $630
- Next Resistance at $652
- Volume: At Average (50)
- Pattern: Up Day - Narrow Range
- Short-Term Trend: Positive (no change)
- Next Support at $560
- Next Resistance at $583
- Volume: At Average (50)
- Pattern: Up Day - Narrow Range
- Short-Term Trend: Positive (no change)
- Next Support at $225 - $230
- Next Resistance at $237
- Volume: At Average (50)
- Pattern: Up Day - Mini Bull Flag Pattern
Long Term Trend
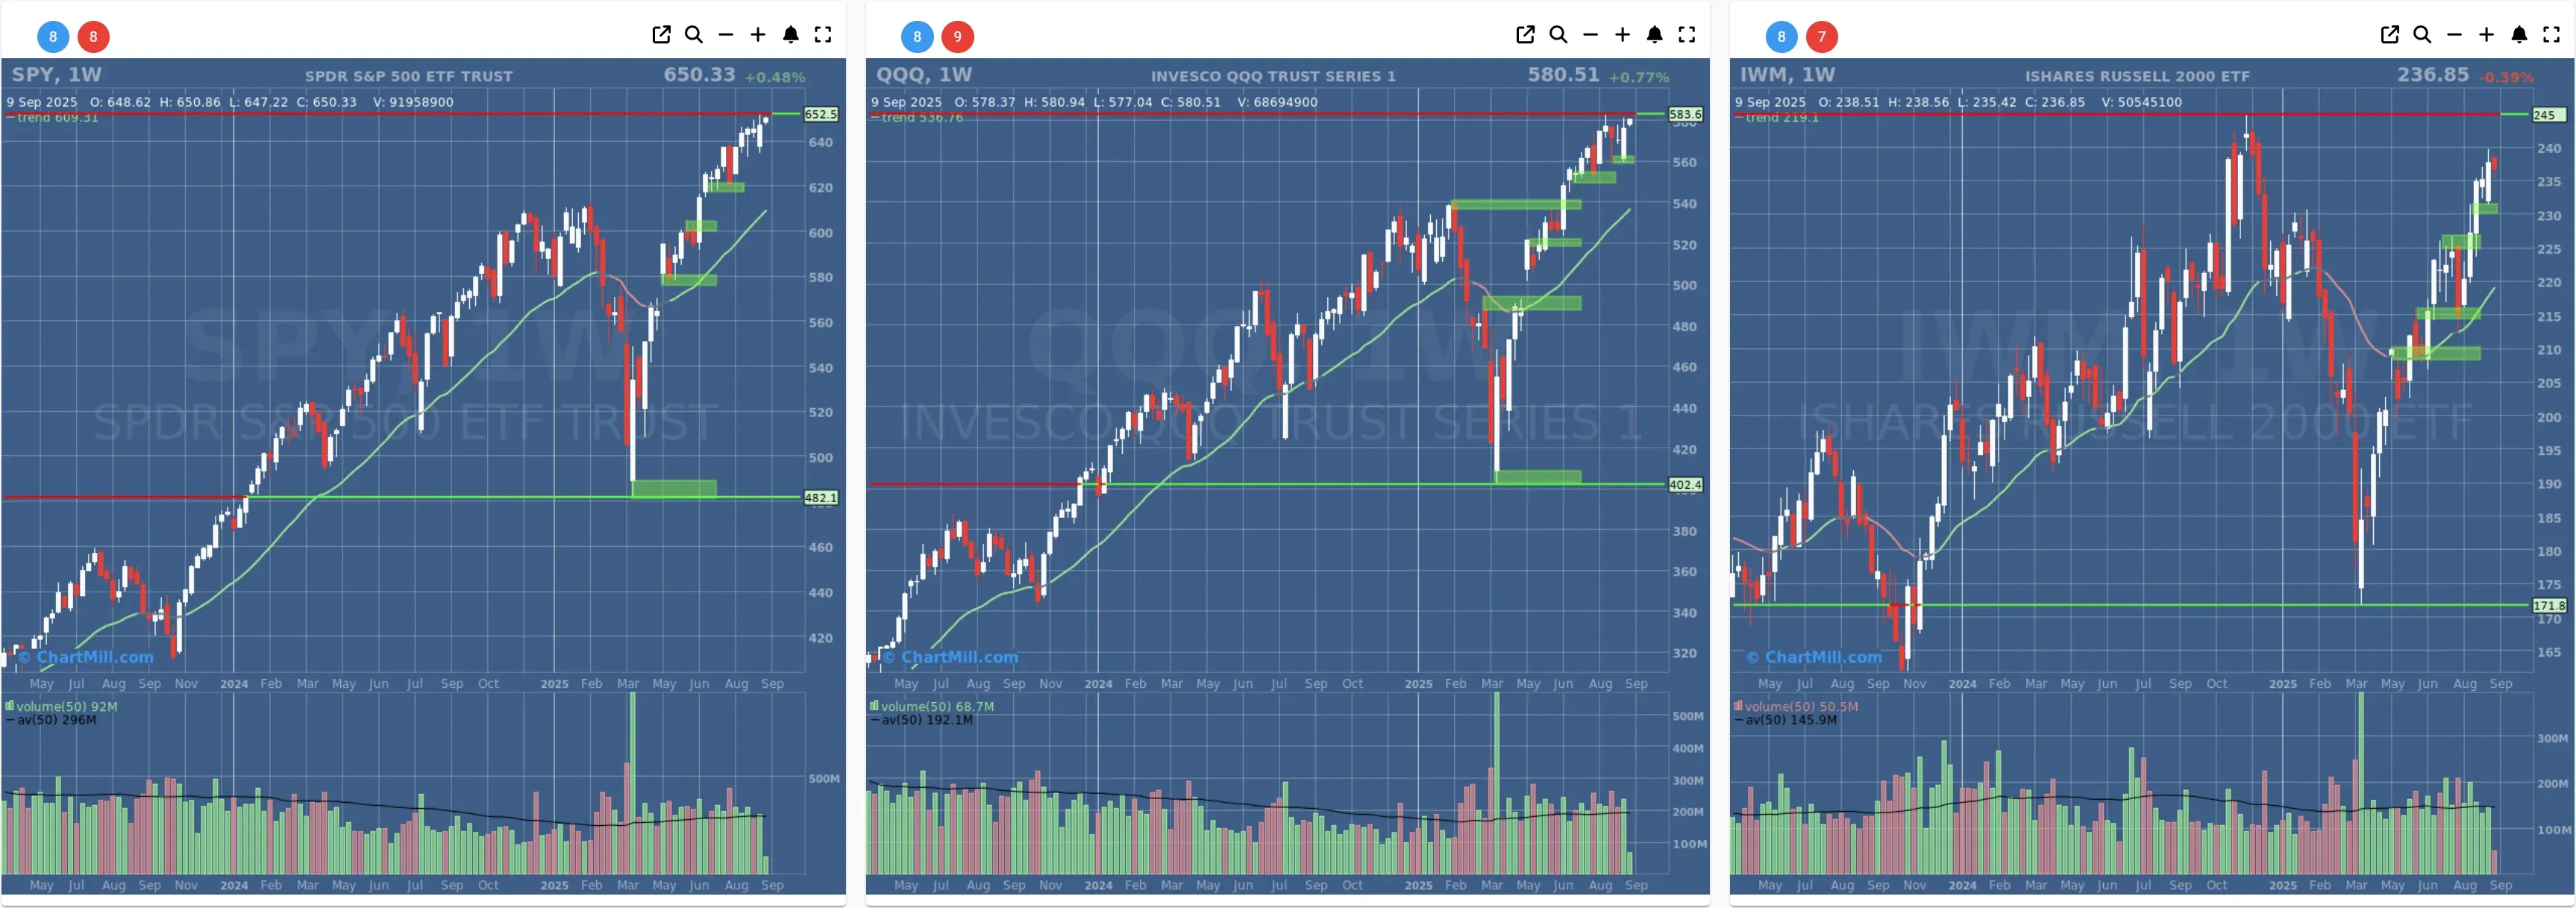
- Long-Term Trend: Positive (no change)
- Long-Term Trend: Positive (no change)
- Long-Term Trend: Positive (from neutral)
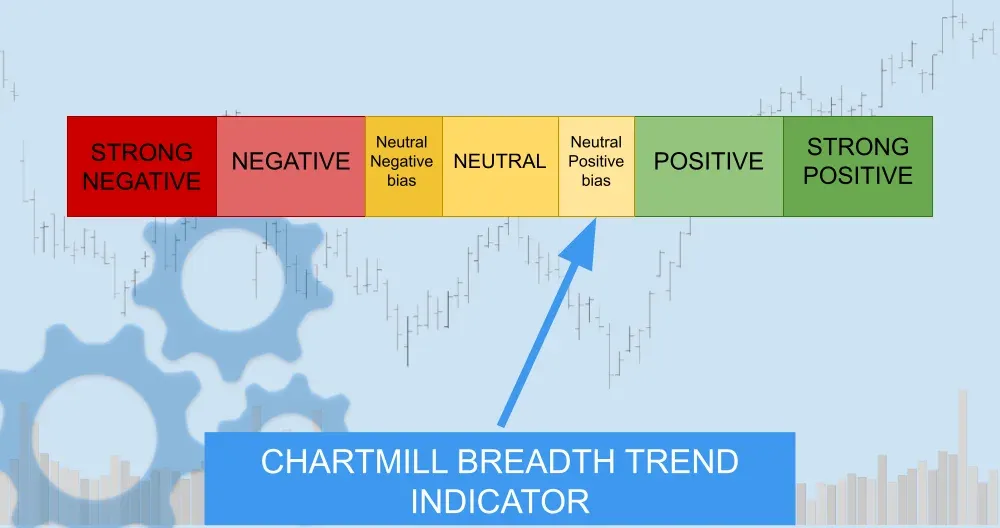
Daily Market Breadth Analysis – September 09, 2025 (After Market Close)
After a volatile start to September, market breadth appears to be stabilizing, although not without signs of underlying indecision. While longer-term indicators are holding up well, short-term breadth suggests hesitation among market participants. The overall trend is neutral with a slightly positive bias.

The most recent market session (Sep 9, 2025) shows a relatively flat distribution between advancing and declining stocks:
-
Advancing stocks: 49.9%
-
Declining stocks: 48.2%
-
Advancing >4%: 7.1% (a notable spike from 1.8% the day before)
-
Declining >4%: 3.5%
This uptick in strong advancers, coupled with a higher overall advance/decline ratio than on Sep 8, indicates improving short-term bullish momentum. That said, the percentage of stocks above key moving averages remains relatively unchanged, reflecting market indecision:
-
Above SMA(20): 66%
-
Above SMA(50): 68.9%
-
Above SMA(100): 73%
-
Above SMA(200): 62.3%
These levels have been consistent over the past few sessions and continue to support the case for longer-term breadth stability, even as short-term breadth fluctuates.
Key Shifts Compared to Previous Day (Sep 8, 2025):
-
Advancing >4% surged from 1.8% → 7.1%, suggesting improved risk appetite.
-
Declining >4% also rose modestly (from 0.9% → 3.5%), highlighting continued fragmentation.
-
New Highs (NH): rose slightly to 6.7% (from 6.3%) – still far from breakout territory.
-
New Lows (NL): stable at 1.0–1.1%, showing no significant breakdown pressure.
Despite the modest improvements, the weekly advance/decline spread remains mixed:
-
Adv Week: 65.1%
-
Decl Week: 33.9%
This gives bulls a slight edge, in contrast to earlier in the week when weekly breadth leaned more neutral.
Longer-Term Breadth Signals Holding Firm
The monthly and 3-month advance-decline metrics remain healthy:
-
Adv 3 Month: 73.4%
-
Decl 3 Month: 25.7%
-
Adv 25% 3 Month: 16.8% (unchanged from Sep 8)
-
Decl 25% 3 Month: 5.4%
These numbers imply that most stocks are still trading well above their 3-month lows, and a healthy subset are significantly outperforming. This continues to suggest strong participation beneath the surface — a good sign for medium-term market health.
Trend Interpretation and Outlook
Looking back at the sharp breadth breakdown on Sep 2 (Adv Day: 27.3%, NH: 2.8%) and the strong recovery into Sep 4–5, the market now appears to be consolidating and digesting that rebound. The continued strength above key SMAs and stable 3-month breadth data act as tailwinds.
The flat breadth split and subdued leadership (low NHs) indicate that the market is not yet in full breakout mode. Risk appetite is improving, but selectivity remains high.
Breadth Trend Rating: 3.5 / 5 (Neutral with Slight Positive Bias)
While the data doesn’t warrant a full positive label yet, the recent consistency and resilience across multiple breadth indicators - especially in the longer term - lean the trend closer to positive than neutral.
That said, short-term uncertainty is still present, and leadership needs to broaden.
Kristoff - ChartMill
Next to read: Wall Street Cheers Nebius-Microsoft Megadeal While Apple Misses the Mark