

(All data & visualisations by ChartMill.com)
Daily Market Trend Analysis – November 10, 2025 (After Market Close)
All three major index-etf's gapped up
Short Term Trend
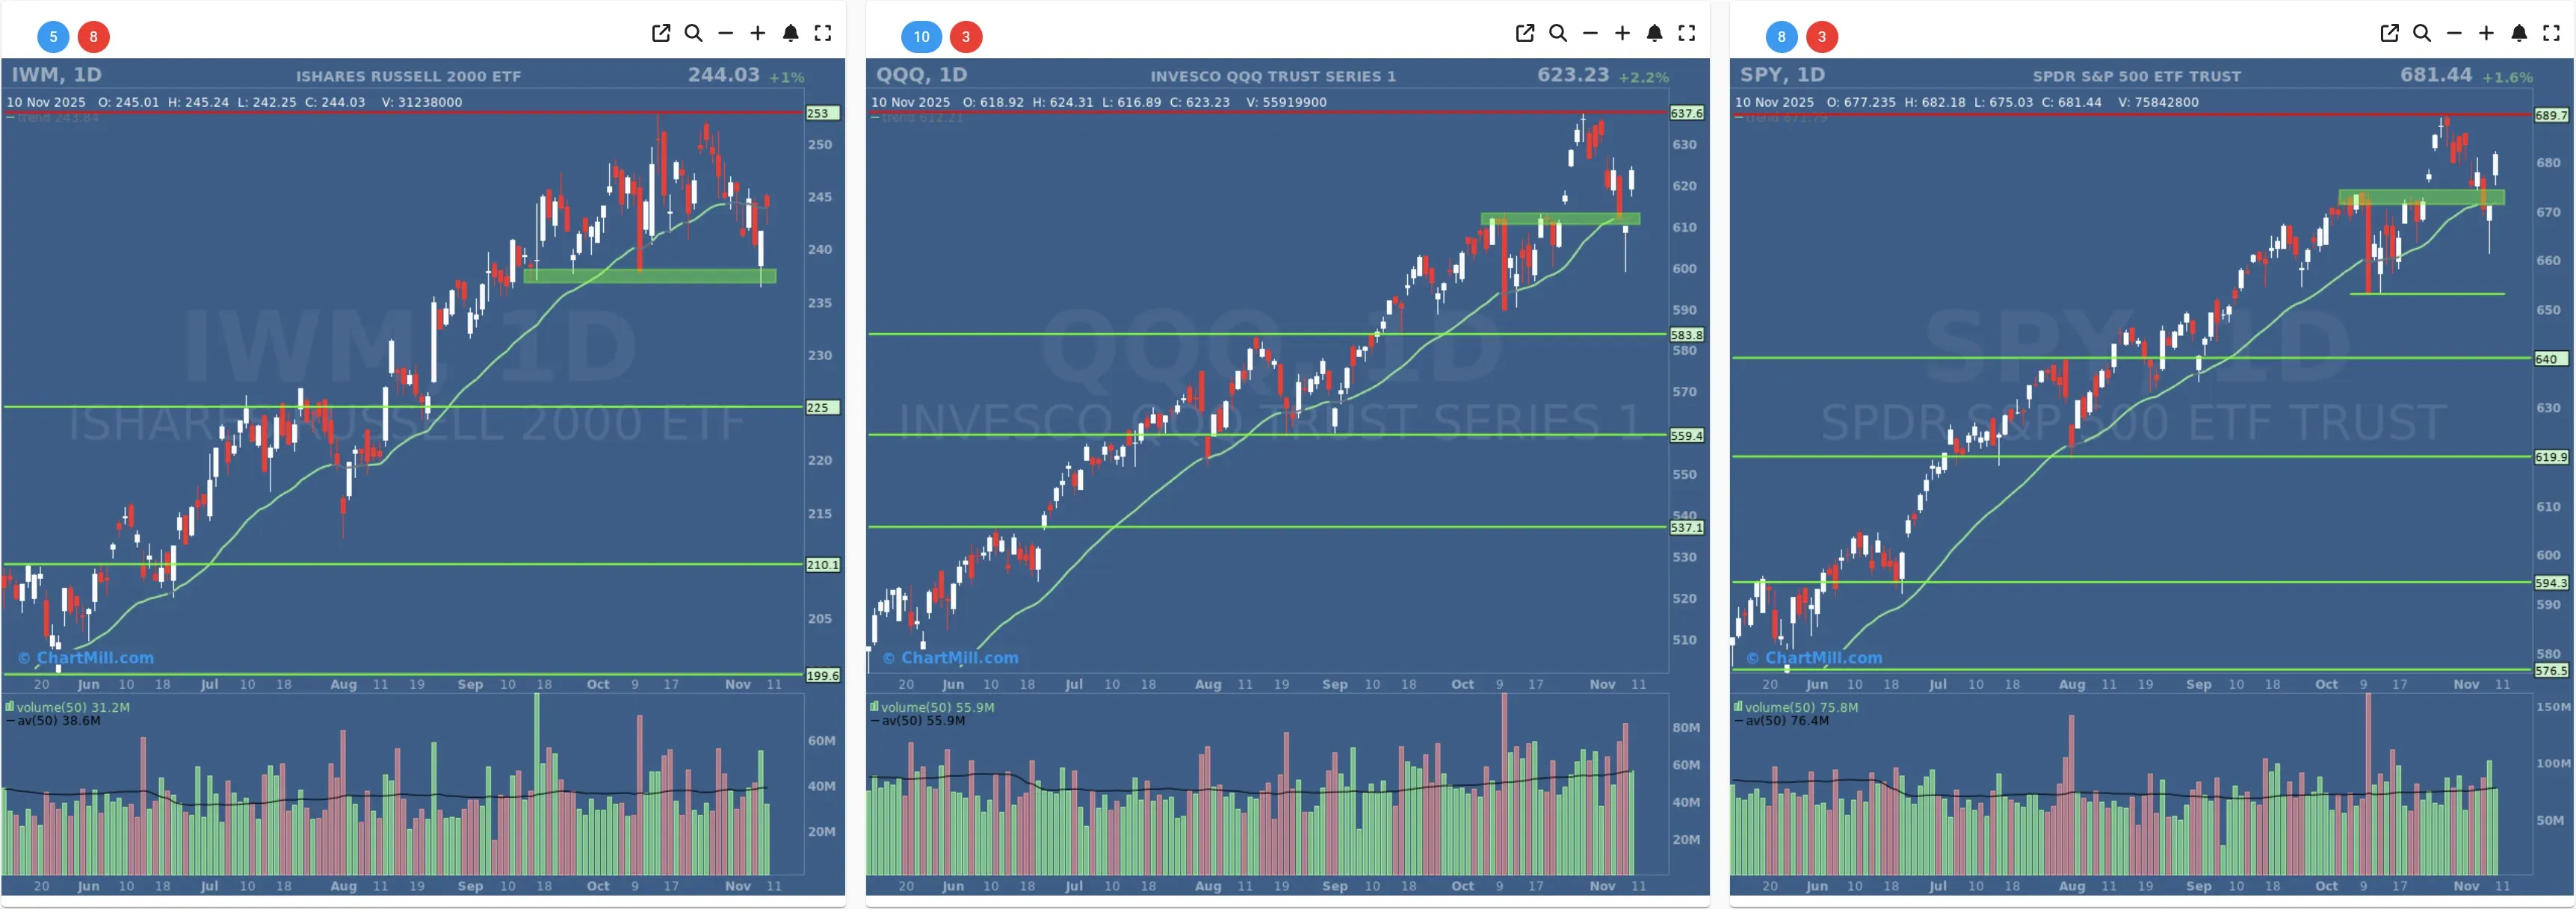
- Short-Term Trend: Neutral (No Change)
- Next Support at $653
- Next Resistance $674
- Volume: At Average (50)
- Pattern: Up Day -Gap Up - Strong Close - Doji Reversal Pattern Confirmed
- Short-Term Trend: Neutral (No Change)
- Next Support at $610
- Next Resistance $637
- Volume: At Average (50)
- Pattern: Up Day -Gap Up - Strong Close - Doji Reversal Pattern Confirmed
- Short-Term Trend: Neutral (No Change)
- Next Support at $237
- Next Resistance at $253
- Volume: Below Average (50)
- Pattern: Down Day - Gap Up - Hanging Man
Long Term Trend

- Long-Term Trend: Positive (no change)
- Long-Term Trend: Positive (no change)
- Long-Term Trend: Positive (no change)
Daily Market Breadth Analysis – November 10, 2025 (After Market Close)
U.S. equities started the week with a clear breadth surge.
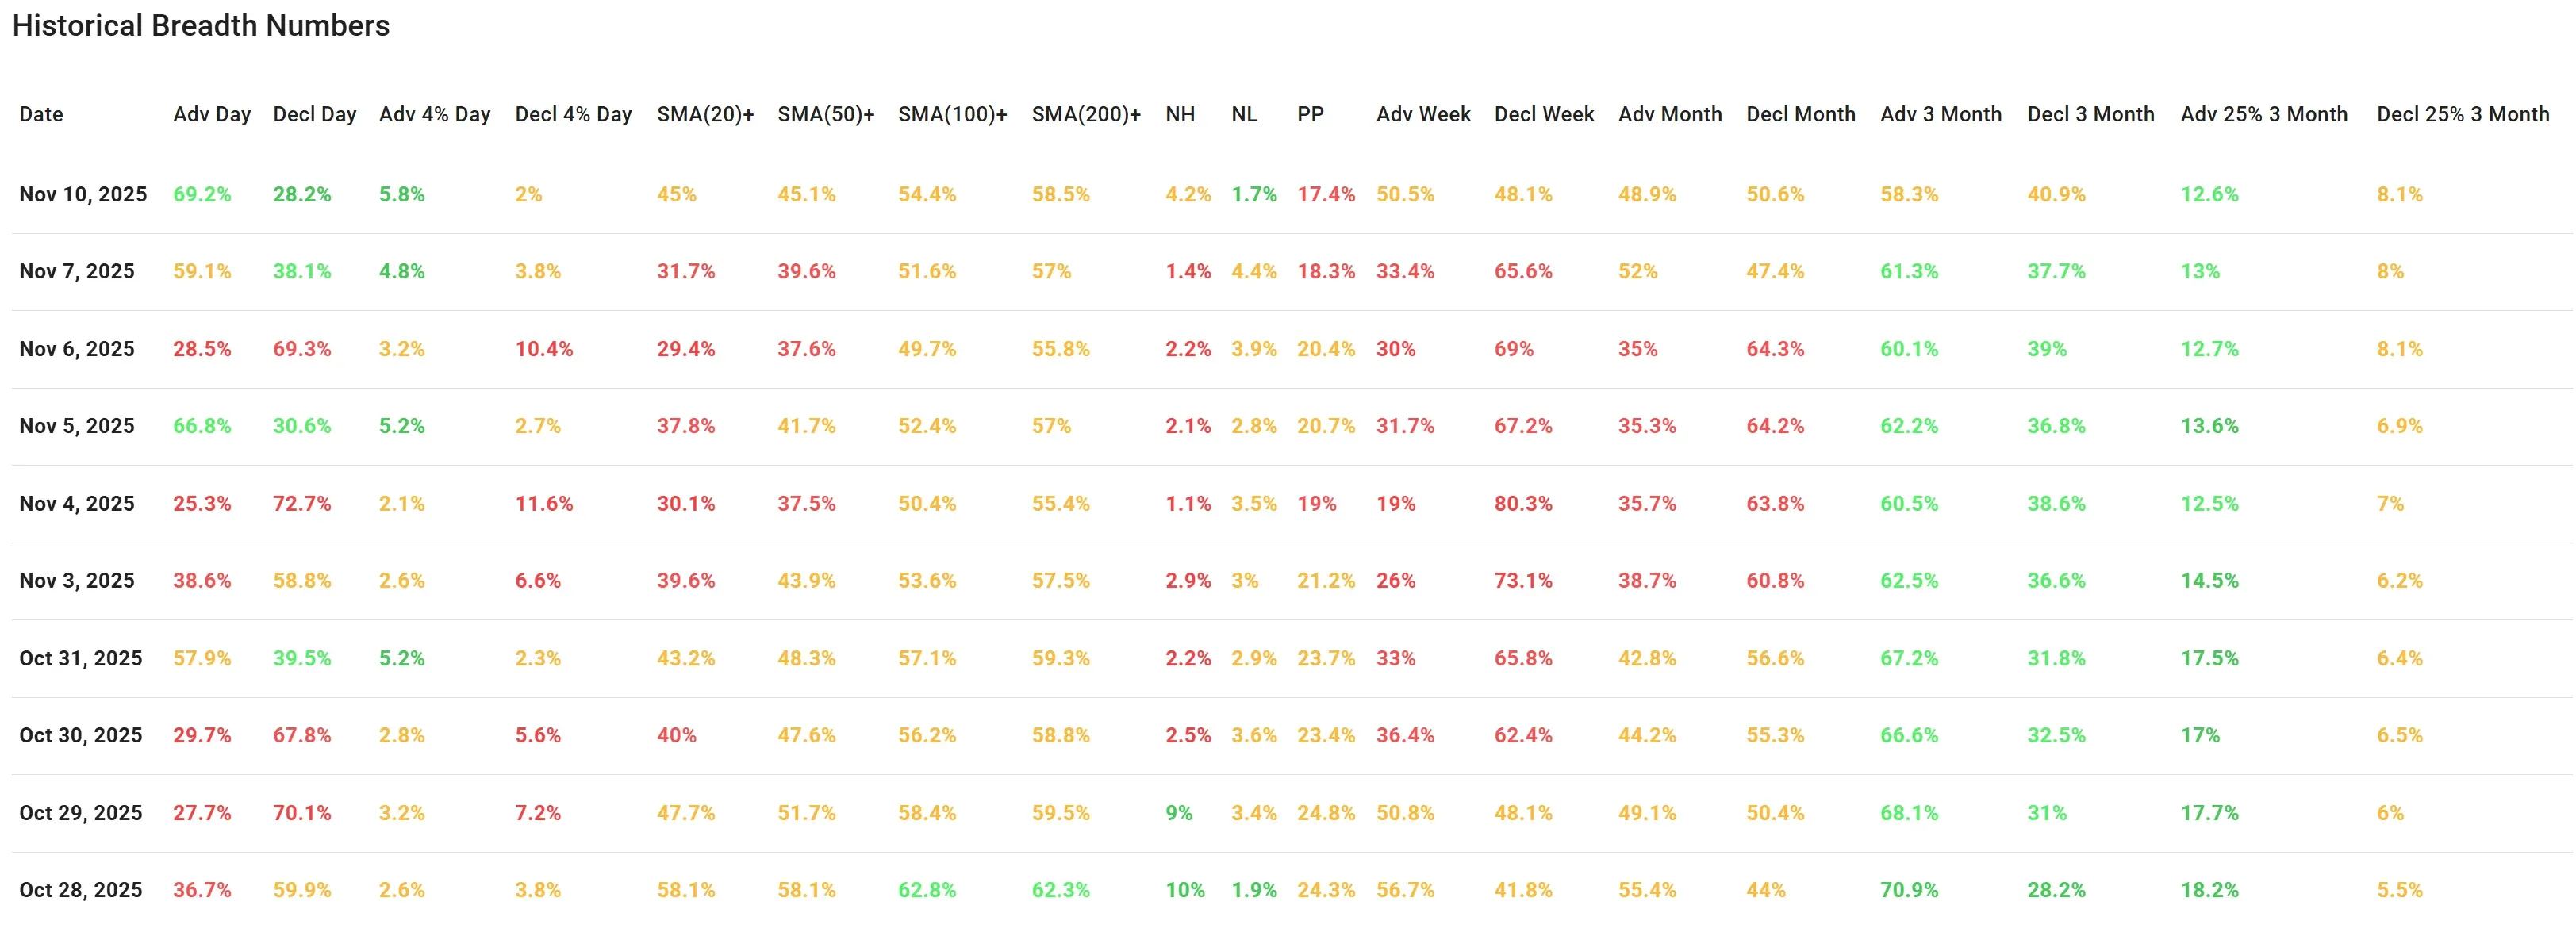
Monday’s session (Nov 10) saw a convincing shift in participation, with improving leadership and technical strength across multiple timeframes. While not yet indicative of a full-blown uptrend, the breadth recovery strengthens the case for bullish continuation if follow-through persists.
Advancers Dominate as Buying Pressure Returns
The first session of the new trading week opened with strong participation:
-
69.2% of stocks advanced, the highest one-day reading in the past 10 sessions.
-
Only 28.2% declined, while 5.8% of stocks rose more than 4%, compared to a modest 2% falling more than 4%.
This signals strong bullish intent and widespread participation, a shift from the fragmented sessions earlier in the month. It's a continuation of the modest strength seen on Nov 7, but Monday’s action marked a clear escalation in breadth quality.
Momentum Builds Across Moving Averages
Participation above key moving averages saw solid gains:
-
SMA(20)+ 31.7% → 45%
-
SMA(50)+ 39.6% → 45.1%
-
SMA(100)+ 51.6% → 54.4%
-
SMA(200)+ 57% → 58.5%
All four categories moved higher, a sign that Monday’s rally wasn't just noise, it pushed more stocks back above critical trend levels, especially the short-term 20-day and 50-day SMAs. This confirms a constructive shift in market structure.
New Highs Rise, Lows Shrink
Leadership metrics also improved:
-
New Highs (NH): Jumped from 1.4% to 4.2%
-
New Lows (NL): Dropped from 4.4% to 1.7%
This shift ends a multi-day stretch where new lows regularly outnumbered new highs. The positive NH–NL spread (+2.5%) is a subtle but important early indicator of leadership rotation in favor of bulls.
Intermediate Trends Still Building, Not Yet Bullish
Looking at broader timeframes:
-
Advancers over 1 Week: 50.5%, vs. 33.4% on Nov 7
-
Advancers over 1 Month: 48.9%, flat compared to 52% Friday
-
Advancers over 3 Months: Slight dip from 61.3% → 58.3%
The week-over-week surge marks an improvement in short-term breadth, though the 3-month and 1-month readings are relatively stable. The percentage of stocks with 25%+ gains over 3 months remains strong at 12.6%, supporting a longer-term bullish bias, particularly for growth and momentum names.
What Changed from Friday?
Compared to Friday (Nov 7), Monday's session delivered a clear follow-through:
-
Higher advancing participation (69.2% vs. 59.1%)
-
Stronger net performance in big movers (+4% stocks)
-
Sharp gains in SMA-based participation
-
Reversal in New Highs vs. New Lows
This kind of follow-up action is critical to building sustained market momentum - and Monday delivered.
Breadth Trend Rating: Positive

Based on Monday's breadth metrics, improving trend participation, and early signs of returning leadership, the market breadth trend now shifts to a “Positive”. Bulls are taking back control, but confirmation through continuation is key for sustaining the move into more optimistic territory.
Kristoff - ChartMill
Next to read: Shutdown Deal Breathes New Life Into Wall Street