

(All data & visualisations by ChartMill.com)
Daily Market Trend Analysis – November 7, 2025 (After Market Close)
Doji Candles for QQQ and SPY
Short Term Trend
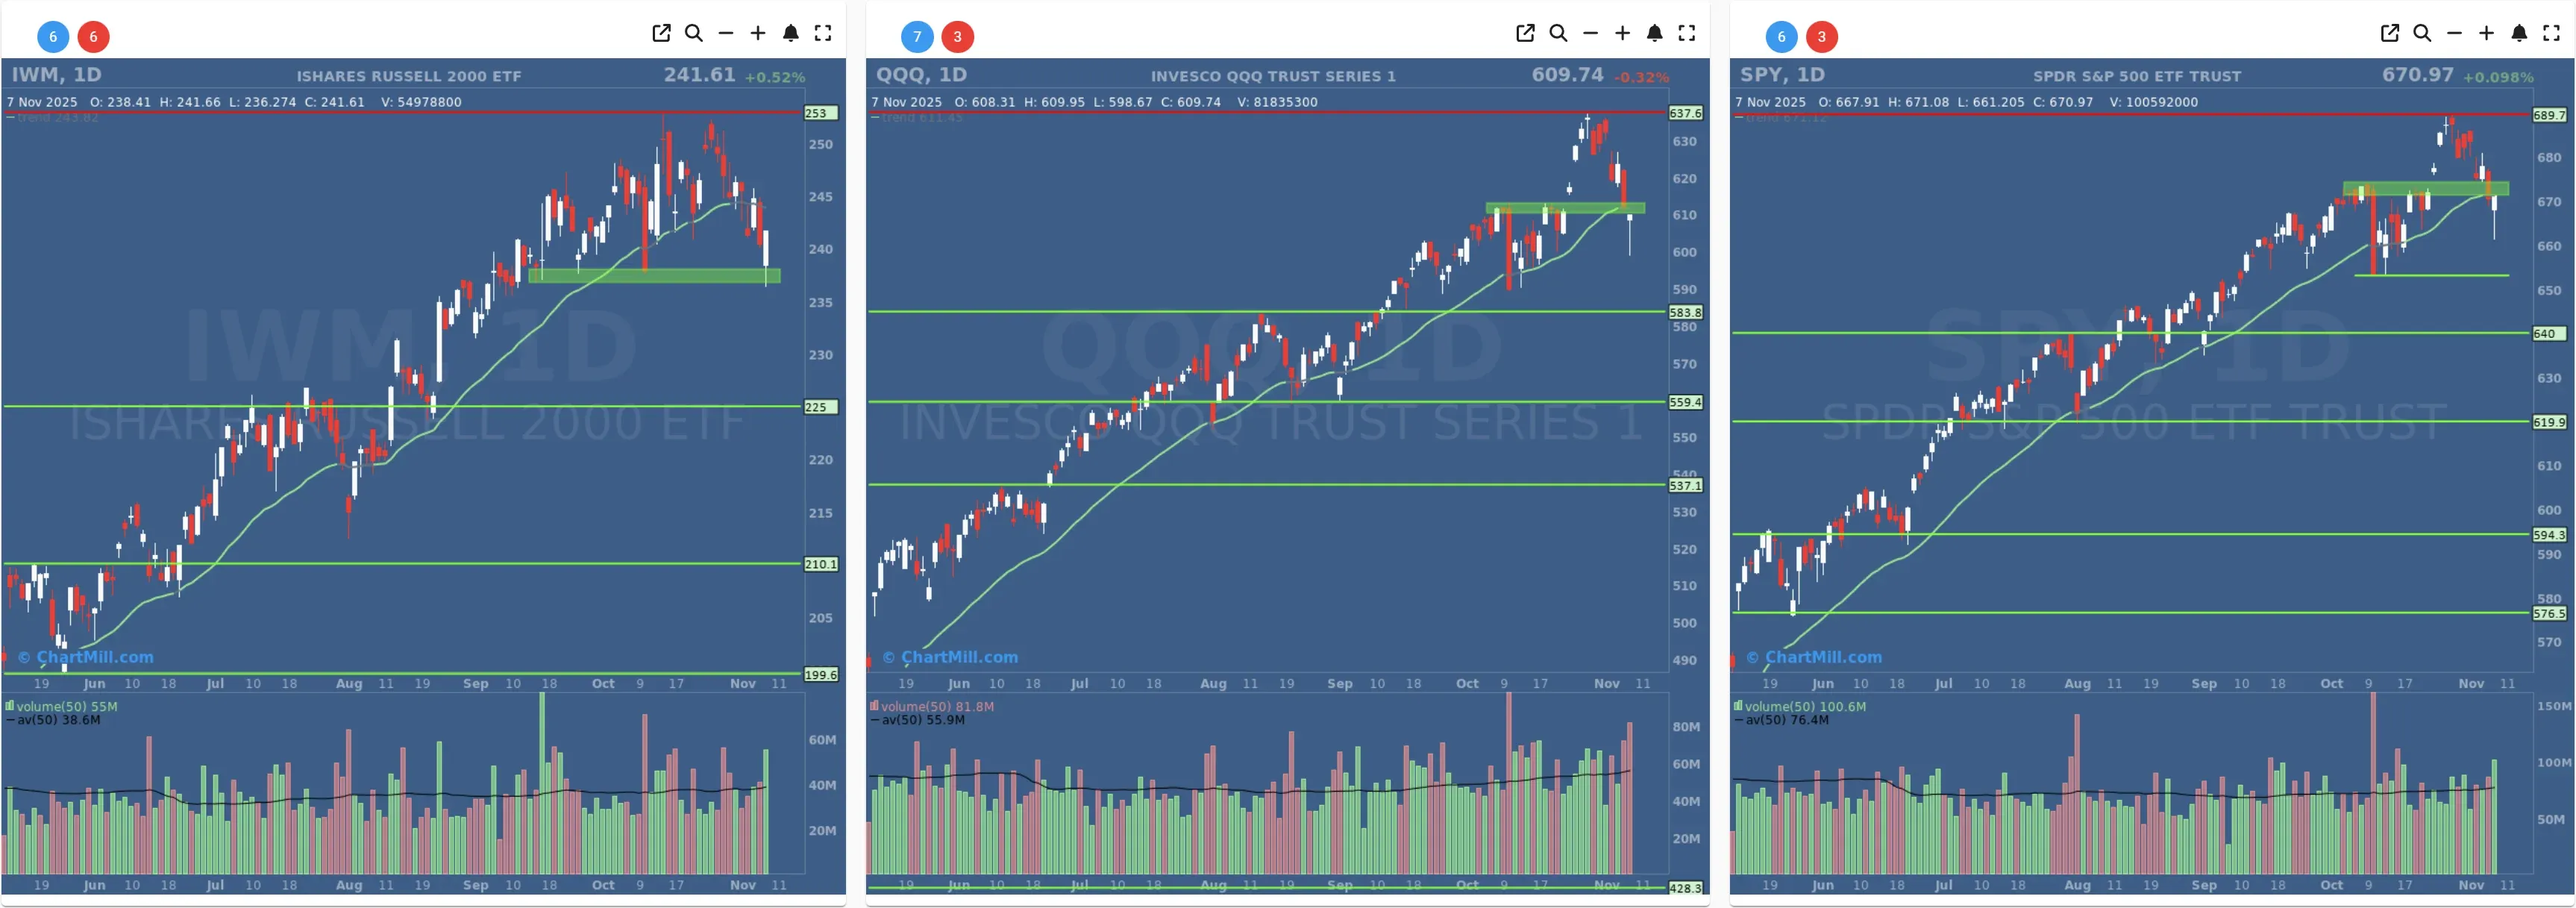
- Short-Term Trend: Neutral (No Change)
- Next Support at $653
- Next Resistance $674
- Volume: Well Above Average (50)
- Pattern: Up Day - Doji candle - Strong Close
- Short-Term Trend: Neutral (No Change)
- Next Support at $610
- Next Resistance $637
- Volume: Well Above Average (50)
- Pattern: Up Day - Doji candle - Strong Close
- Short-Term Trend: Neutral (No Change)
- Next Support at $237
- Next Resistance at $253
- Volume: At Average (50)
- Pattern: Up Day - Doji candle - Strong Close
Long Term Trend
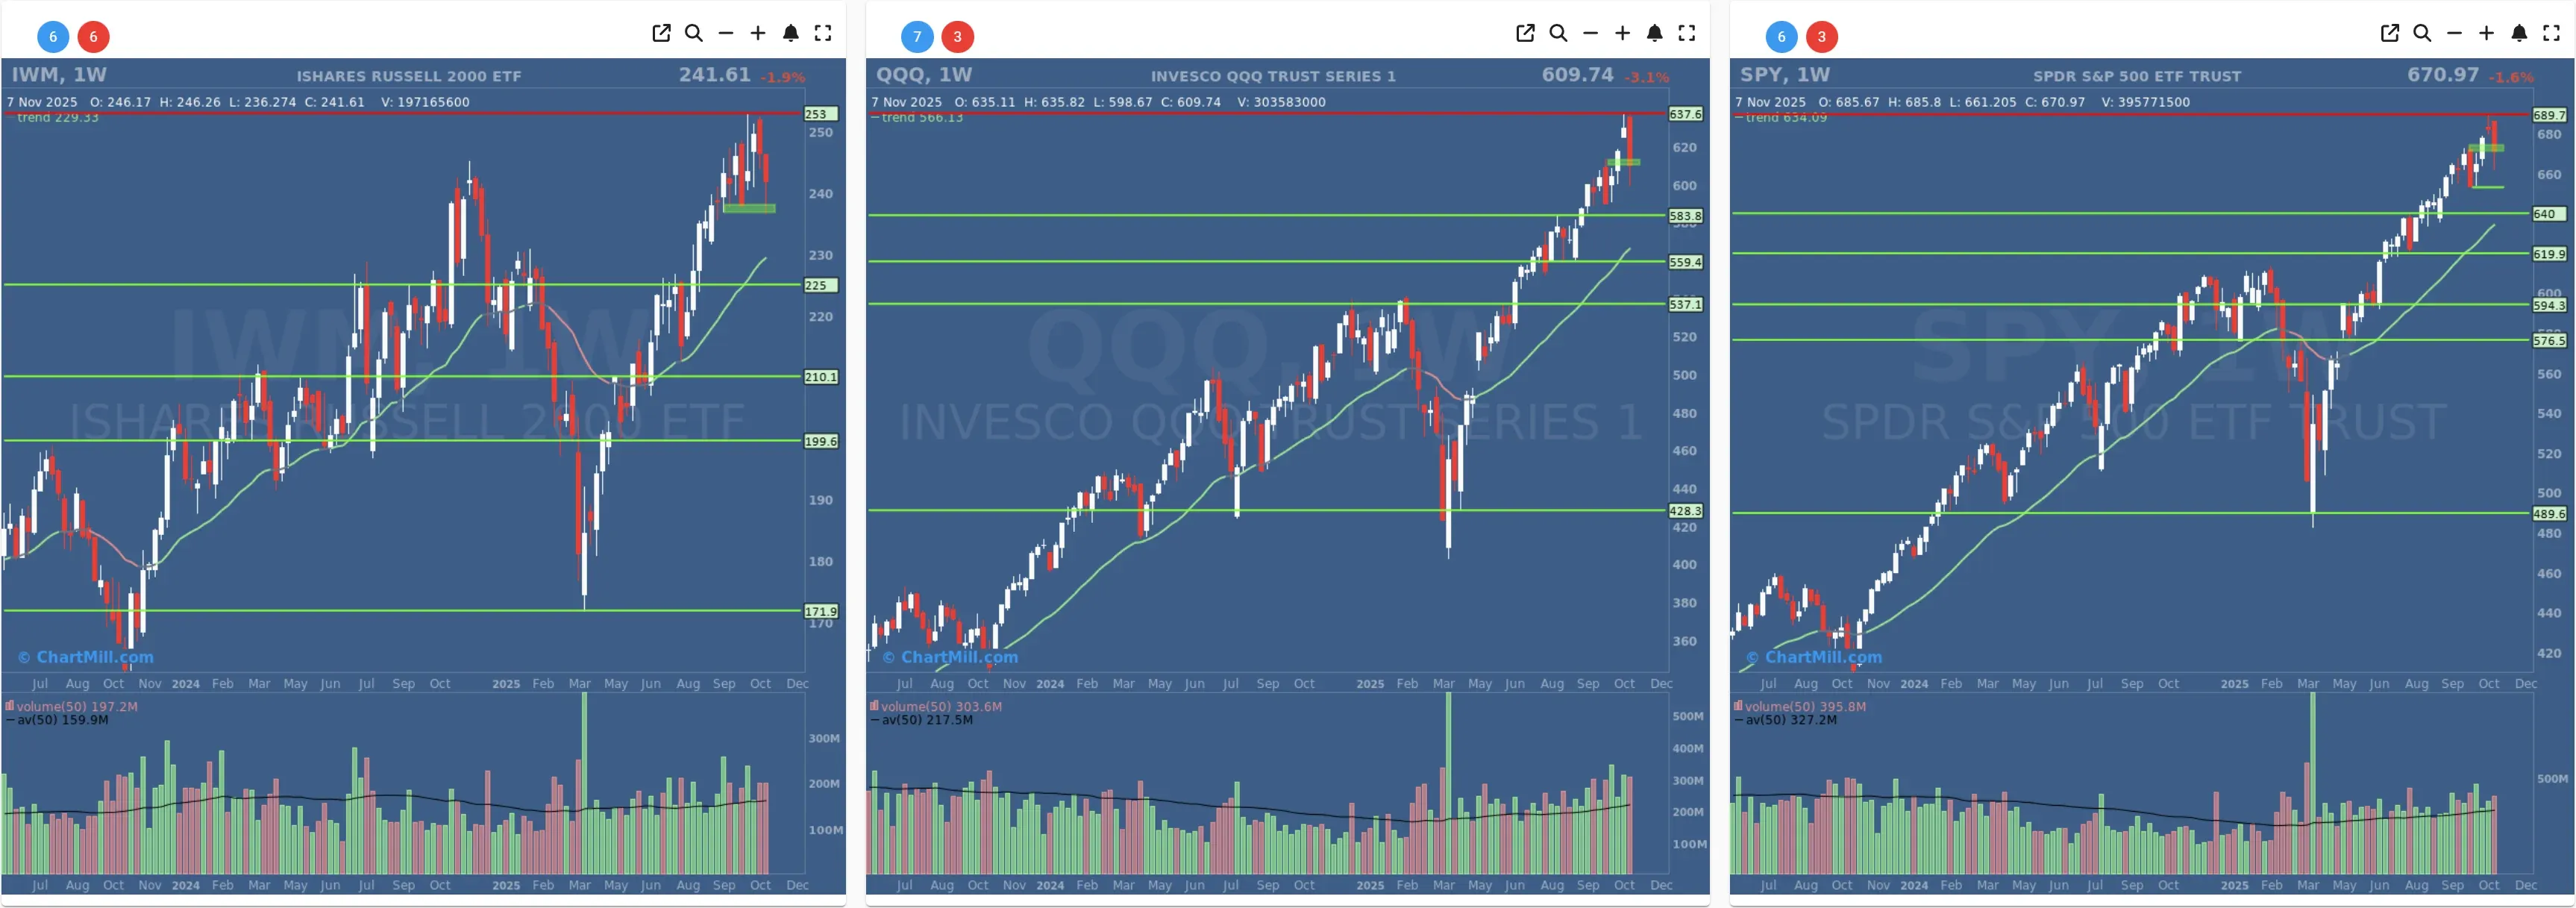
- Long-Term Trend: Positive (no change)
- Long-Term Trend: Positive (no change)
- Long-Term Trend: Positive (no change)
Daily Market Breadth Analysis – November 7, 2025 (After Market Close)
After Thursday's pronounced weakness, Friday saw a partial recovery in breadth metrics, but overall participation remains fragile and inconsistent.

Advancing vs Declining Stocks:
-
Advancers recovered to 59.1%, up sharply from Thursday’s low of 28.5%.
-
Decliners fell to 38.1% (from 69.3%).
While this shift is notable, the bounce resembles the one seen on October 31, a one-day relief rather than the start of a sustainable trend.
High Momentum Movers:
-
Only 4.8% of stocks advanced more than 4%, slightly higher than Thursday’s 3.2%.
-
Conversely, 3.8% of stocks declined more than 4%, down significantly from 10.4% the previous day.
This indicates a modest easing in selling pressure, but strong upside thrusts remain scarce.
Moving Average Participation Weakens:
-
% of stocks above 20SMA: 31.7% (up modestly from 29.4%)
-
% above 50SMA: 39.6% (vs 37.6%)
-
% above 100SMA: 51.6% (vs 49.7%)
-
% above 200SMA: 57% (vs 55.8%)
These marginal upticks are welcome but underwhelming. All metrics remain below recent highs from late October, signaling that many stocks continue to trade below key trend levels.
New Highs vs New Lows:
- New Highs dropped to 1.4%, a new low for this data set, while New Lows rose to 4.4%.
This deterioration is subtle but notable, especially compared to earlier in the week.
Percentage Pocket Pivots (PP):
Friday’s PP dropped to 18.3% (from 20.4%), suggesting fewer stocks are making strong price moves up, which may reflect indecision or fading momentum.
Short- and Medium-Term Trends:
Weekly advancers remained soft at 33.4%, with decliners still dominant at 65.6%.
Monthly numbers showed a slight tilt in favor of advancers (52%) over decliners (47.4%), a positive divergence from Thursday, but not a strong confirmation of trend reversal.
The 3-month view remains moderately positive (61.3% advancing), although this figure has been declining since October 27 (72.2%).
Leadership Metrics:
The percentage of stocks that are up more than 25% in the past 3 months is 13%, slightly above Thursday (12.7%) but still far from the October highs near 18%.
Conversely, 8% of stocks are down more than 25% over that same period — a slight uptick, suggesting more persistent underperformance.
Contextual Takeaway:
Friday’s numbers suggest a stabilization in breadth following Thursday's sharp deterioration, but not a convincing bounce. Much like the post-October 31 action, the data reflects an indecisive market where bullish surges struggle to gain traction.
This hesitation could be partly attributed to investors digesting a volatile week, marked by rising bond yields and fading rate-cut expectations, even if such macro factors weren’t dramatically different heading into Friday.
The leadership remains weak, the percentage of stocks holding key SMAs continues to erode, and the rally from late October is clearly losing steam.
Breadth Trend Rating: Neutral with Negative Bias
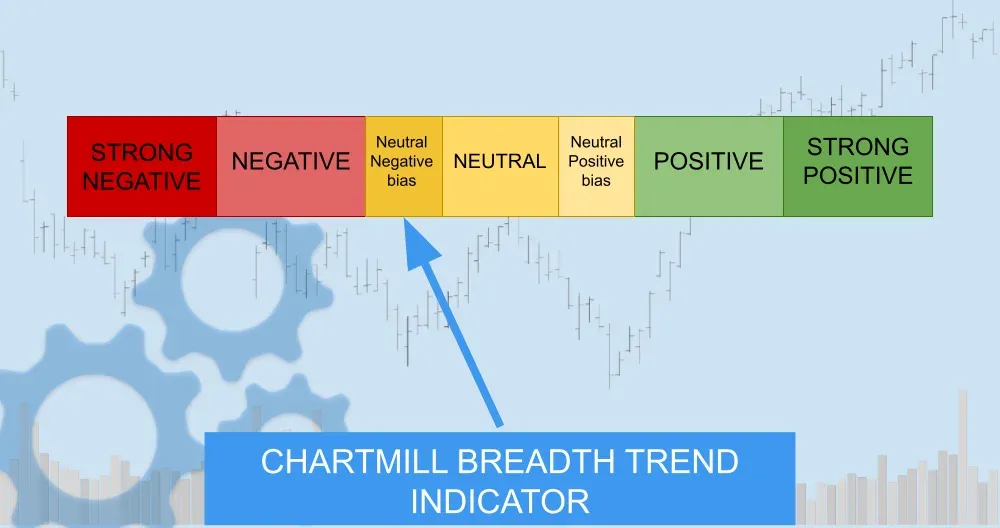
While there was some recovery in breadth metrics on Friday, the move lacked strength, and the longer-term indicators continue to drift lower. This keeps the overall tone cautious, with downside risks still elevated.
Kristoff - ChartMill
Next to read: Shutdown Pressure and Tech Turbulence: Wall Street Ends the Week on Its Back Foot