
(All data & visualisations by ChartMill.com)
Daily Market Trend Analysis – November 6, 2025 (After Market Close)
Trend Change to Neutral (from positive) for SPY & QQQ
Short Term Trend
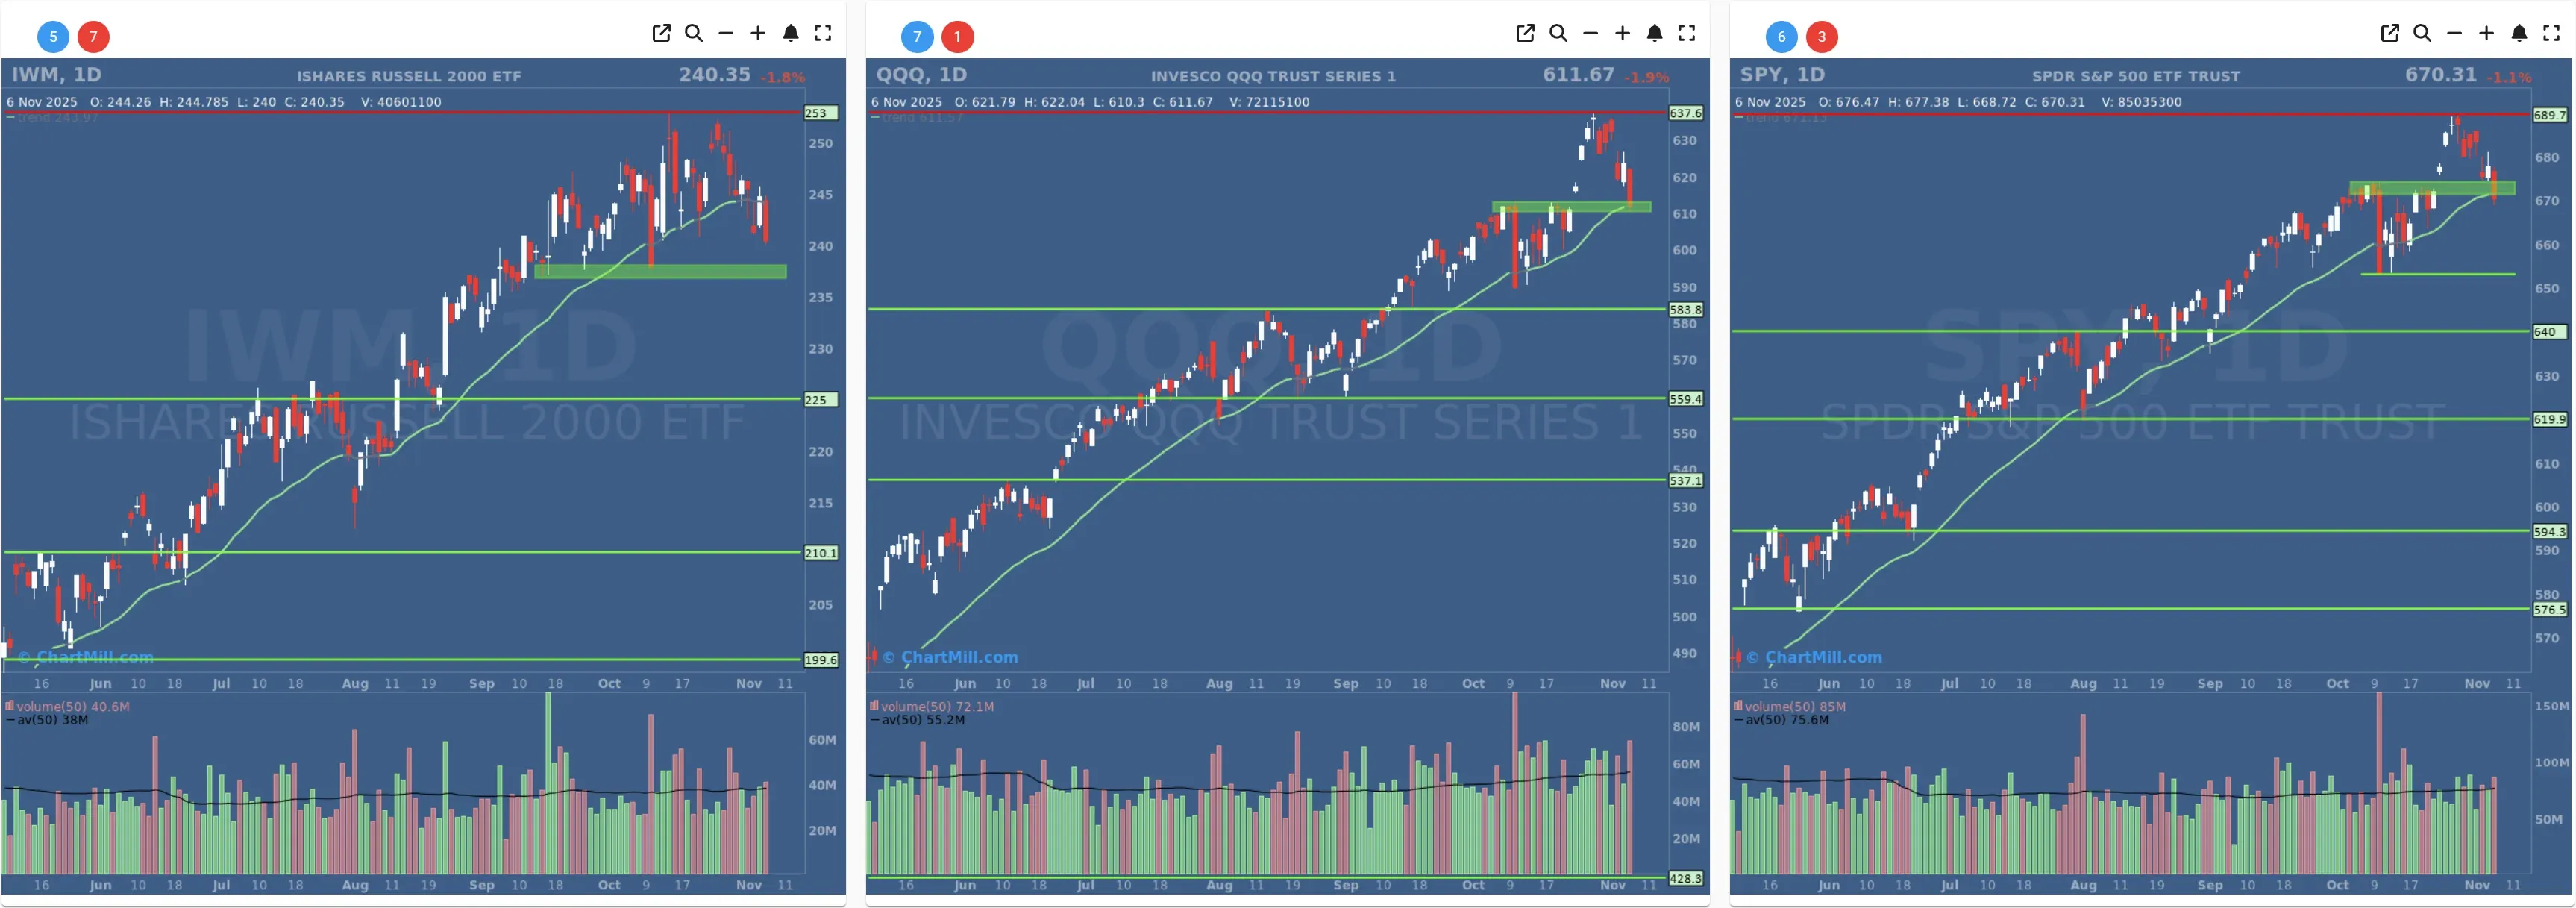
- Short-Term Trend: !!TREND CHANGE - NEUTRAL!! (From Positive)
- Next Support at $653
- Next Resistance $674
- Volume: Slightly Above Average (50)
- Pattern: Down Day - Weak Close Below Support
- Short-Term Trend: !!TREND CHANGE - NEUTRAL!! (From Positive)
- Next Support at $610
- Next Resistance $637
- Volume: Well Above Average (50)
- Pattern: Down Day - Week Close At Support
- Short-Term Trend: Neutral (No Change)
- Next Support at $237
- Next Resistance at $253
- Volume: At Average (50)
- Pattern: Down Day - Weak Close
Long Term Trend
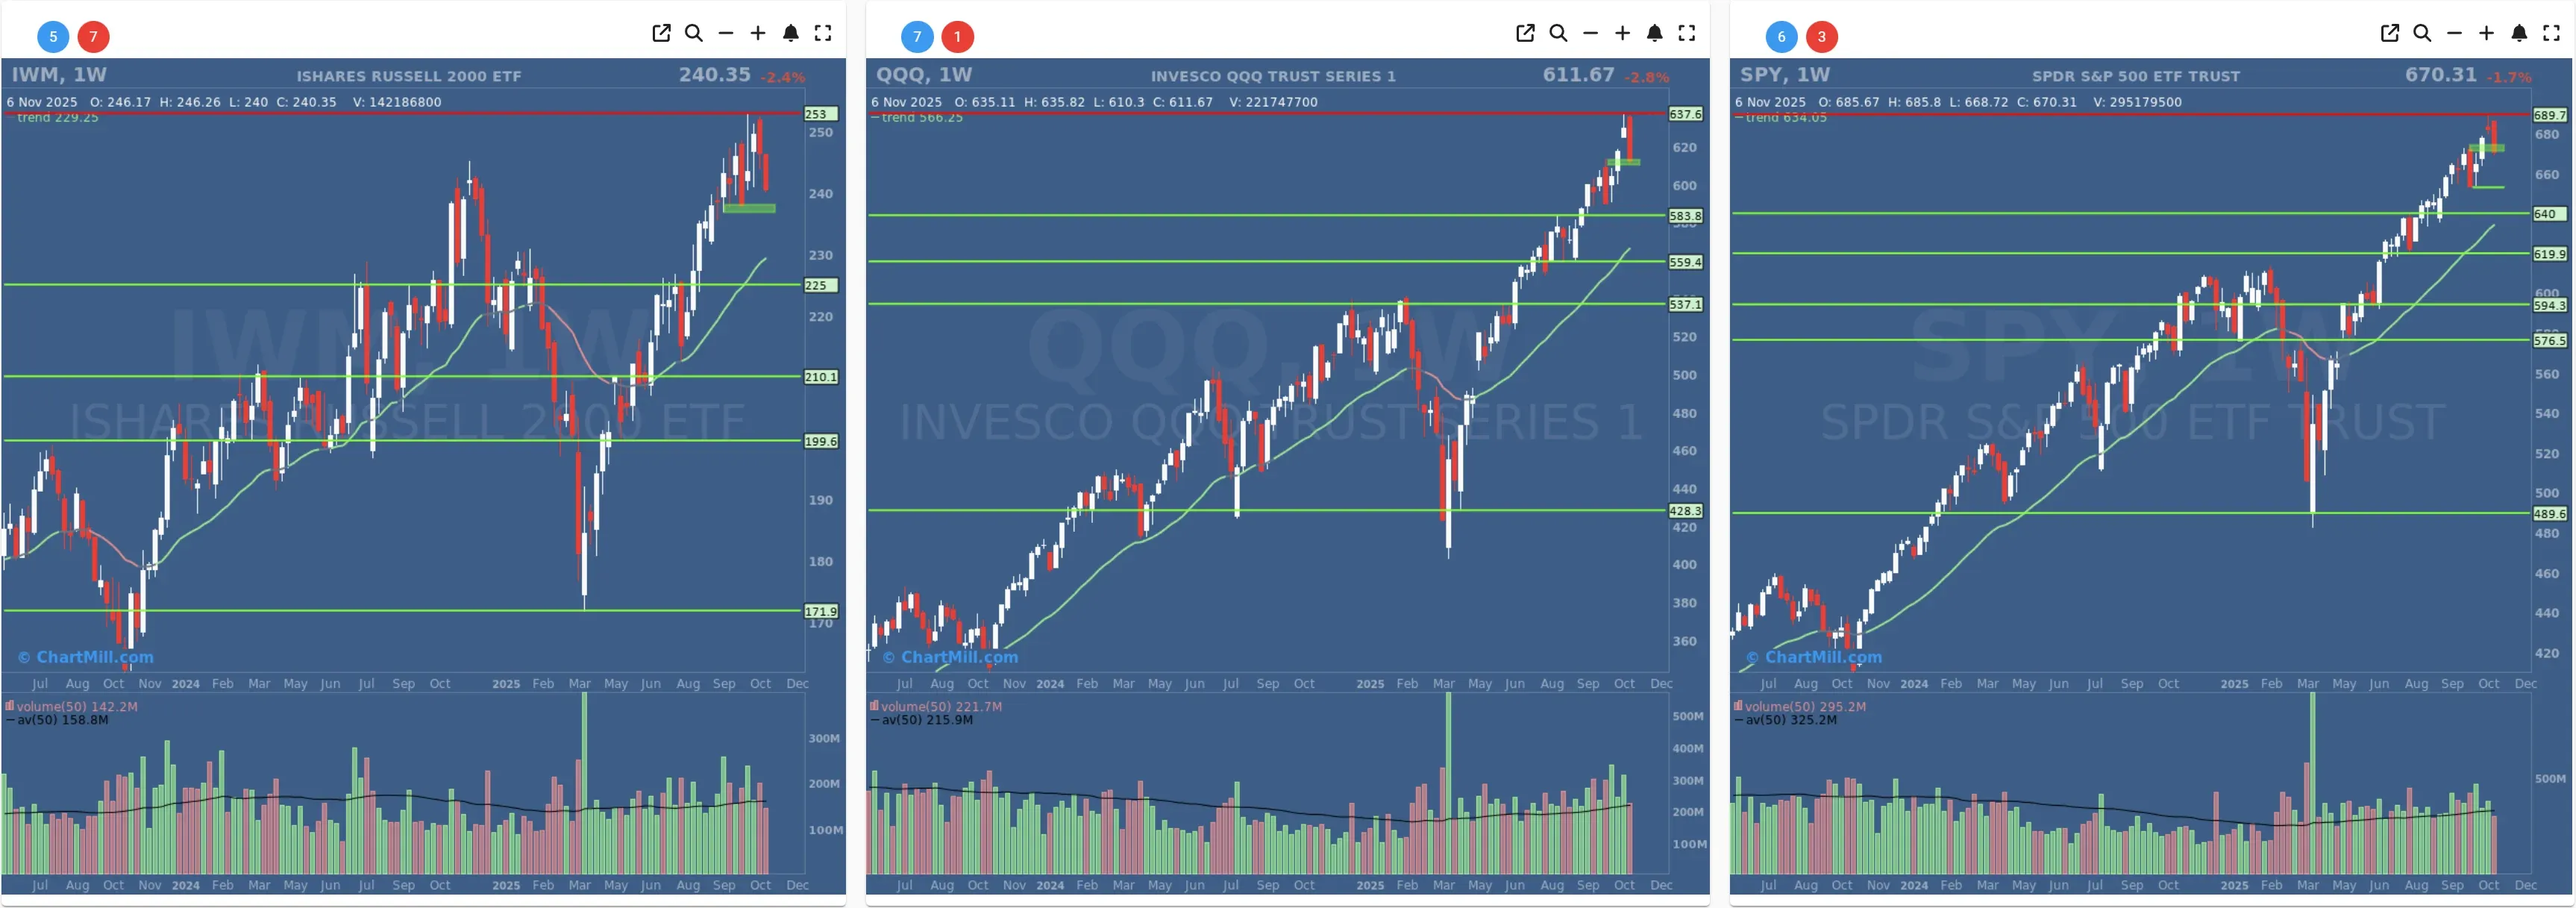
- Long-Term Trend: Positive (no change)
- Long-Term Trend: Positive (no change)
- Long-Term Trend: Positive (no change)
Daily Market Breadth Analysis – November 6, 2025 (After Market Close)
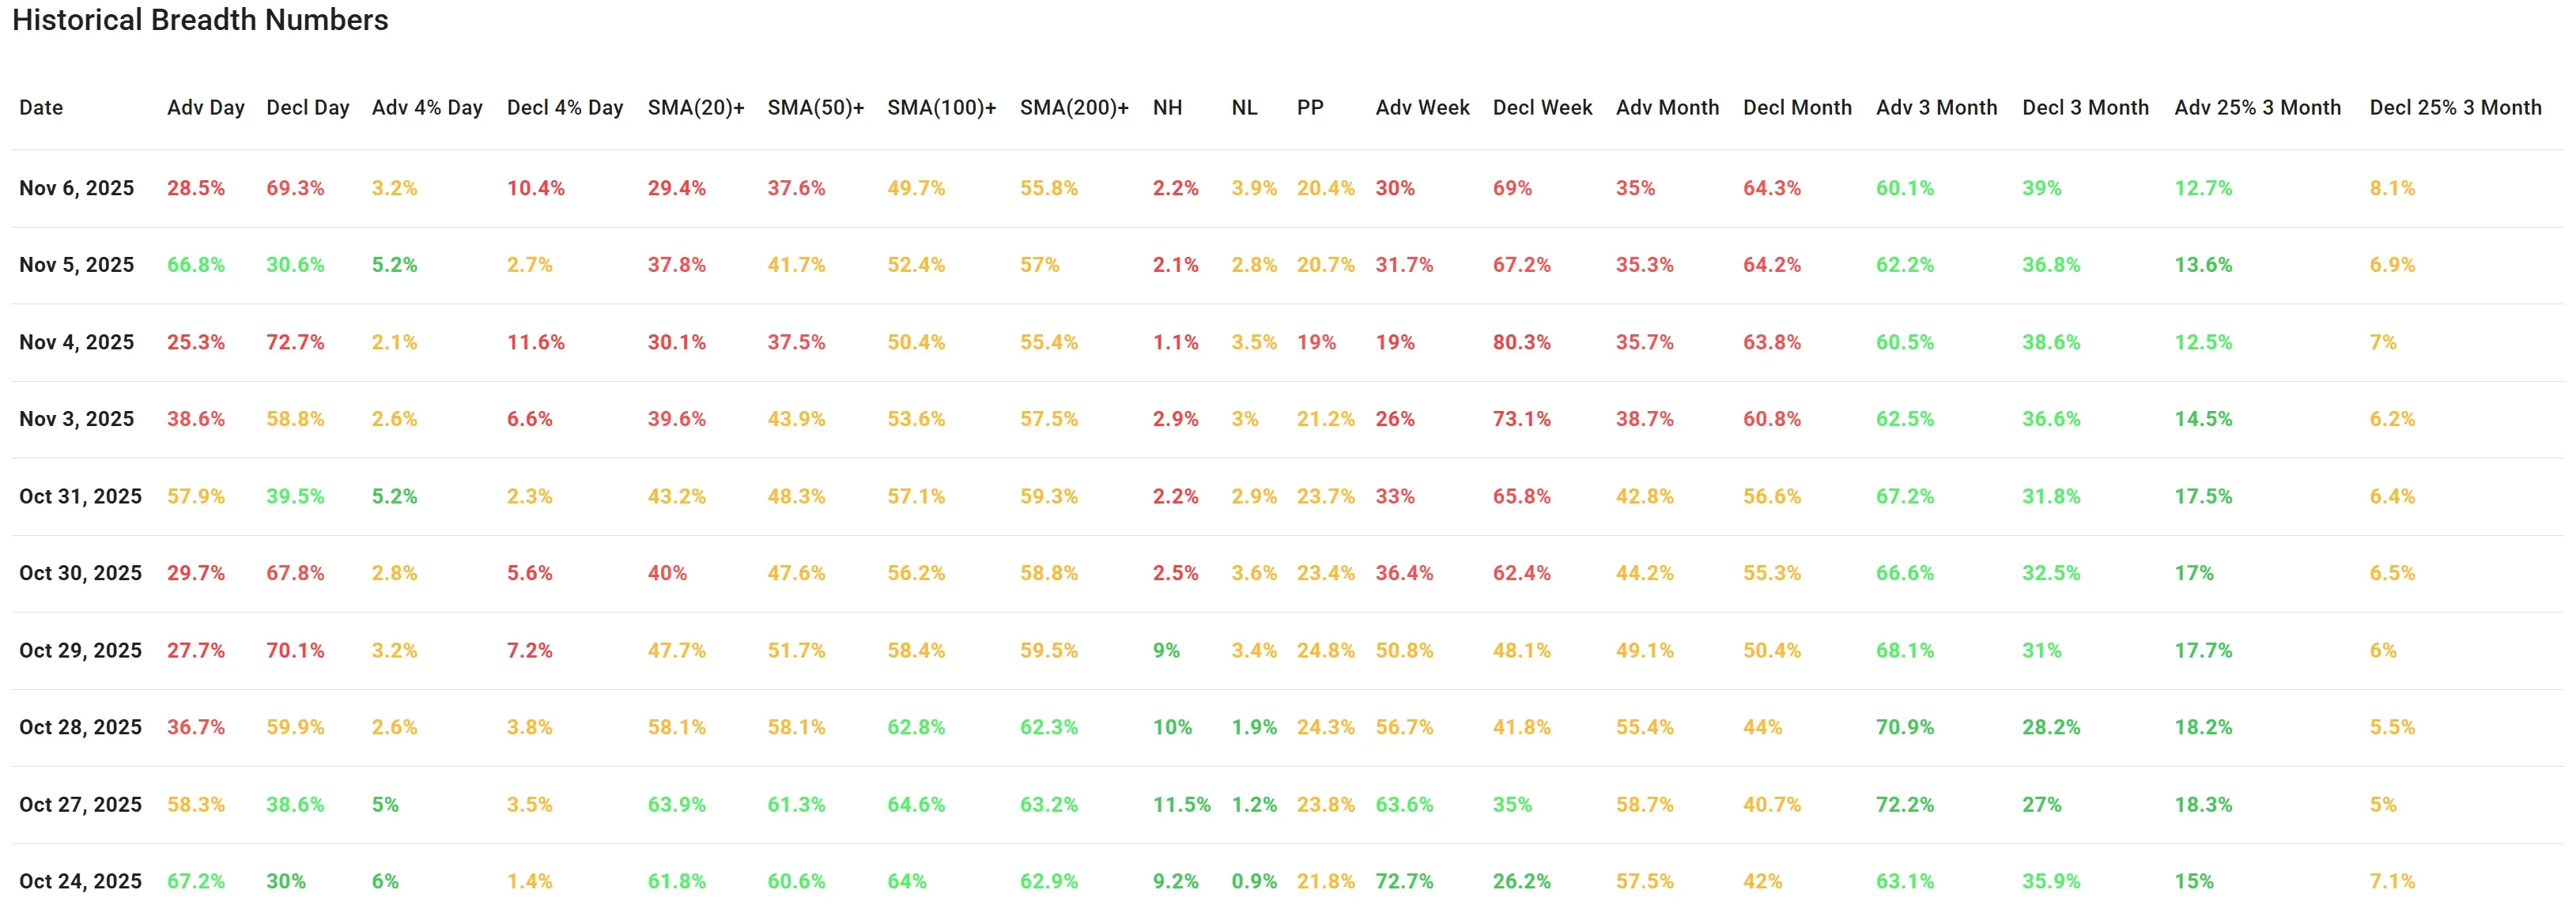
After Wednesday’s breadth rebound, Thursday’s action (November 6, 2025) saw breadth collapse again. Only 28.5% of stocks advanced while 69.3% declined, essentially mirroring the weakness seen on Monday and Tuesday.
Key Observations:
1. Another Failed Follow-Through
The breadth rally on November 5 now clearly stands as an isolated event. Rather than building on that strength, the market regressed sharply:
-
The percentage of stocks up more than 4% fell to just 3.2% (from 5.2%).
-
Those down more than 4% jumped to 10.4% (from 2.7%).
This signals broad-based selling pressure and minimal upside momentum.
2. Fewer Stocks Holding Above Key Averages
There was significant deterioration in the number of stocks trading above key moving averages:
-
SMA(20)+ fell from 37.8% to 29.4%
-
SMA(50)+ dipped from 41.7% to 37.6%
-
SMA(100)+ and SMA(200)+ also declined modestly, now at 49.7% and 55.8% respectively.
These metrics suggest more stocks are breaking below short- and medium-term support zones — a negative sign for overall trend strength.
3. New Highs Remain Anemic
New highs (NH) remained extremely low at 2.2%, while new lows (NL) ticked up slightly to 3.9%. The lack of leadership from strong stocks remains a major concern.
4. Weakness Across All Timeframes
Breadth was weak not only on the day, but also over weekly and monthly horizons:
-
Weekly advancers: 30% vs 69% decliners
-
Monthly advancers: 35% vs 64.3% decliners
Despite some signs of stabilization in longer-term breadth (e.g. 3-month advance-decline ratios), short-term selling pressure dominates.
5. Participation and Momentum Declining
-
The percentage of stocks up more than 25% in 3 months dropped slightly to 12.7%
-
Those down more than 25% ticked up to 8.1%
This suggests the market is losing high-momentum outperformers while laggards remain persistent.
Conclusion & Breadth Trend Rating
The market breadth picture has turned sharply negative again, and with it, so has the overall tone.
The rapid reversal following a one-day rally underlines the fragile state of market internals. Wednesday’s surge now looks like a classic bear market bounce, fast, strong, but unsustainable.
There is currently no sign of a healthy accumulation phase. Most indicators have reverted to their prior weakening trend, and downside momentum appears to be regaining strength.
Breadth Trend Rating: Negative

Kristoff - ChartMill
Next to read: Wall Street Slips as Job Cuts and Shutdown Fears Shake Confidence