

(All data & visualisations by ChartMill.com)
Daily Market Trend Analysis – August 19, 2025 (After Market Close)
All major US Index-ET's slipped
Short Term Trend
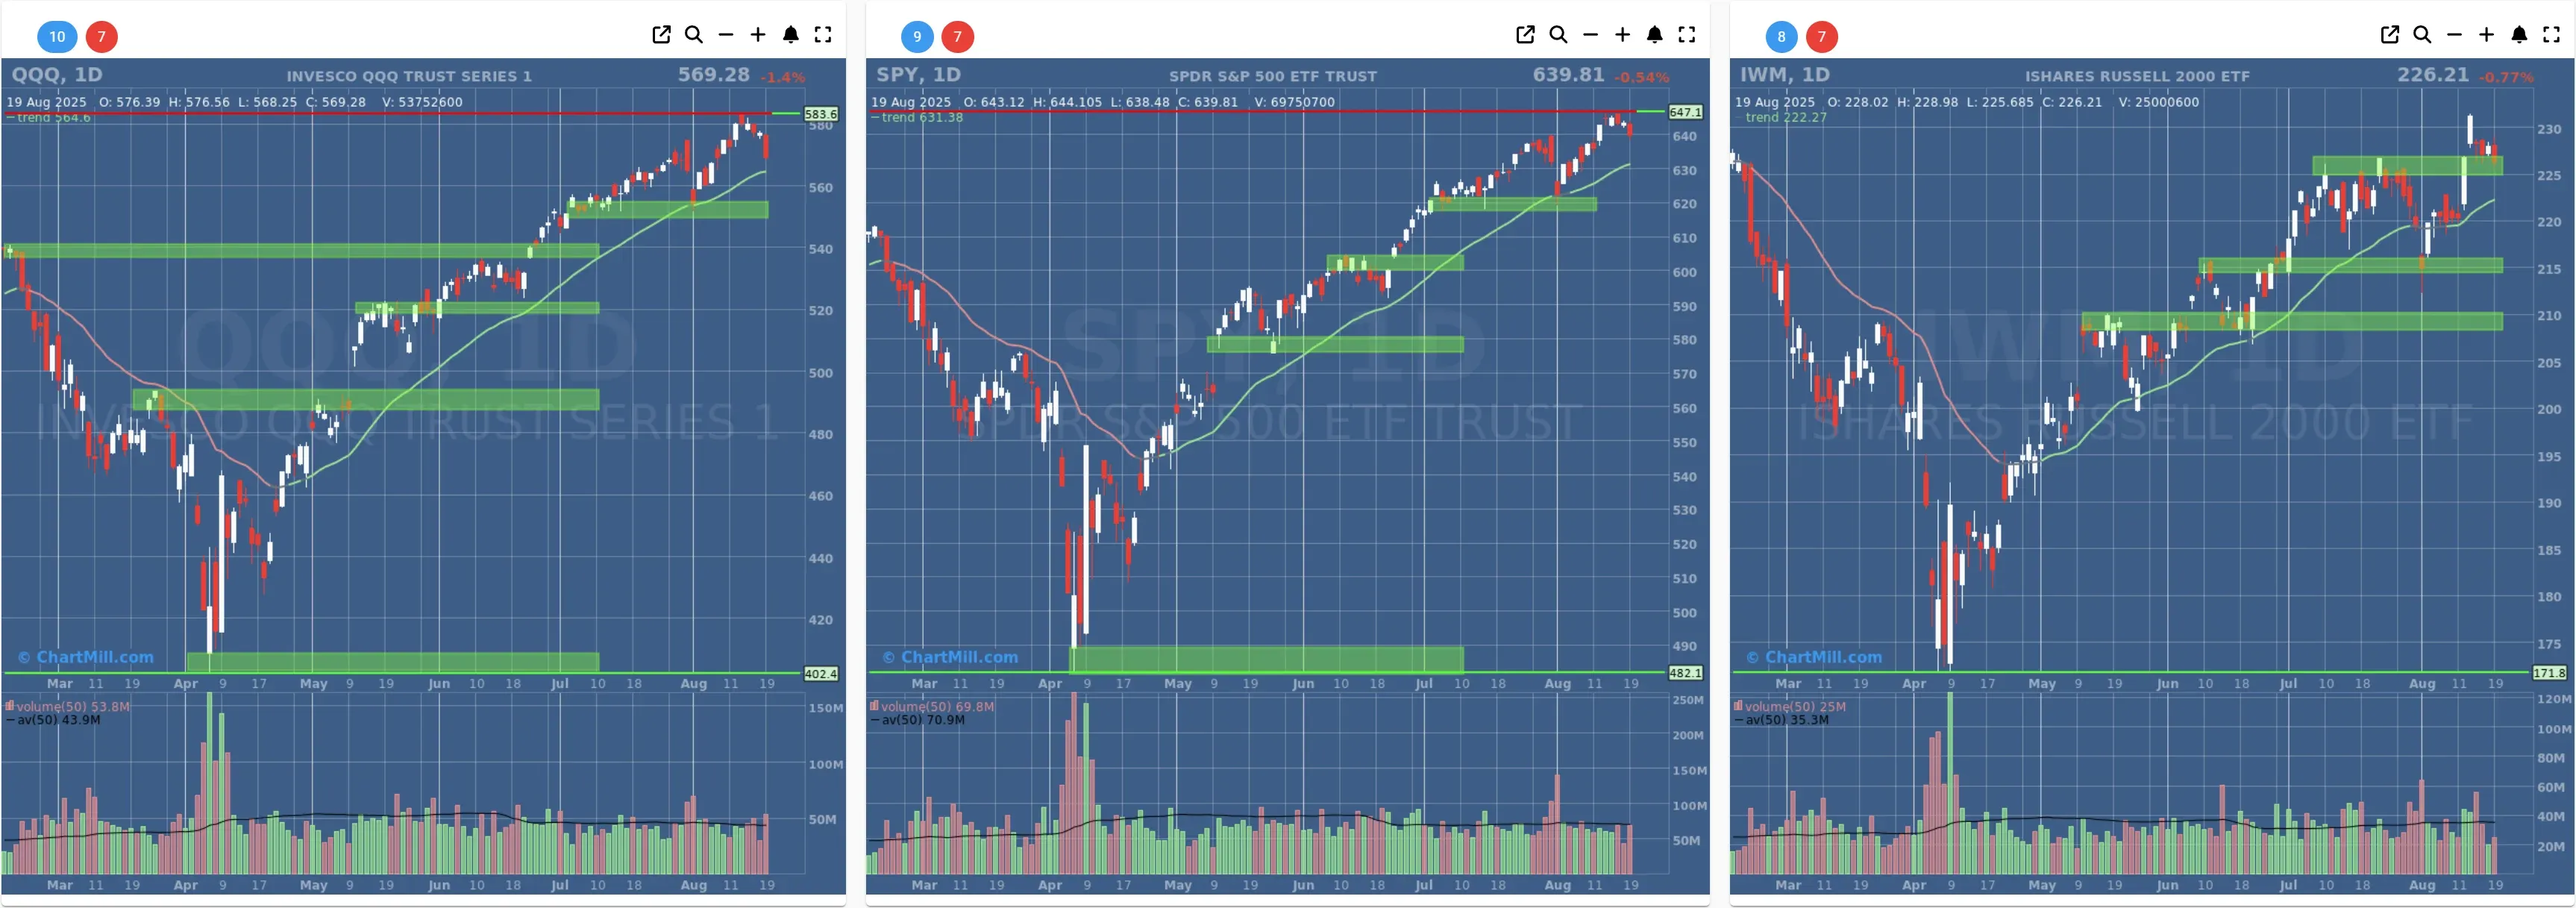
- Short-Term Trend: Bullish (from neutral)
- Next Support at $6400 - $620
- Next Resistance at /
- Volume: At Average (50)
- Pattern: Down Day
- Short-Term Trend: Bullish (no change)
- Next Support at $550 - $540
- Next Resistance at /
- Volume: Above Average (50)
- Pattern: Firm Down Day
- Short-Term Trend: Positive (from neutral)
- Next Support at $225
- Next Resistance at $245
- Volume: Far Below Average (50)
- Pattern: Down Day - Testing Support
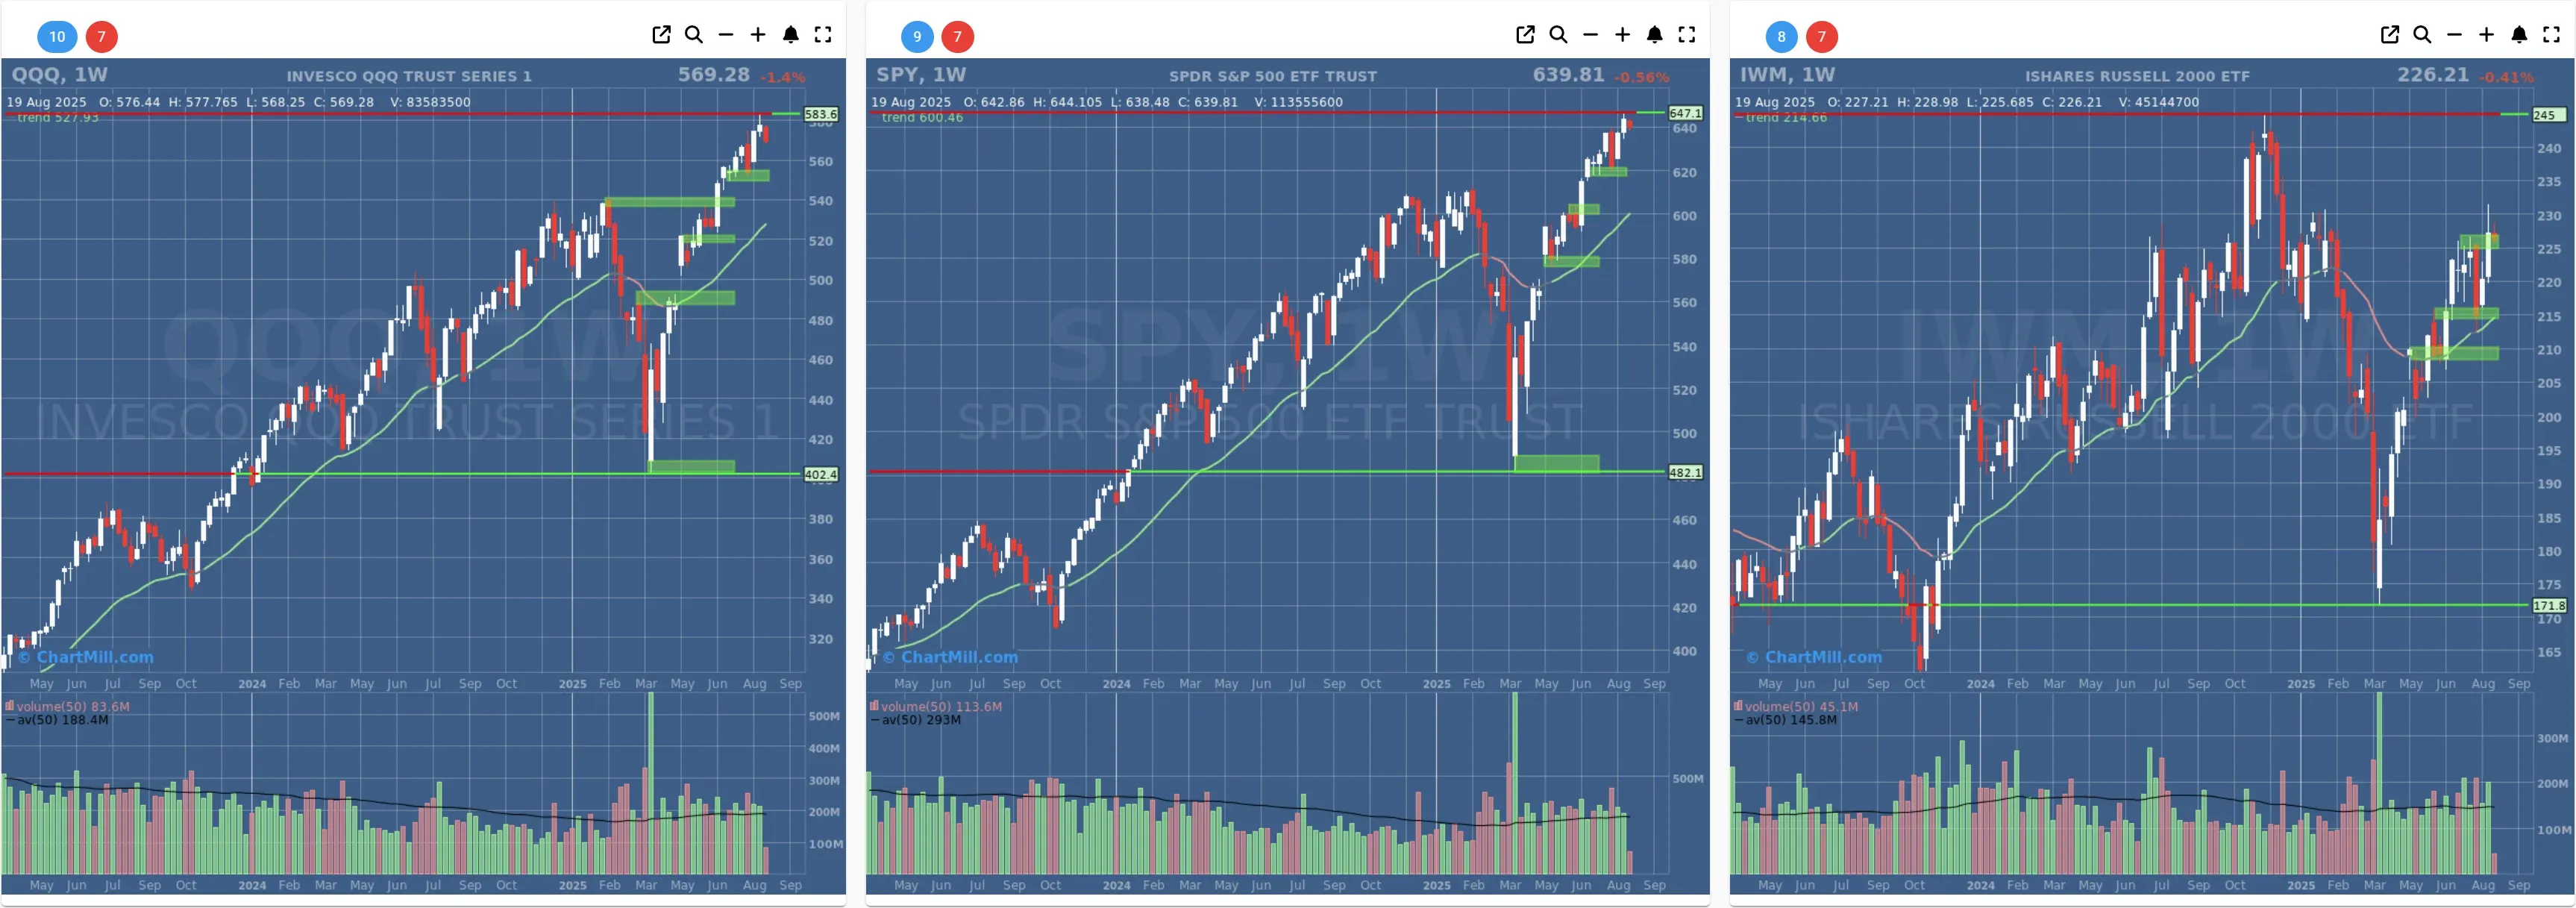
Long Term Trend
- Long-Term Trend: Positive (no change)
- Long-Term Trend: Positive (no change)
- Long-Term Trend: Positive (from neutral)
Daily Market Breadth Analysis – August 19, 2025 (After Market Close)
Breadth metrics softened again on August 19, reversing much of the prior session’s rebound. Participation remains uneven, with advancing issues struggling to gain traction while longer-term trend measures are still holding above water.
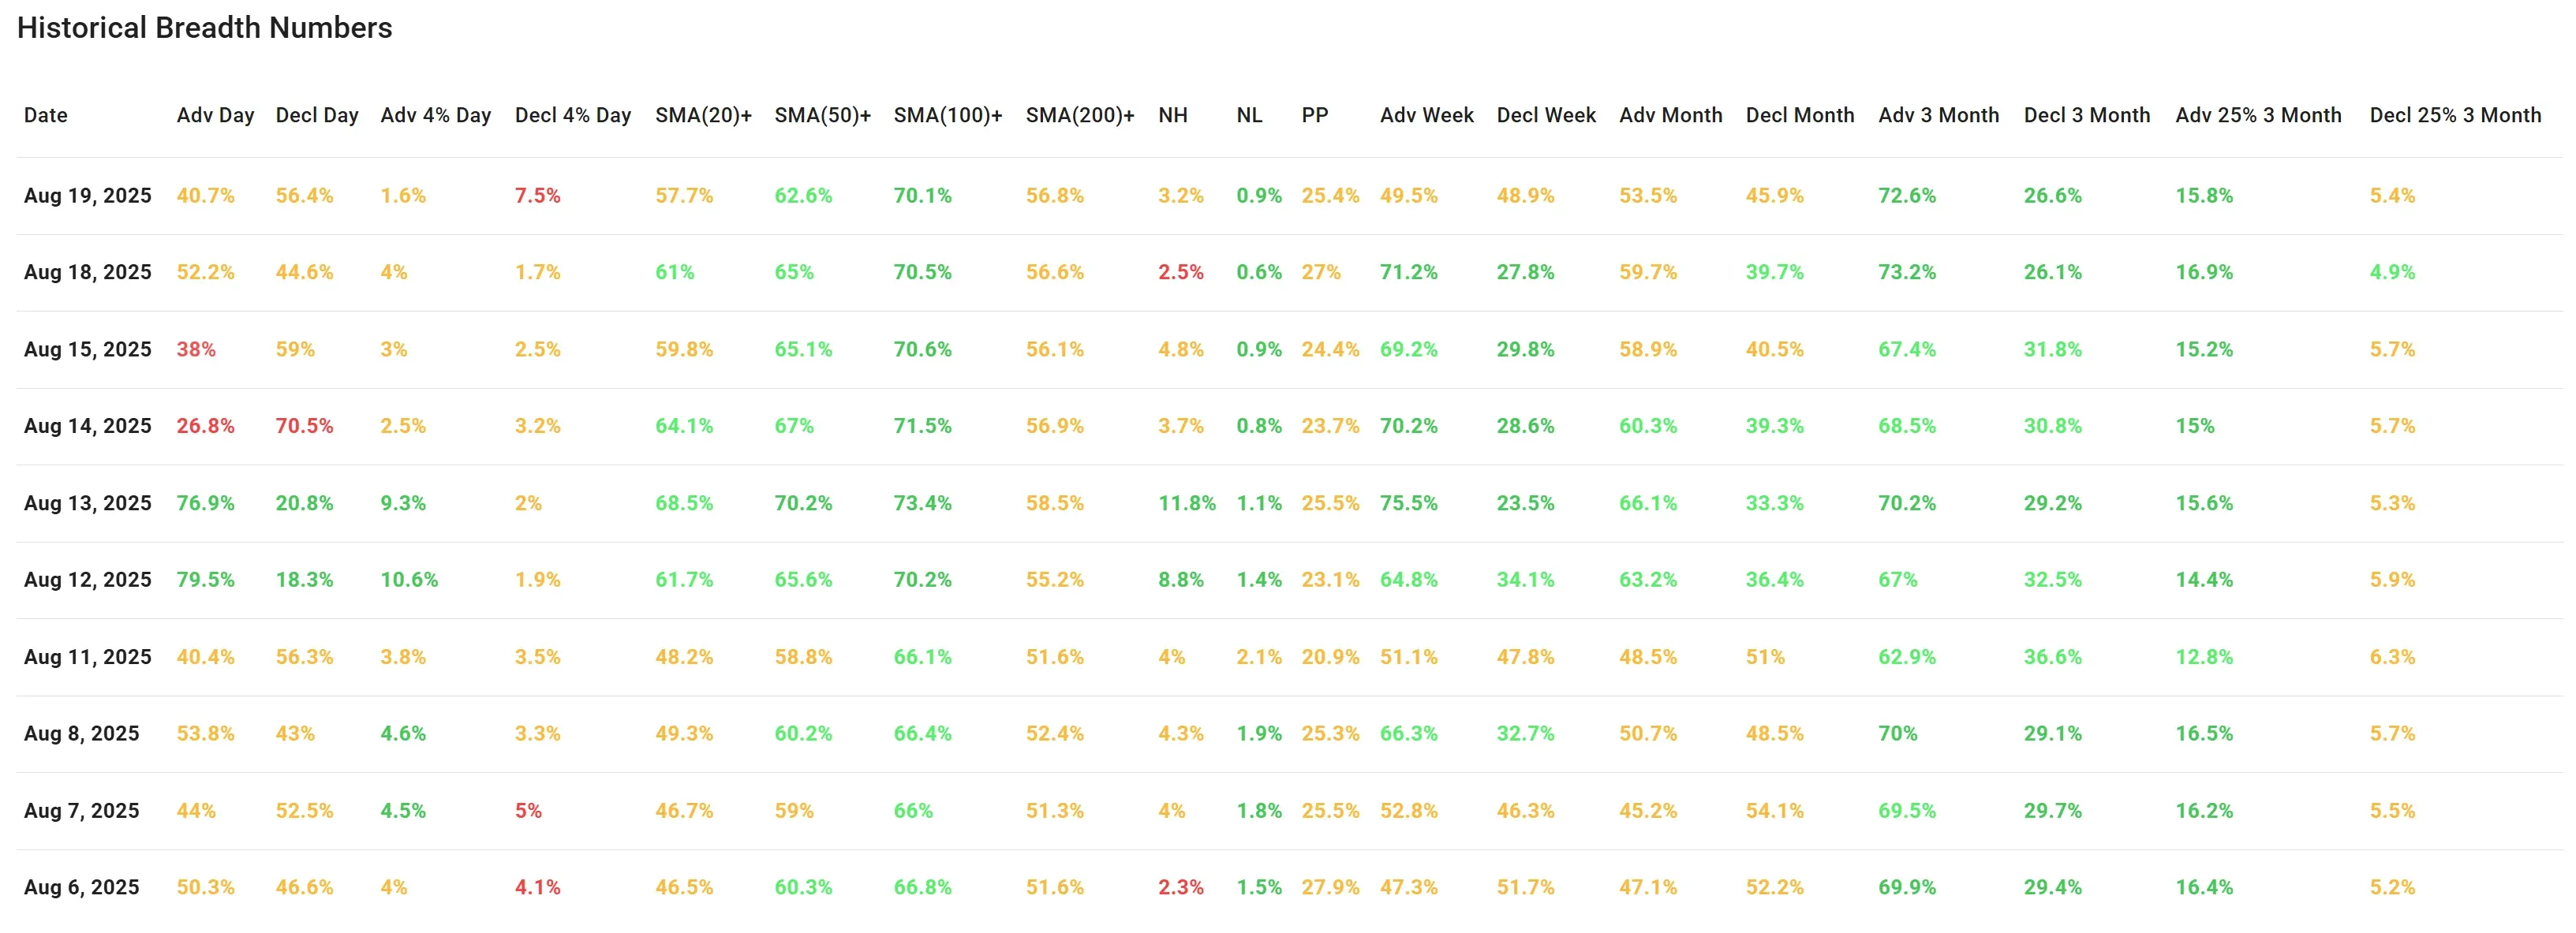
After Monday’s encouraging bounce, where advancers briefly outpaced decliners, Tuesday’s session (Aug 19) slipped back into weaker territory.
Only 40.7% of stocks advanced, while 56.4% declined, marking a reversal from the 52%/45% balance seen the day before.
Short-term momentum indicators show the pullback clearly. Just 1.6% of stocks gained more than 4% compared to 7.5% losing more than 4%, flipping yesterday’s healthier 4% vs. 1.7% dynamic.
This shift suggests selling pressure was concentrated in a subset of names with sharper downside moves.
Medium- and longer-term trend gauges, however, continue to look steadier. Roughly 57.7% of stocks remain above their 20-day SMA, only slightly lower than Monday’s 61%. The 50-day, 100-day, and 200-day readings (62.6%, 70.1%, and 56.8% respectively) are holding near their recent averages, showing that while day-to-day swings have been sharp, the broader uptrend hasn’t broken down yet.
New highs (3.2%) outpaced new lows (0.9%), in line with prior sessions, though less convincing than the strong August 13–14 readings when double-digit highs were seen.
On a broader timeframe, the weekly and monthly advances remain mixed. The weekly advancers dipped to 49.5%, close to balance with decliners at 48.9%. Monthly breadth is somewhat stronger, with 53.5% of stocks positive over the month, but the margin is narrowing compared to last week’s more decisive readings.
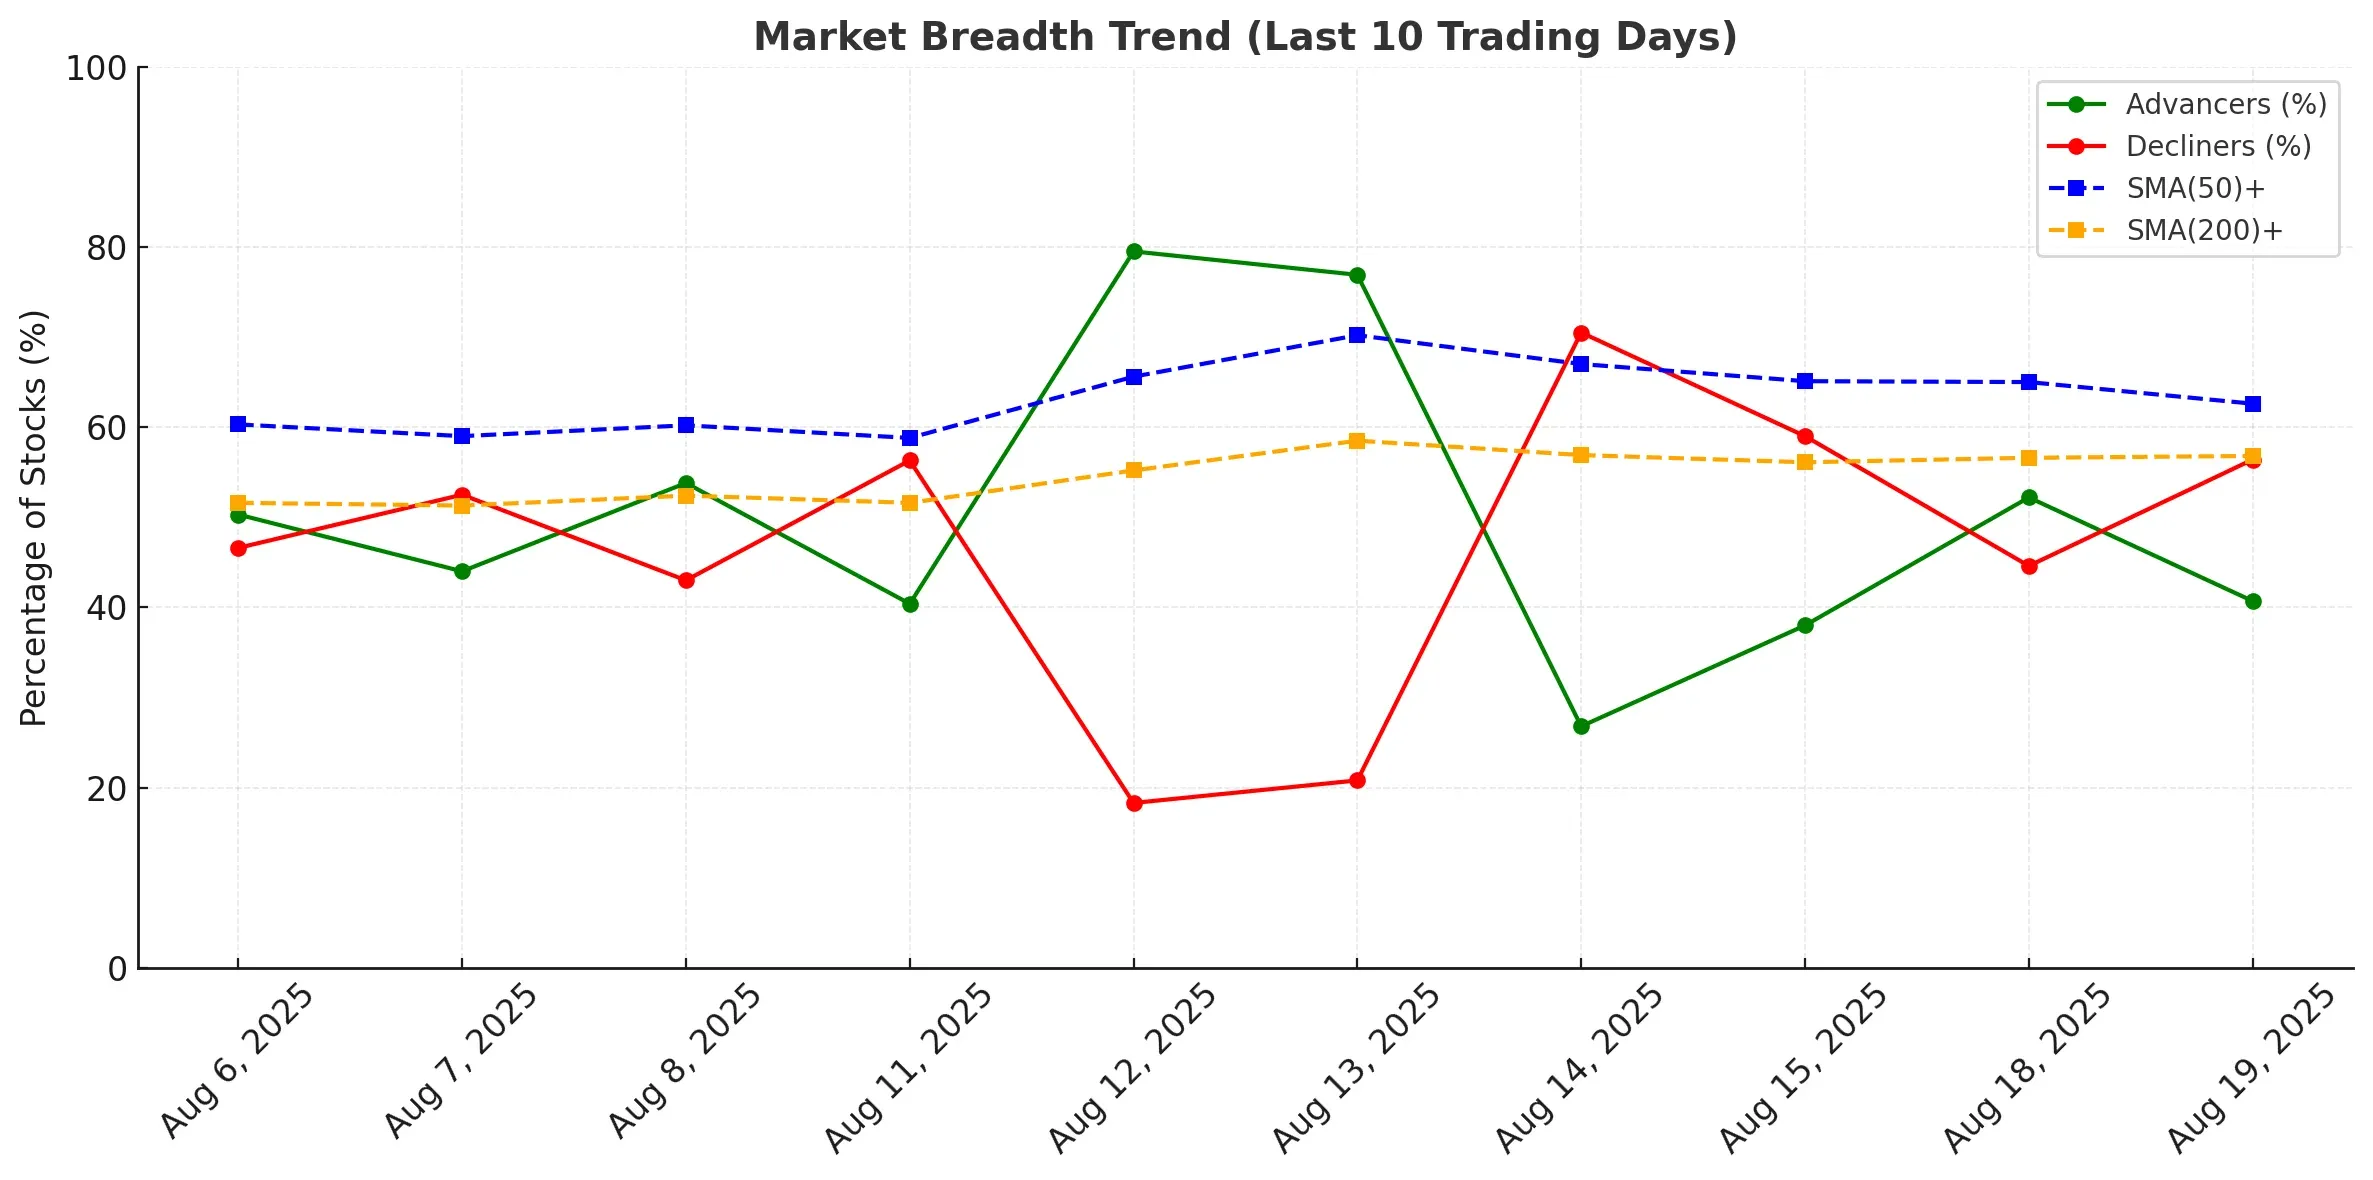
Comparing this with the August 18 analysis, the bounce was not sustained. Instead, breadth weakened quickly, underscoring the fragile participation beneath headline index levels. This resembles the mid-August pattern (Aug 14–15), where brief rebounds were also followed by swift reversals.
Breadth Trend Rating: 3 – Neutral
The overall trend sits at neutral. Short-term momentum has weakened again, but the resilience of longer-term breadth measures and the balance in weekly and monthly readings keep the broader structure intact.

Kristoff - ChartMill
Next to read: Market Monitor News, August 20 BMO