(All data & visualisations by ChartMill.com)
Daily Market Trend Analysis – July 22, 2025 (After Market Close)
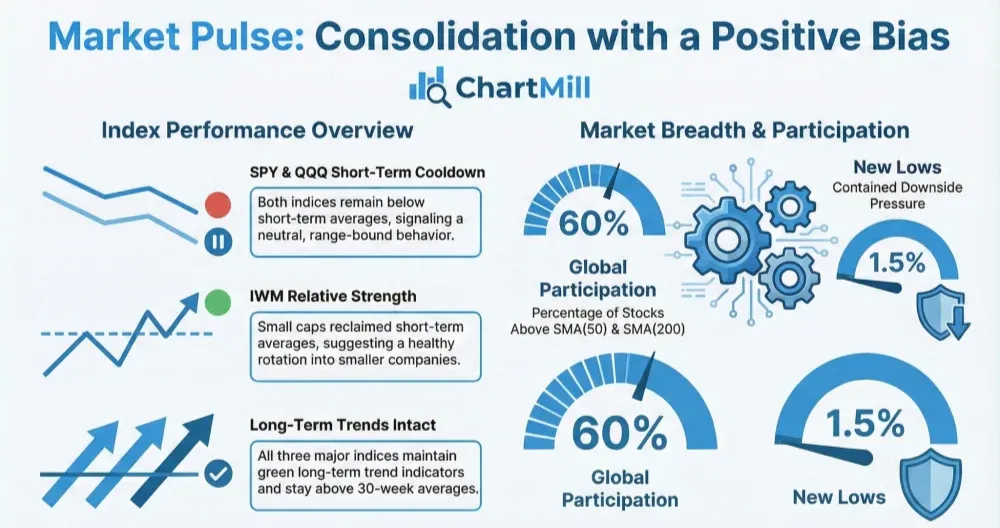
calm day for US index etf's. QQQ closes with a small loss, SPY manages to close just in the green. IWM is the best performing student of the day, with a gain of 0.88%.
Short Term Trend
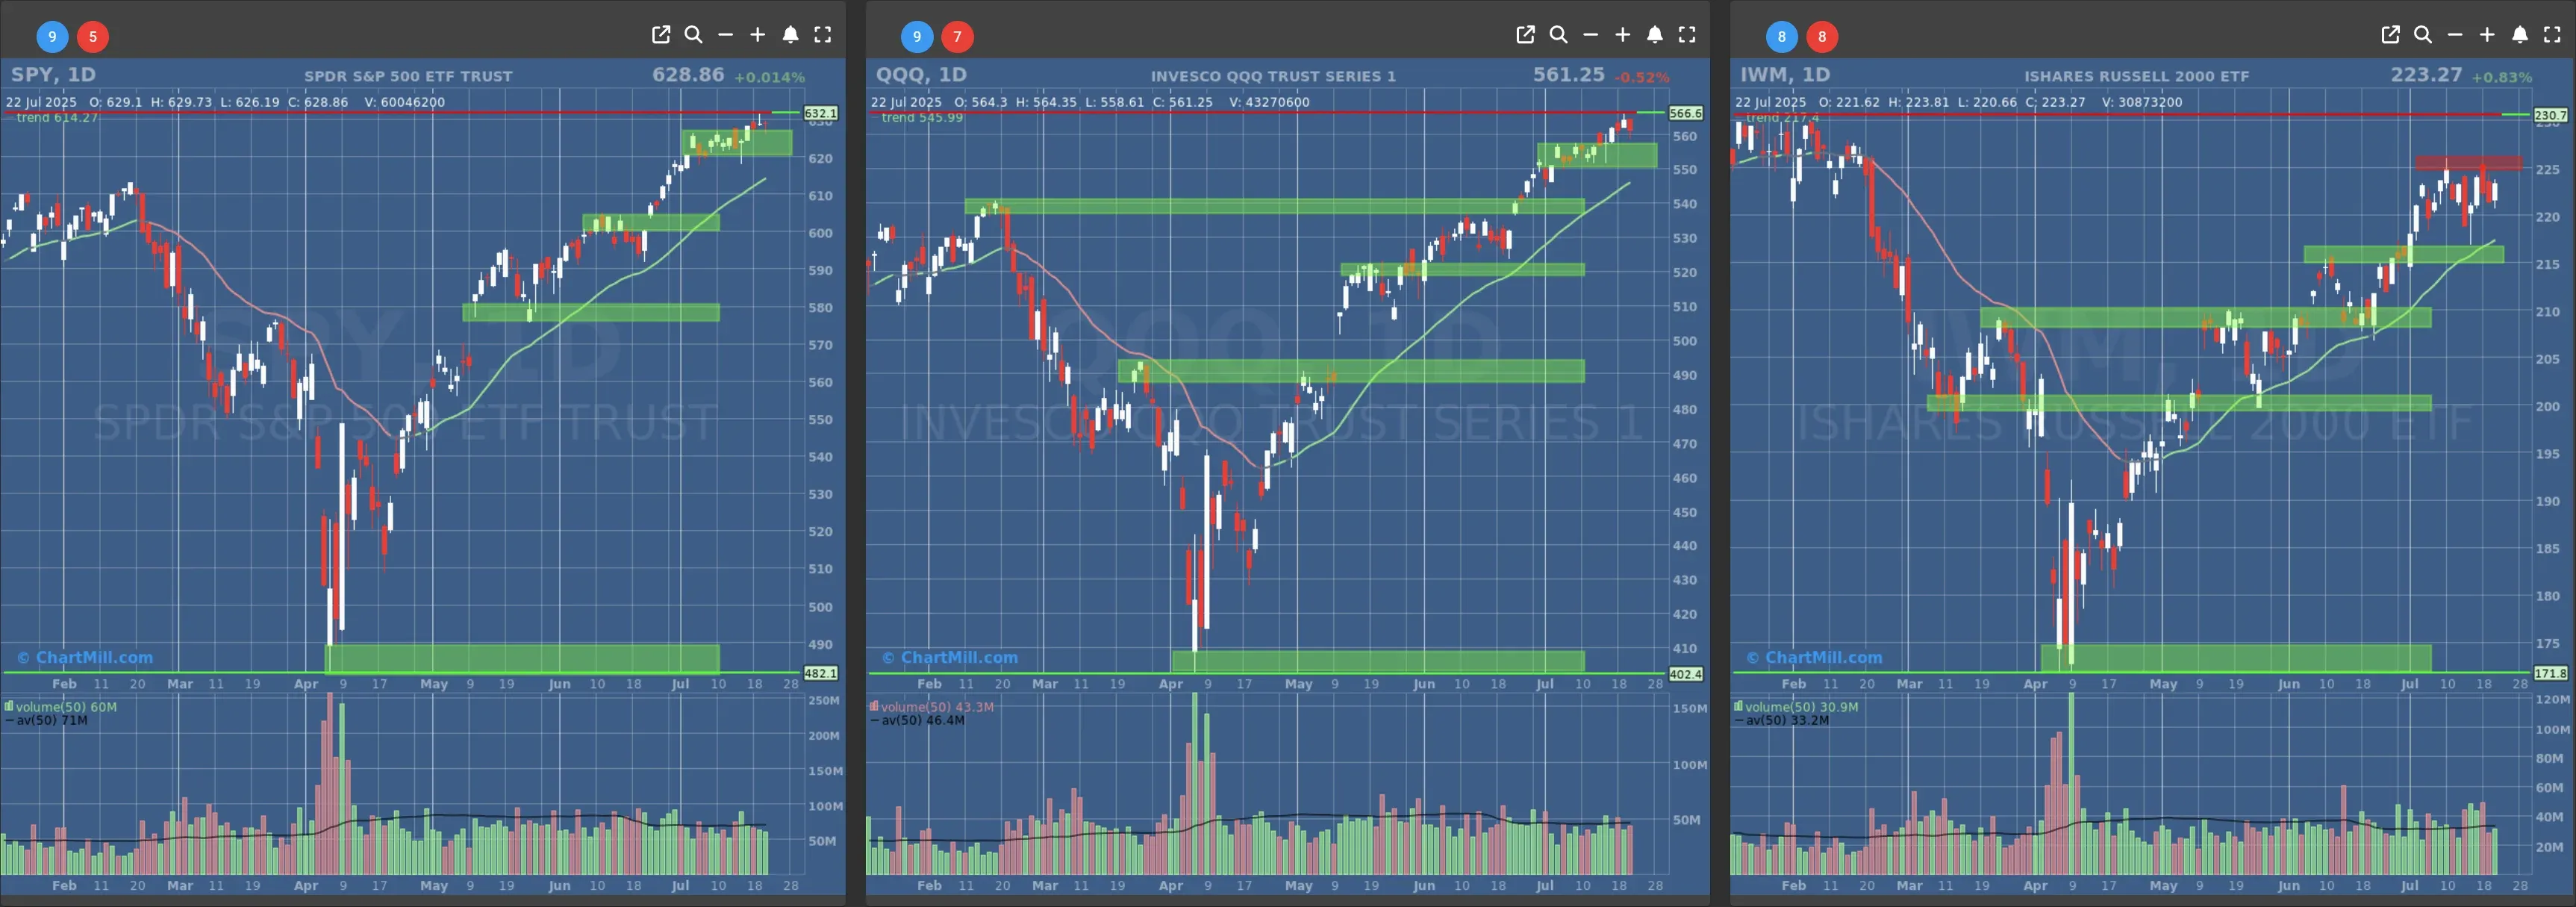
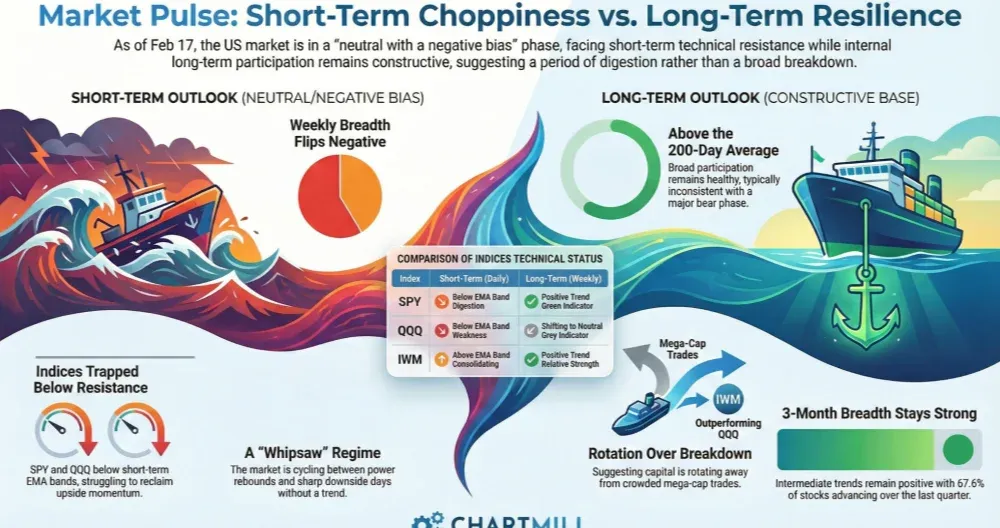
- Short-Term Trend: Bullish (no change)
- Next Support at $620 - $600
- Next Resistance at $632
- Volume: At Average (50)
- Pattern: Up Day - Hanging Man Candle
- Short-Term Trend: Bullish (no change)
- Next Support at $550 - $540
- Next Resistance at $566
- Volume: At Average (50)
- Pattern: Down Day
- Short-Term Trend: Bullish (no change)
- Next Support at $220 - $215
- Next Resistance at $225
- Volume: At Average (50)
- Pattern: Up Day
Long Term Trend
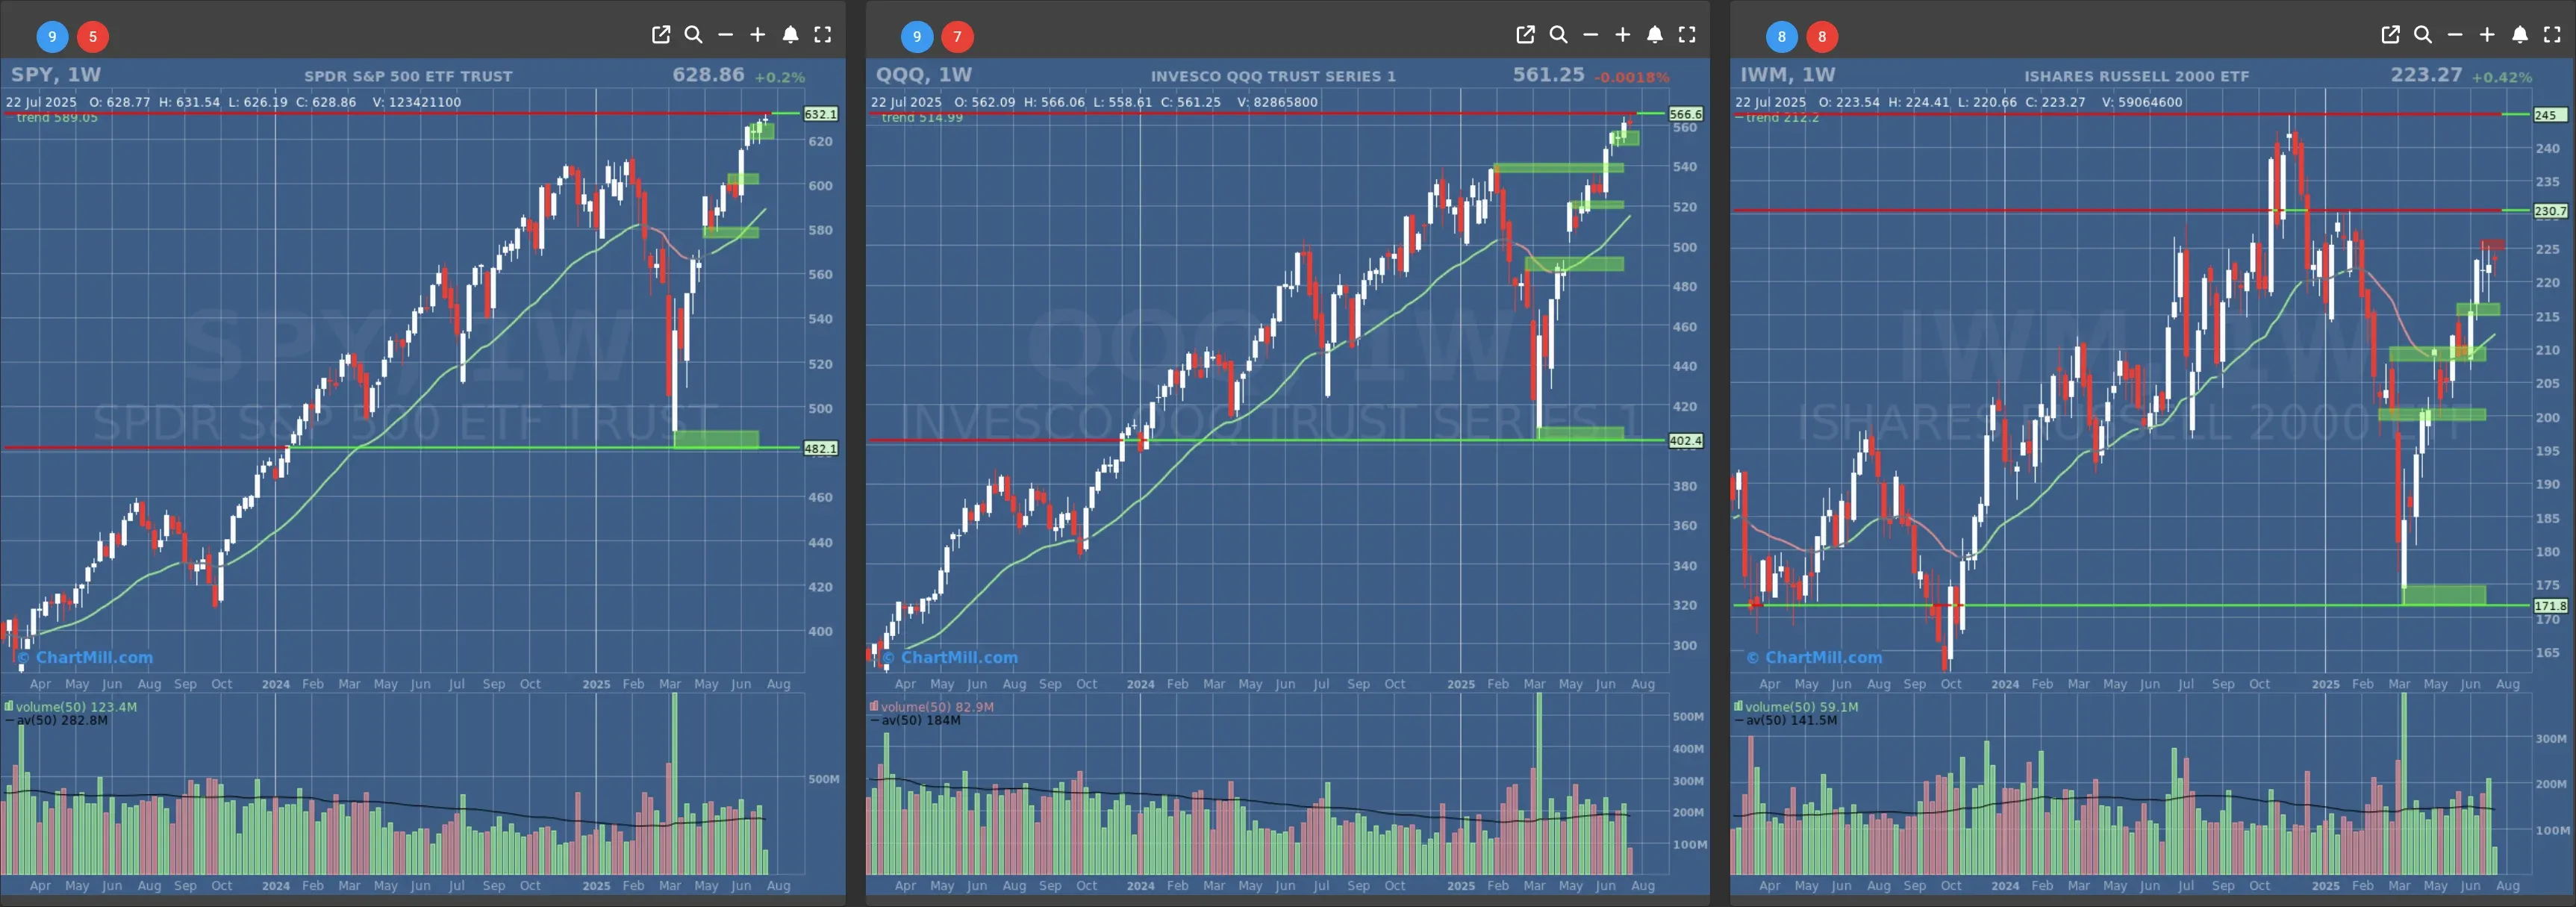
- Long-Term Trend: Positive (no change)
- Long-Term Trend: Positive (no change)
- Long-Term Trend: Positive (no change)
Daily Market Breadth Analysis – July 22, 2025 (After Market Close)
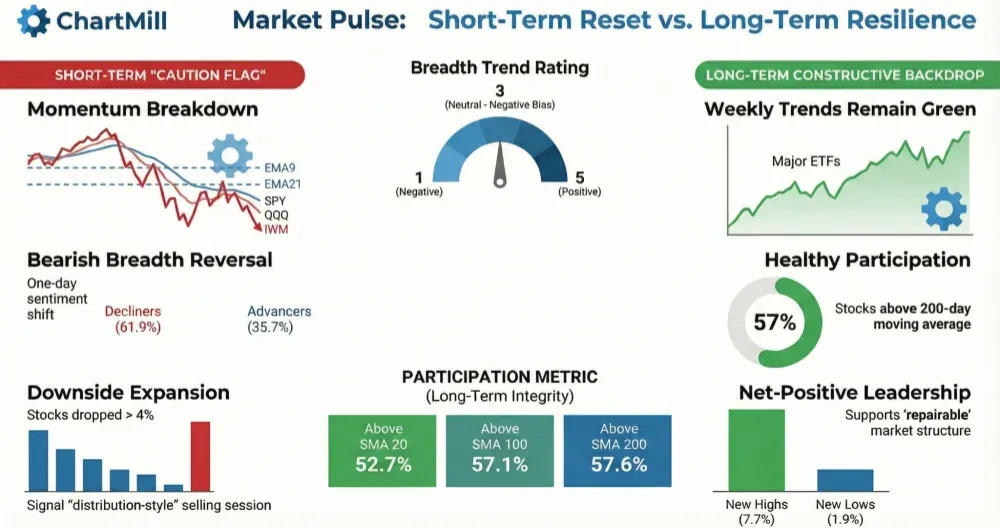
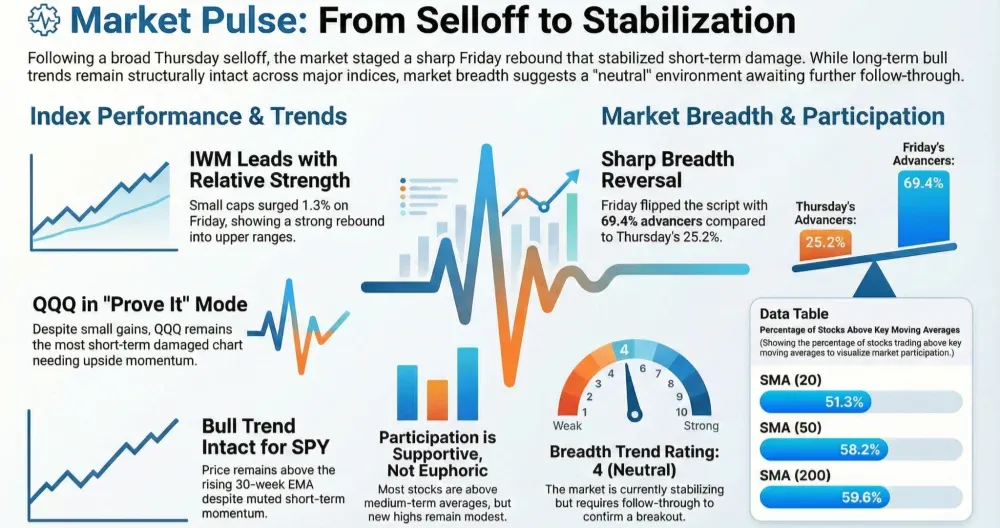
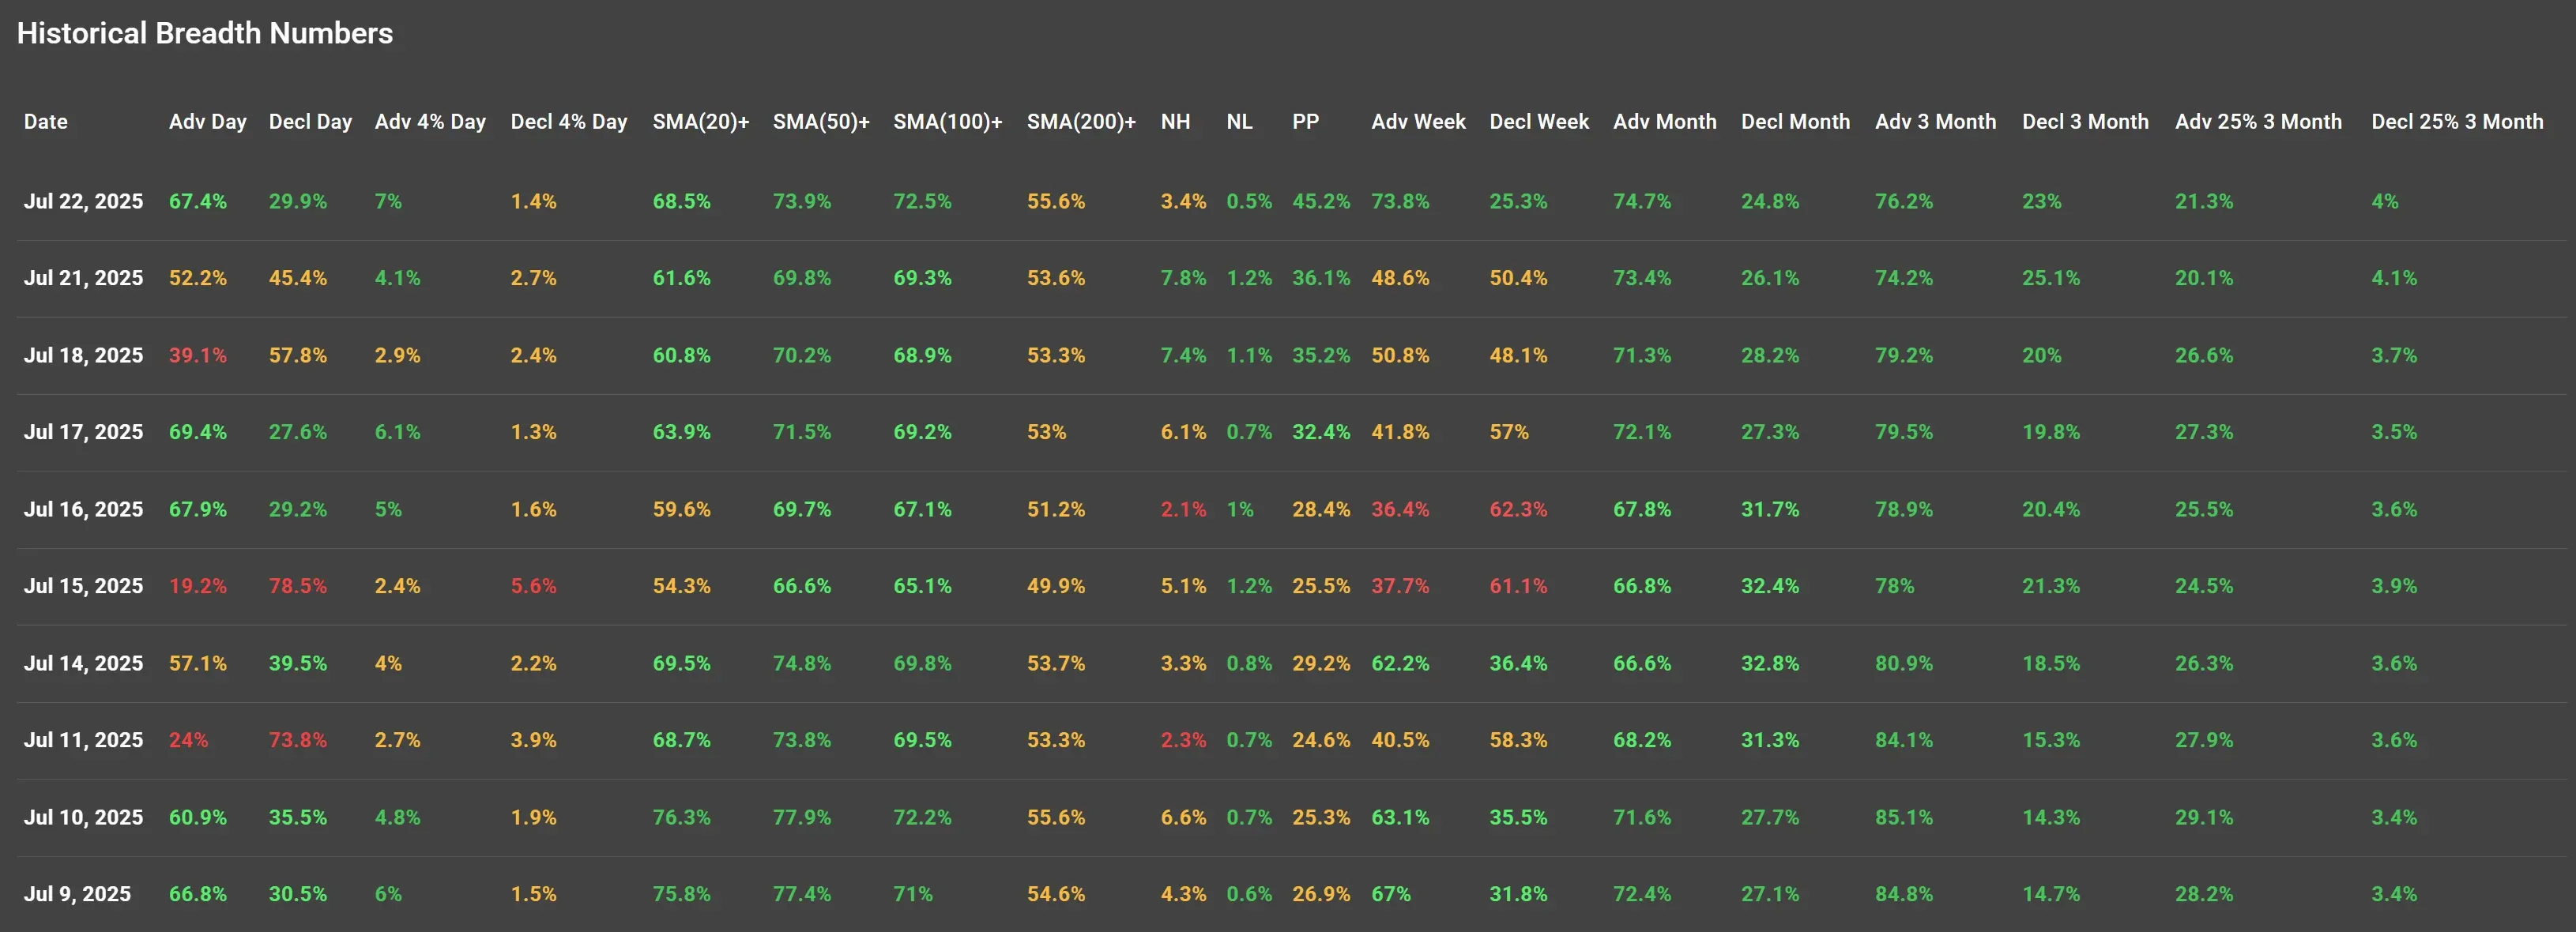
After Friday’s sharp decline in participation, breadth figures bounced back convincingly to start the week. On Tuesday, July 22, 67.4% of stocks advanced, while only 29.9% declined. This reversal suggests renewed buying interest across the board. Notably, 7% of stocks rose more than 4% on the day - double Friday’s count - indicating improving upside momentum. Only 1.4% saw losses of more than 4%.
Breadth Strength Resumes
This recovery comes after Friday’s weak reading (July 19), where just 39.1% advanced and nearly 58% declined, with clear risk-off sentiment dominating. The shift Tuesday (and Monday) marks a resumption of the broader bullish participation trend that had been building mid-last week.
Moving Averages Participation Remains Strong
Percentage of stocks above key moving averages:
MA Jul 22 Jul 18 Trend
(20) 68.5% 60.8% ▲
(50) 73.9% 70.2% ▲
(100) 72.5% 68.9% ▲
(200) 55.6% 53.3% ▲
These levels have been climbing again after dipping on July 18 and July 19. The rebound aligns with the general market strength shown Monday and suggests buyers are defending key trend levels. The SMA(200)+ percentage, now at 55.6%, is the highest since July 10.
New Highs vs. New Lows (NH/NL)
New highs dropped significantly on Tuesday to 3.4%, despite overall advancing breadth. This may reflect a pause in breakout momentum or short-term exhaustion in leading names. New lows remain near zero, which is constructive.
Weekly, Monthly, and Quarterly Breadth Metrics
Period Advancing % Declining %
Week 73.8% 25.3%
Month 74.7% 24.8%
3 Month 76.2% 23.0%
Broad strength persists across all time frames, confirming that despite Friday's weakness, the medium-term trend remains intact. Note: these figures improved across the board compared to July 18.
High-Volatility/High-Range Stocks Trends
-
25%+ gainers over 3 months: 21.3%
-
25%+ losers over 3 months: 4%
This spread remains wide and consistent, emphasizing how breakouts and momentum setups continue to perform well in this environment.
Pattern Watch: Continuation and Rotation
The breadth data over the past 10 sessions reveals the following trend:
-
July 15 and July 18 showed clear weakness with high decliner ratios, pulling breadth down.
-
July 17 and July 22 reflect renewed broad-based strength, particularly with high numbers above key moving averages and improving weekly/monthly advance rates.
The drop in new highs is worth watching. It could signal rotation beneath the surface, where breadth is strong, but leadership shifts from recent winners to new groups.
Summary of Breadth Trend (Last 10 Sessions)
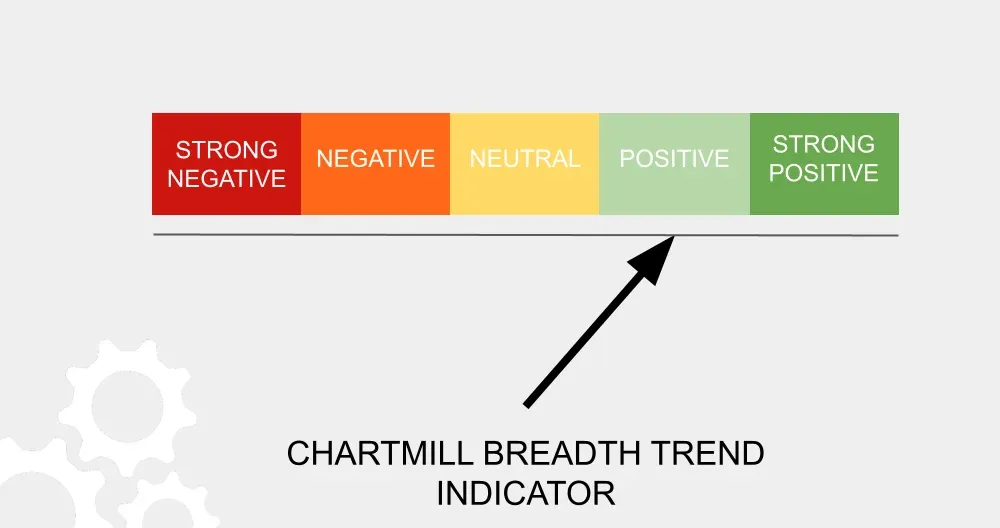
Based on the last 10 trading days and current readings, we maintain a positive trend for market breadth.
Breadth Trend
The underlying structure remains firm, with participation broadening again after Friday’s dip. Provided moving average breadth and long-term advance/decline metrics remain elevated, this trend should support continuation in the broader indexes.
Outlook The current backdrop suggests a healthy bull environment where temporary weakness is met with renewed buying pressure. The fact that over 73% of stocks are advancing over weekly and monthly timeframes is indicative of solid internal strength. However, watch for signs of fatigue if new highs continue to fade, particularly if volatility picks up midweek.
Kristoff - ChartMill
Next to read: Market Monitor News, July 23