

(All data & visualisations by ChartMill.com)
Daily Market Trend Analysis – July 21, 2025 (After Market Close)
Minor gains for QQQ and SPY but still new all time highs!
Short Term Trend
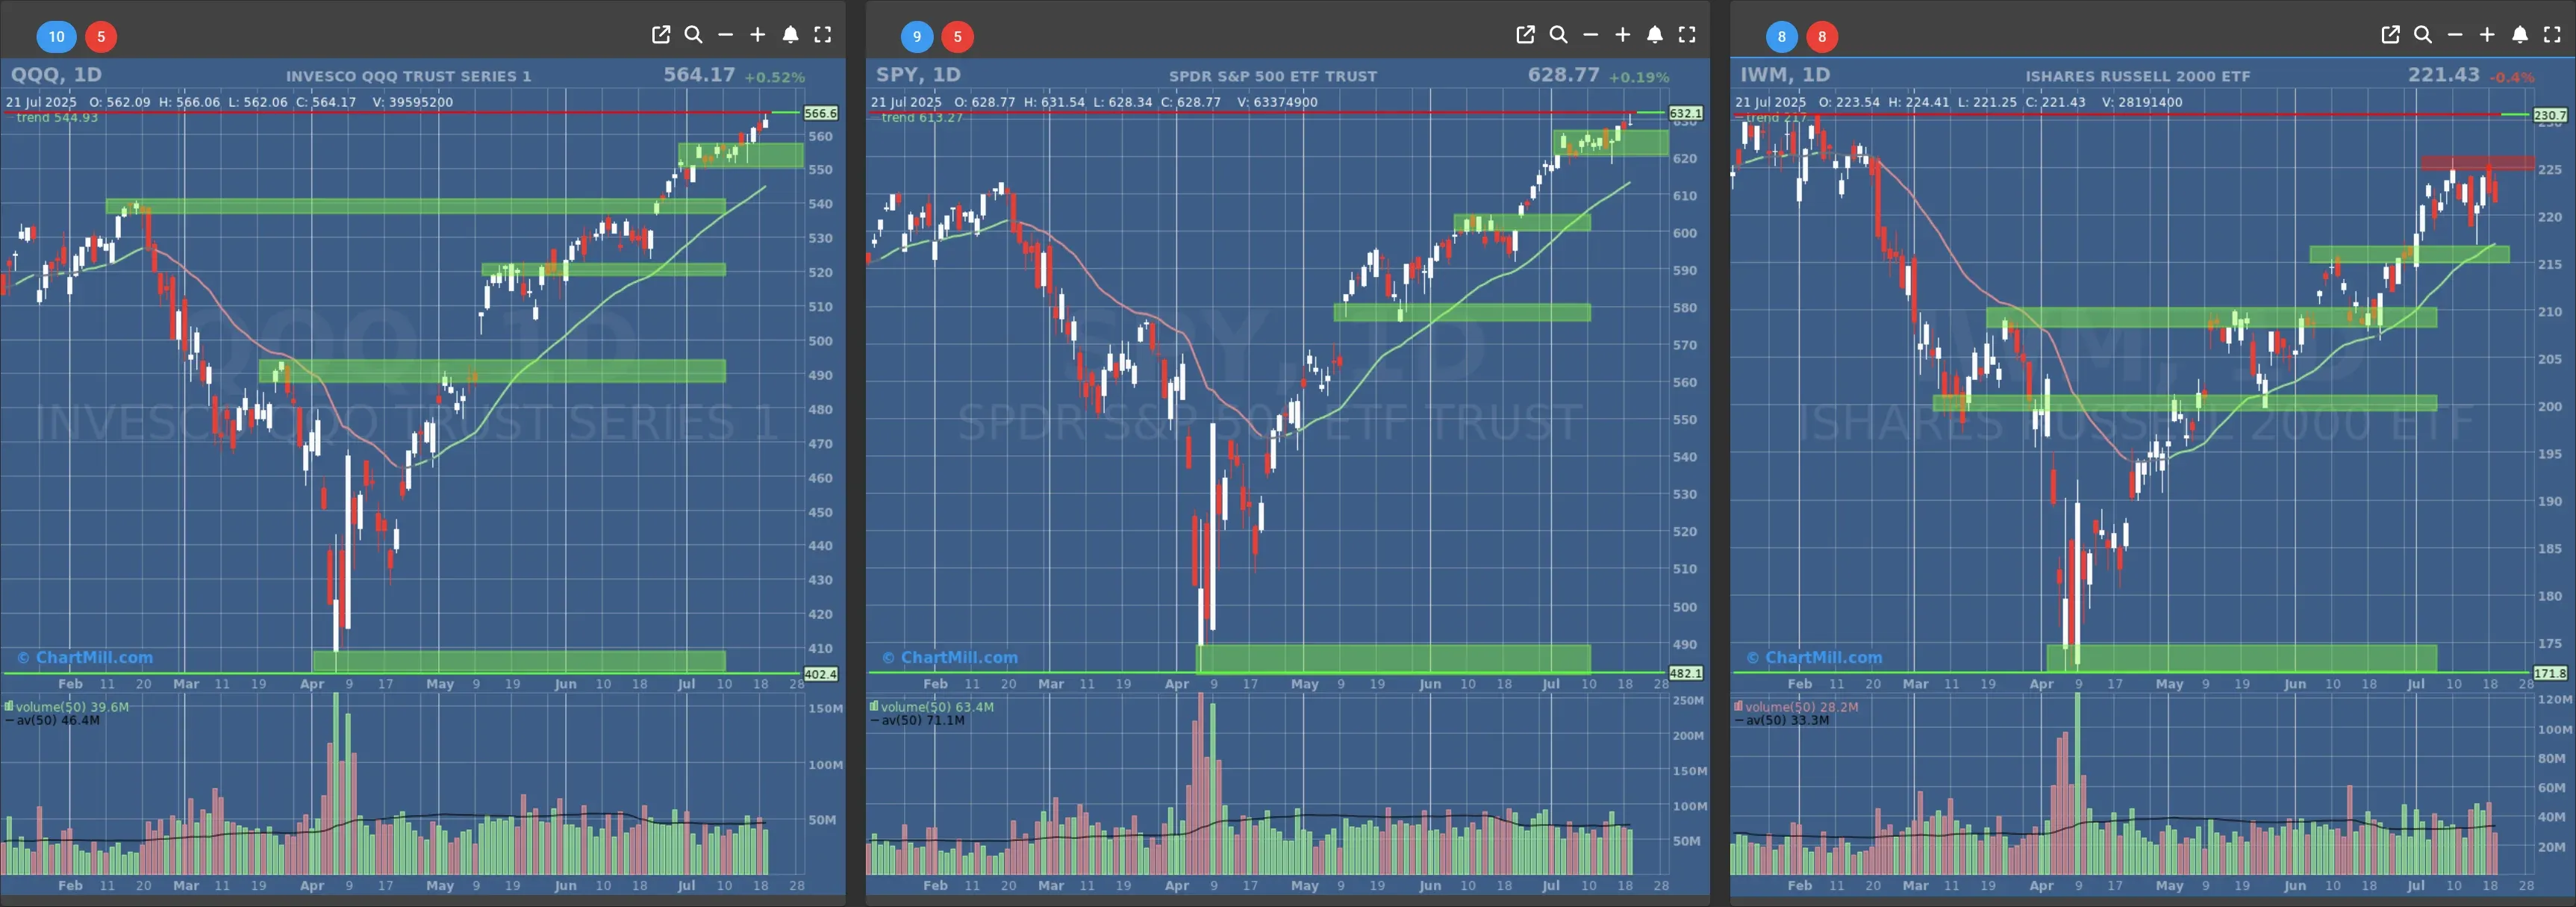
- Short-Term Trend: Bullish (no change)
- Next Support at $620 - $600
- Next Resistance at /
- Volume: Slightly Below Average (50)
- Pattern: Up Day - New All Time High
- Short-Term Trend: Bullish (no change)
- Next Support at $550 - $540
- Next Resistance at /
- Volume: Slightly Below Average (50)
- Pattern: Up Day - Doji Candle - New All Time High
- Short-Term Trend: Bullish (no change)
- Next Support at $220
- Next Resistance at $225
- Volume: Slightly Below Average (50)
- Pattern: Down Day
Long Term Trend
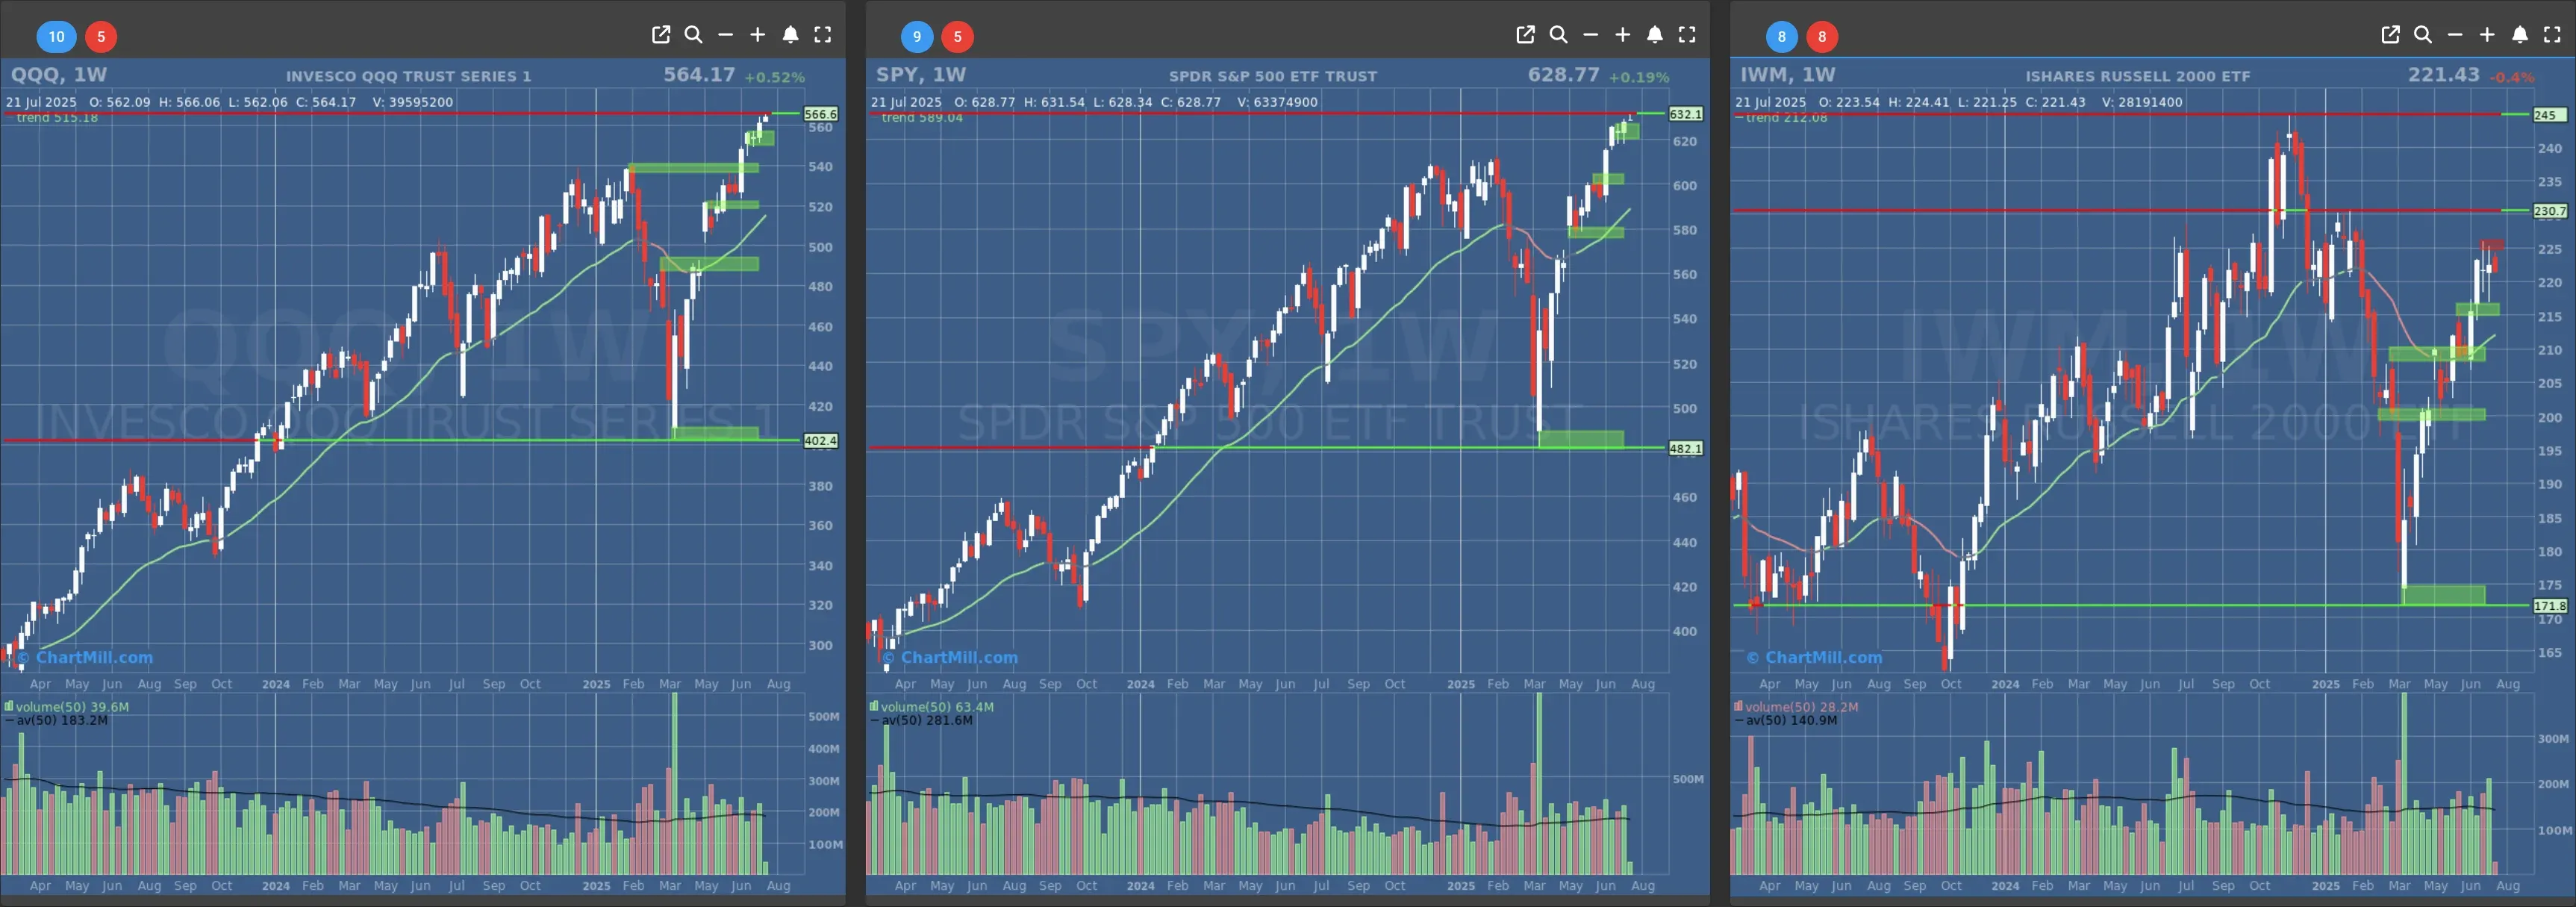
- Long-Term Trend: Positive (no change)
- Long-Term Trend: Positive (no change)
- Long-Term Trend: Positive (no change)
Daily Market Breadth Analysis – July 21, 2025 (After Market Close)
The U.S. equity markets closed Monday, July 21, with a modestly positive breadth reading, continuing the stabilization that began late last week. After Friday’s disappointing participation, the start of the new trading week showed broad but cautious buying interest across various metrics.
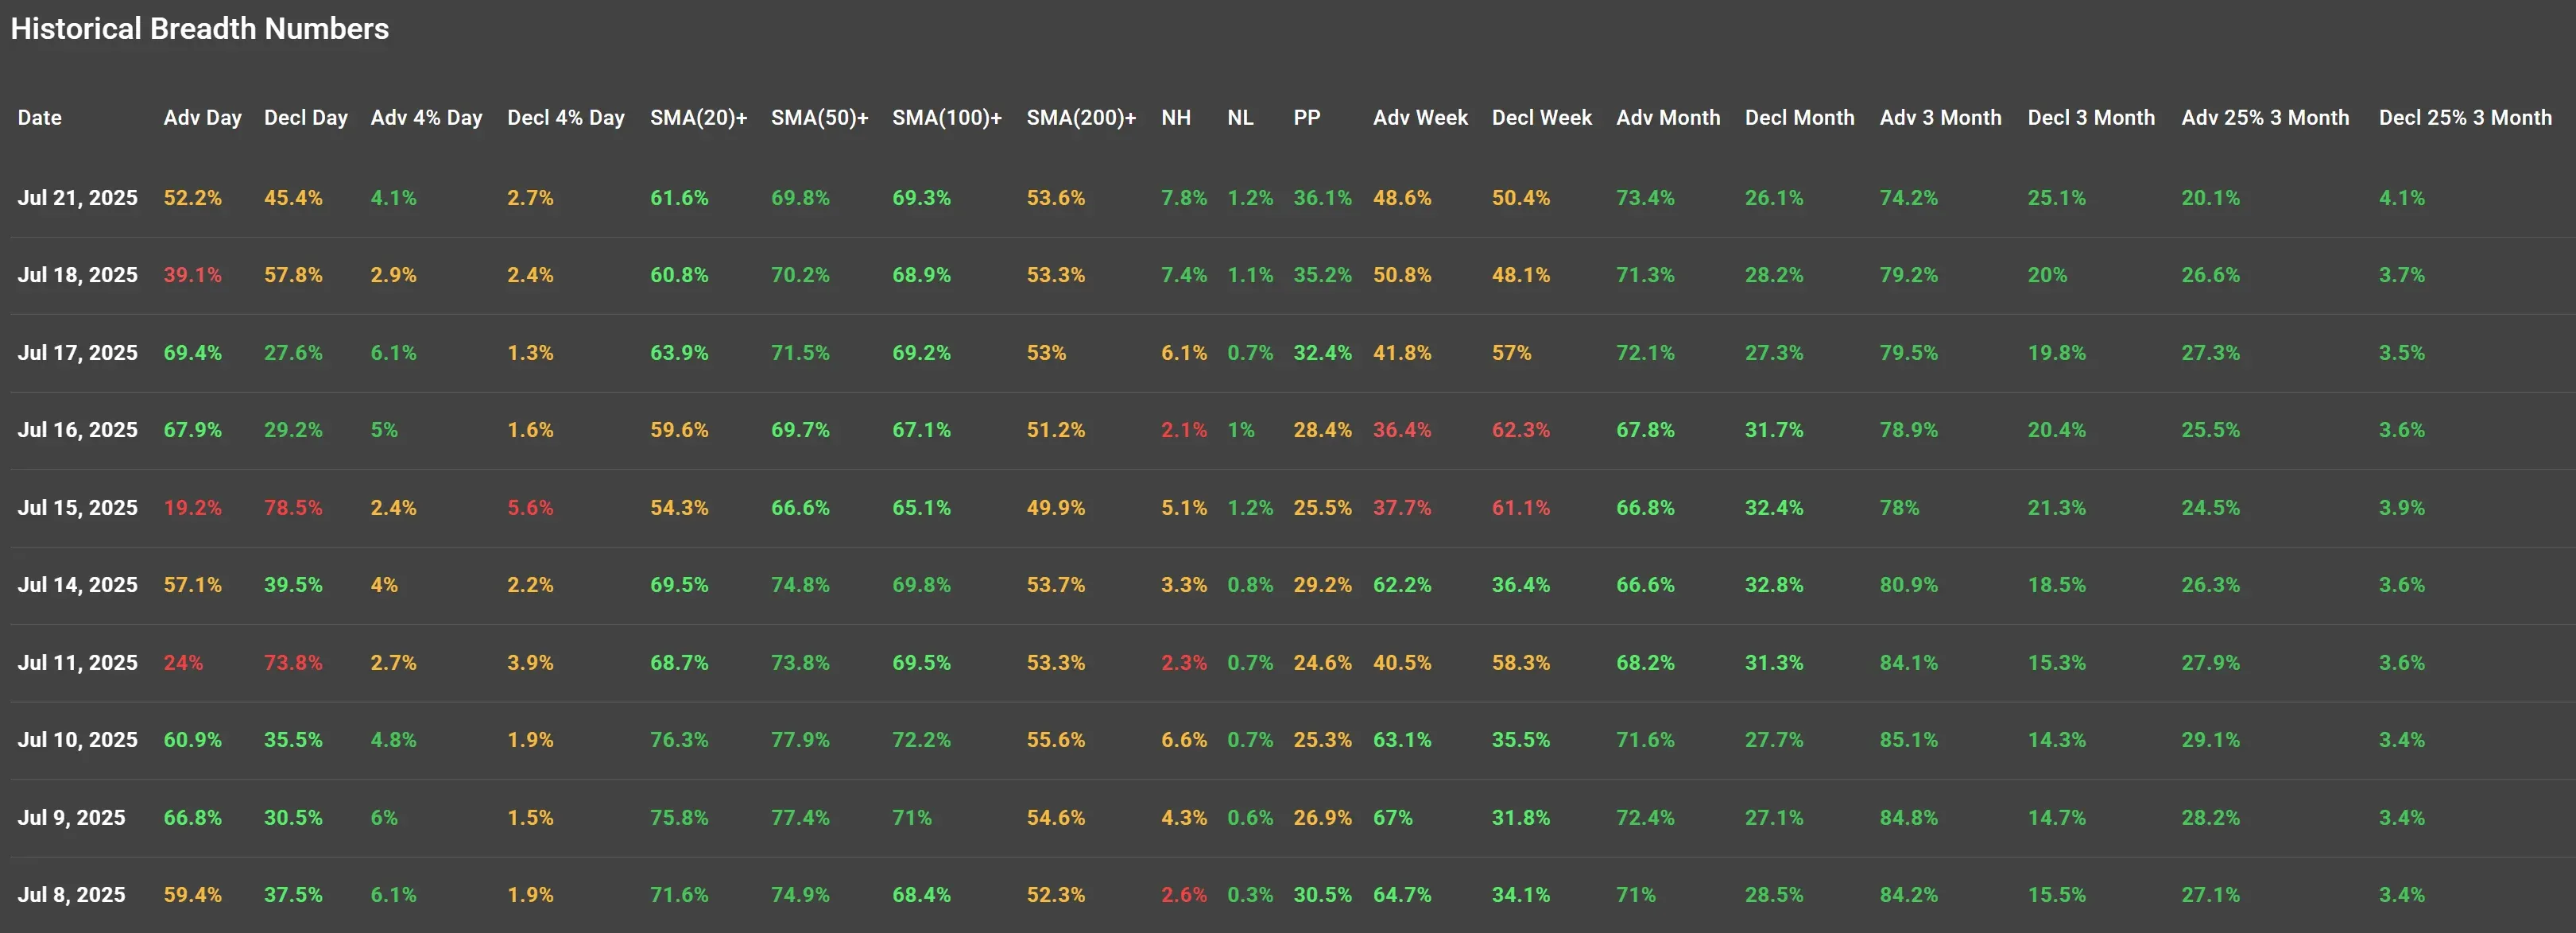
Daily Breadth Metrics
-
Advancing vs. Declining Stocks: 52.2% of stocks advanced on Monday, outpacing the 45.4% that declined. This marks a clear improvement from Friday (July 18), when decliners dominated at 57.8% vs. only 39.1% advancing.
-
Strong Movers: 4.1% of stocks rose more than 4%, while only 2.7% declined more than 4%. While not explosive, this spread suggests a healthy tilt toward strength.
Short-Term Trend Participation:
-
Stocks trading above their 20-day SMA improved slightly to 61.6%, rebounding from 60.8% on Friday.
-
The 50-day and 100-day SMA readings remained stable at 69.8% and 69.3%, respectively, indicating intermediate trend resilience.
-
However, participation above the 200-day SMA stayed flat at 53.6%, a mild uptick from 53.3% on Friday, showing continued hesitation at longer-term levels.
New Highs vs. Lows
-
New Highs (NH) rose slightly to 7.8%, compared to 7.4% on Friday.
-
New Lows (NL) also edged up to 1.2%, suggesting limited deterioration but no decisive breakout either.
-
The NH-NL spread remains positive but muted, consistent with a market in consolidation rather than strong momentum.
Weekly and Monthly Trends
Weekly Breadth: A mixed picture emerged.
-
Advancers (48.6%) remained below 50% but improved from Friday’s 50.8%.
-
Decliners (50.4%) suggest selling pressure is still present, but weaker than last week’s mid-week readings.
Monthly Trends: Continue to favor bulls.
-
Advancing stocks this month: 73.4% (up from 71.3% on Friday)
-
Declining stocks this month: 26.1%
The strong monthly advance-decline ratio reflects the broader bullish undertone since early July.
Three-Month Momentum Indicators
-
3-Month Advancers: 74.2% (down slightly from Friday’s 79.2%)
-
3-Month Decliners: 25.1%
-
High Momentum Stocks (25%+ gainers over 3 months): 20.1%, a drop from Friday’s 26.6%, indicating cooling among top performers.
-
High Decliners (25%+ loss over 3 months): Slight uptick to 4.1%
Despite this minor cooling in 3-month high momentum stocks, the broader medium-term strength remains intact.
Summary and Outlook
Monday's session reflects a return to moderate bullish breadth after Friday’s weak participation. While there was no surge in momentum, the broad uptick in short-term trend metrics and daily advance-decline ratios suggests a stabilizing environment with supportive undercurrents.
The sharp rotation seen mid-week last week (particularly the July 17 spike in advancers at 69.4%) appears to have set a short-term bottom, but the market remains range-bound near key technical thresholds. The 200-day SMA participation remains a bottleneck around 53%, highlighting continued caution from longer-term investors.
Market sentiment continues to be influenced by earnings season, with many traders adopting a “wait and see” approach ahead of high-profile earnings releases this week. There was no major economic or geopolitical news during the July 21 session to explain the modest advance, making this breadth improvement more technical and sentiment-driven than fundamentally triggered.
Conclusion:
The data shows a market that is trying to grind higher, supported by strong monthly and 3-month metrics. However, the reluctance of long-term moving averages and the stagnation in high-momentum participation may cap upside in the short term unless a strong catalyst emerges during the current earnings cycle.
Next update will monitor whether this week's key earnings reports confirm or challenge the recent technical stability.
Kristoff - ChartMill
Next to read: Market Monitor News Analysis, July 22