

(All data & visualisations by ChartMill.com)
Daily Market Trend Analysis – June 17, 2025 (After Market Close)
Not much excitement in the financial markets, even with all the geopolitical tension building up.
Short Term Trend
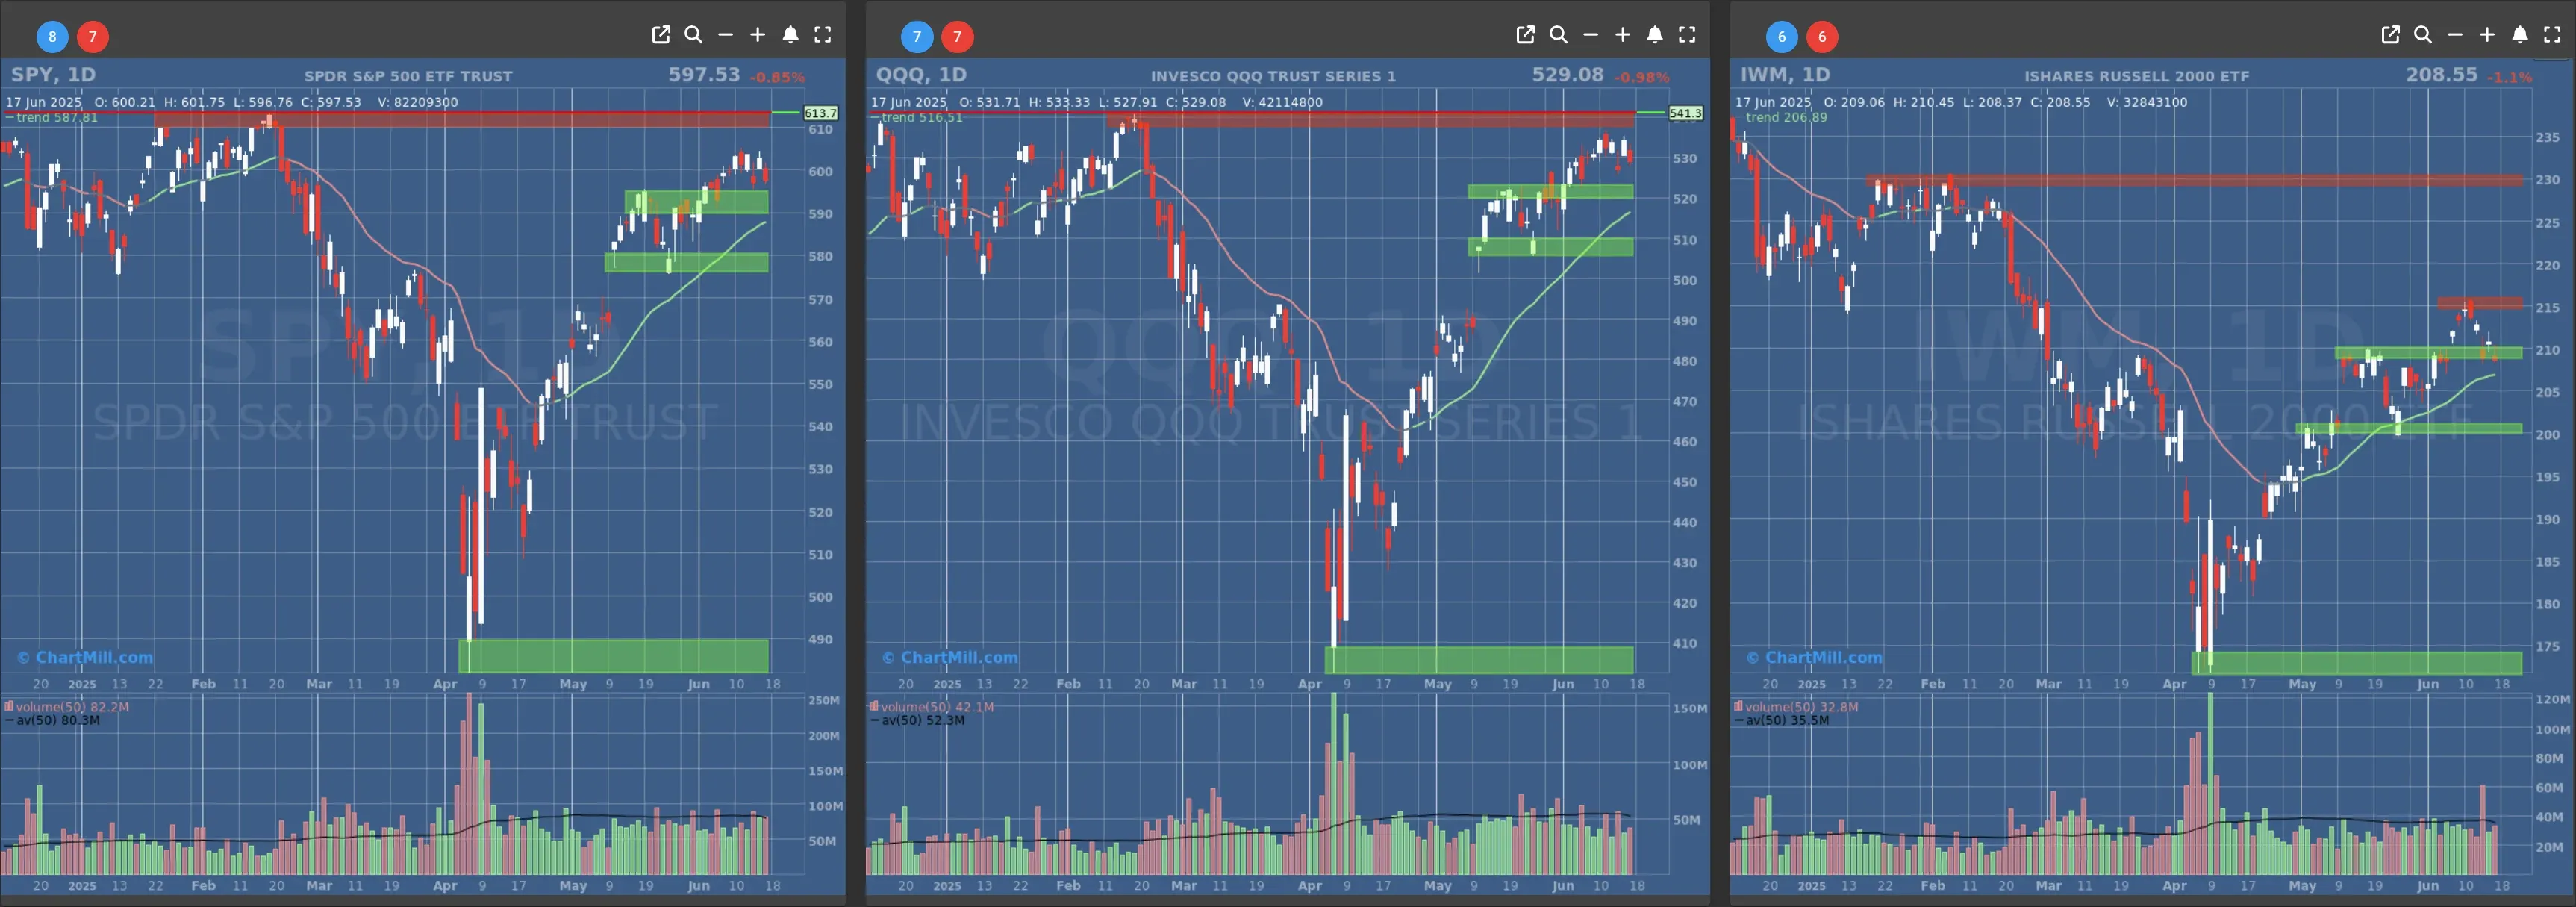
- Short-Term Trend: Bullish (no change)
- Next Support at $580
- Next Resistance at $610
- Volume: Below Average (50)
- Pattern: Down Day
- Short-Term Trend: Bullish (no change)
- Next Support at $520
- Next Resistance at $540
- Volume: At Average (50)
- Pattern: Down Day
- Short-Term Trend: Bullish (no change)
- Next Support at $210 & $205
- Next Resistance at $215 & $230
- Volume: At Average (50)
- Pattern: Doji Candle, at Support
Long Term Trend
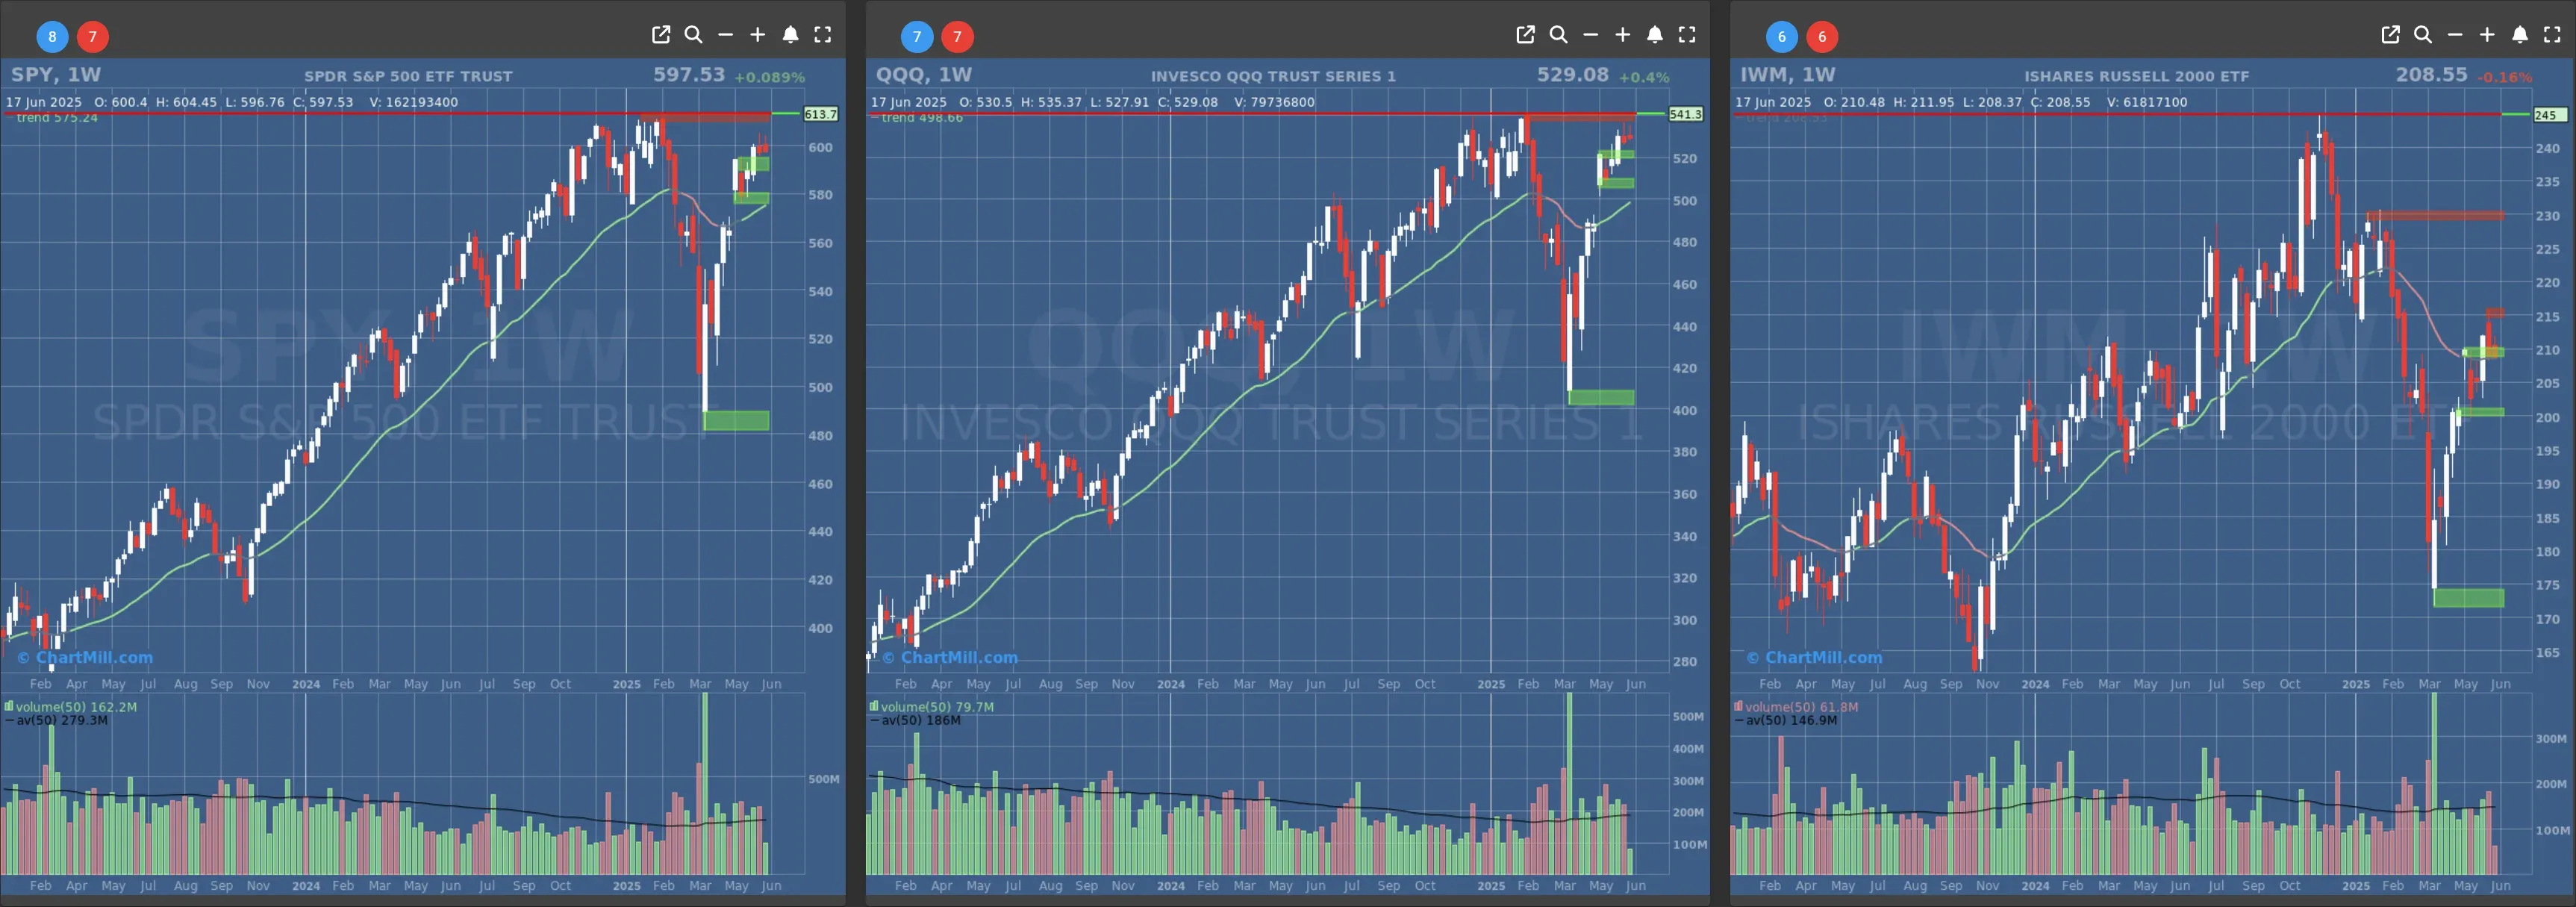
- Long-Term Trend: Positive (no change)
- Long-Term Trend: Positive (no change)
- Long-Term Trend: Neutral (changed from positive) - not confirmed, weekcandle closes on friday
Daily Market Breadth Analysis – June 17, 2025 (After Market Close)

After yesterday’s solid bounce (June 16) where advancers made up 65.9% of the day, today's price action turned on its head and not in a good way.
On June 17, only 26.8% of stocks advanced, while a steep 70.8% declined. This sharp reversal isn’t a total surprise, but it certainly confirms that the prior optimism was on shaky ground.
Context & Continuation
In my previous update (June 16), I noted that while market internals looked much healthier - with a majority of stocks trading above key SMAs (including 73.5% above the 50-day) - this bounce could face trouble unless we saw a follow-through. Well, today the market gave its answer and it wasn’t what bulls hoped for.
The Advancing vs Declining chart above clearly shows the whiplash nature of the past 10 sessions. Strength on June 6, 10, and 16, sharply reversed the next day.
June 13 and 17 now stand out as the worst breadth days, with over 70% of stocks declining and very weak advancing volume.
Key Technical Internals
Despite today’s weakness, some underlying breadth metrics are holding relatively steady:
-
SMA(50)+: Still at 70.5% (just a minor tick down from yesterday's 73.5%), showing that many stocks are still technically in short-term uptrends.
-
SMA(200)+: At 41.6%, also fairly flat, meaning the broader long-term trend has not yet buckled.
However, Advance/Decline over the week dropped from 47.4% to 30.6%, showing deterioration in the medium-term strength. We're slipping again into a pattern of fragility.
Why This Matters
Today's pullback shouldn't be viewed in isolation, it’s part of a larger choppy and indecisive structure. What we’re seeing:
-
Brief optimism (June 6, 10, 16)
-
Followed by sharp setbacks (June 13, 17)
This “two steps forward, two steps back” behavior reflects a market that's directionless but not hopeless. Breadth is not collapsing across the board, but the follow-through just isn’t sticking.
Until we see several consecutive strong-breadth days (like 65%+ advancers), it’s going to be hard to build any real bullish conviction.
Bottom Line
June 17 continues a pattern I flagged yesterday: this market is too twitchy to trust, and rallies are vulnerable to sudden reversals. The fact that short-term SMA participation remains solid is encouraging, but without confirmation in advancing volume and weekly strength, it’s all just talk.
I’ll be watching tomorrow for signs of resilience, or confirmation that we’re slipping deeper into chop. Until then, keep your exposure tight and your watchlists tighter.
Kristoff - Co-founder, ChartMill
Next to read: Market Monitor News, June 18