

(All data & visualisations by ChartMill.com)
Daily Market Trend Analysis – October 29, 2025 (After Market Close)
Hanging Man Candlestick Patterns for SPY & QQQ
Short Term Trend
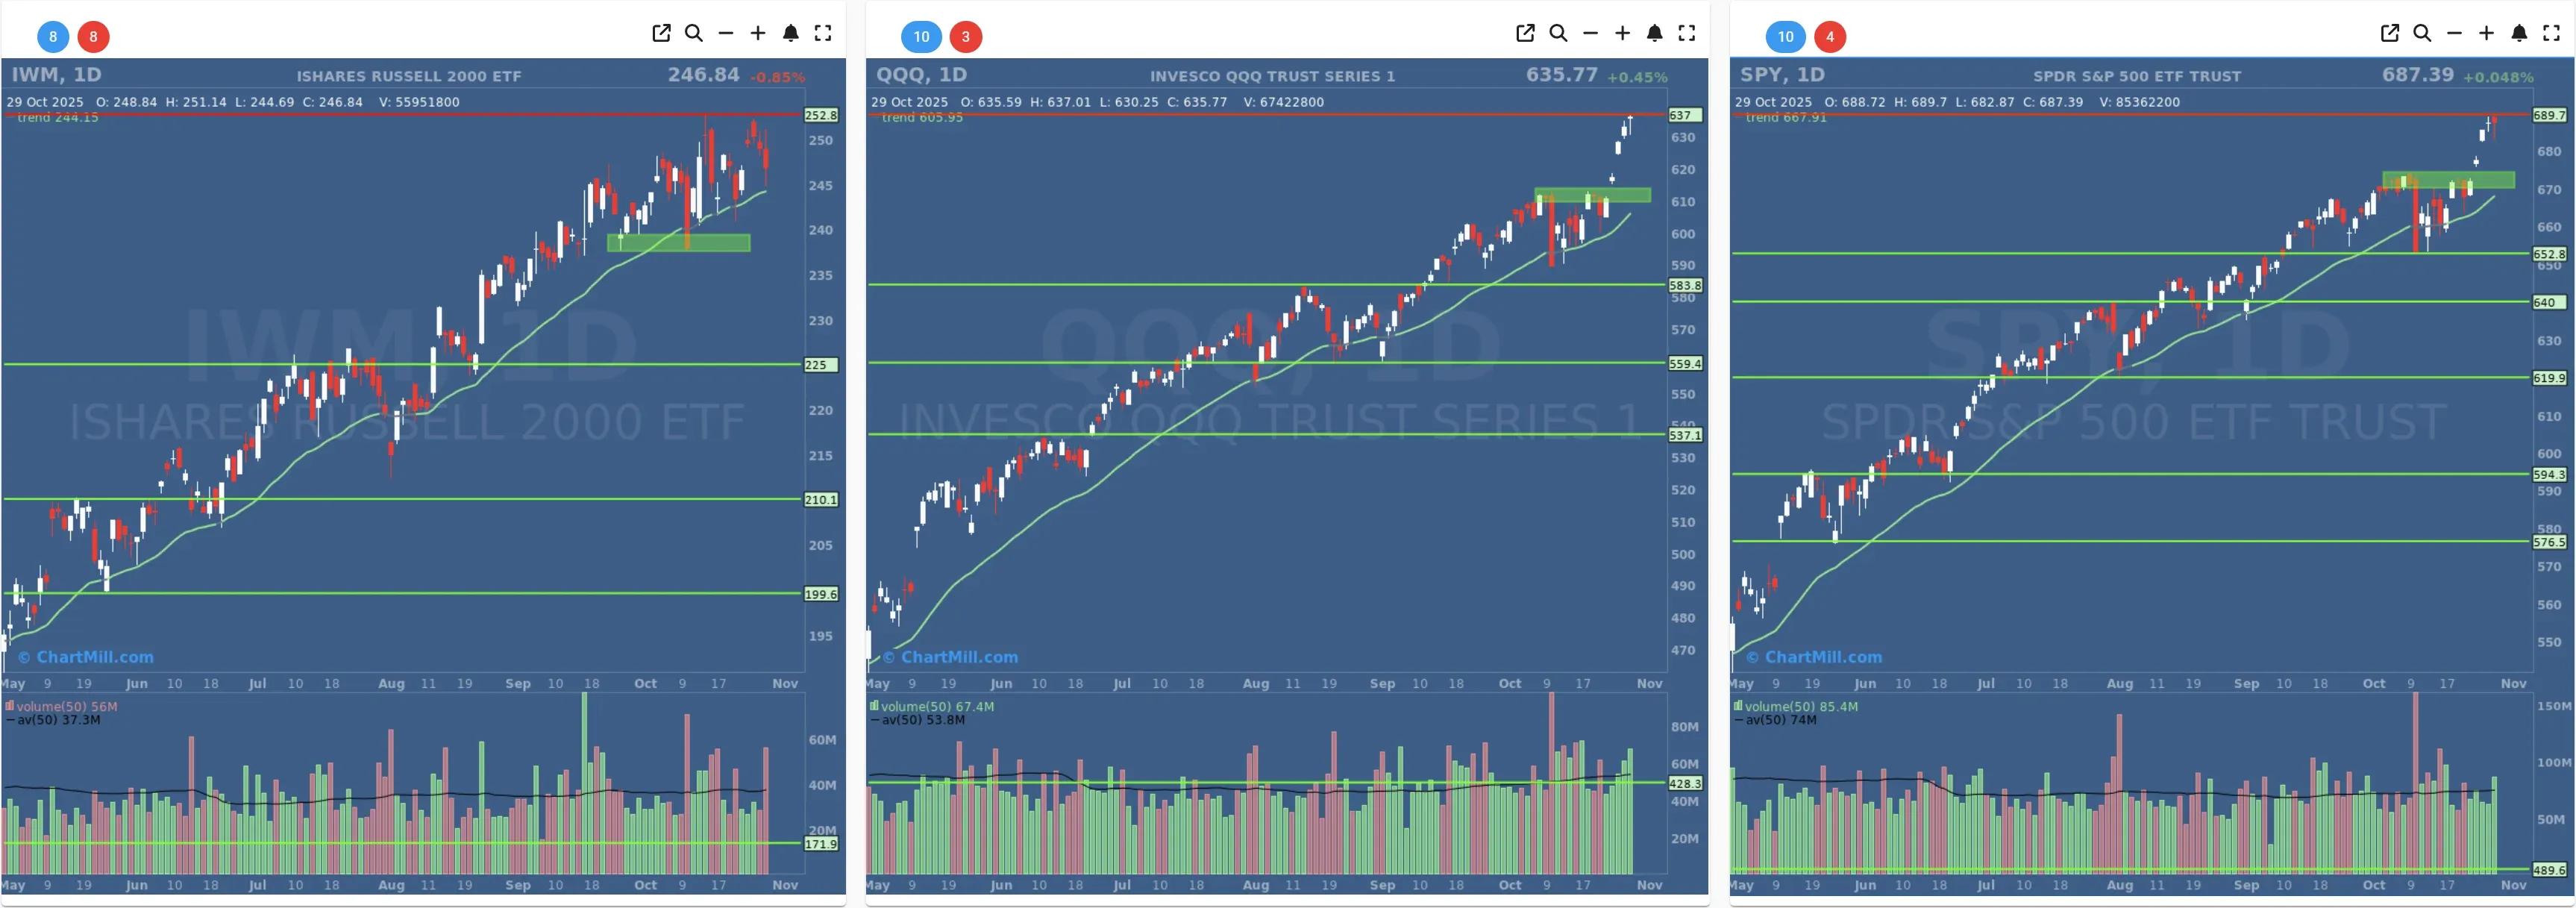
- Short-Term Trend: Positive (No Change)
- Next Support at $673
- Next Resistance $690
- Volume: Slightly Above Average (50)
- Pattern: Down Day - New Intraday All Time High - Hanging Man Candle
- Short-Term Trend: Positive (No Change)
- Next Support at $613
- Next Resistance /
- Volume: Above Average (50)
- Pattern: Up Day - New All Time High - Hanging Man Candle
- Short-Term Trend: Positive (No Change)
- Next Support at $235
- Next Resistance at $252
- Volume: Far above Average (50)
- Pattern: Down Day - Wide Range Candle
Long Term Trend

- Long-Term Trend: Positive (no change)
- Long-Term Trend: Positive (no change)
- Long-Term Trend: Positive (no change)
Daily Market Breadth Analysis – October 29, 2025 (After Market Close)

Market breadth took a hit on Wednesday.
The percentage of advancing stocks dropped to 27.7%, while declining stocks surged to 70.1%, marking the most bearish distribution day since October 22nd. This sharp shift underscores a renewed dominance of sellers.
Short-Term Breadth Momentum Turns Lower
The Adv 4% Day reading fell to 3.2%, while Decl 4% Day increased to 7.2%, both moving in unfavorable directions. These levels suggest little leadership among strong gainers and a growing number of outsized losers. While not at extreme levels yet, this shift reflects weakening momentum beneath the surface.
Additionally, the percentage of stocks trading above their short-term moving averages (20/50-day SMAs) declined across the board:
-
SMA(20)+: Dropped from 58.1% → 47.7%
-
SMA(50)+: 58.1% → 51.7%
The percentage above the 100- and 200-day SMAs also weakened, though less severely, suggesting early signs of breakdowns in longer-term trends as well.
Fewer New Highs, More New Lows
New Highs (NH) fell to just 9, down from 10 and 11.5 on the two prior sessions, while New Lows (NL) rose to 3.4% of stocks, the highest since April 11, 2025. This shift again reflects increasing pressure, particularly in weaker names.
Medium-Term Indicators Are Rolling Over
While the Adv Week reading held up at 50.8%, the Decl Week moved up to 48.1%, nearly reaching parity. Over a monthly timeframe, Adv Month slipped to 49.1%, and Decl Month ticked higher to 50.4%, marking the first time since October 22 that monthly decliners have outnumbered advancers.
The number of PP (percentage of stocks making a pocket pivot) also declined to 24.8%, reflecting the loss of upward momentum and fewer breakout setups succeeding.
Three-Month Trend Shows Caution
Longer-term participation remains relatively stable:
-
Adv 3 Month: 68.1%
-
Decl 3 Month: 31%
-
Adv 25% 3 Month: 17.7% (vs. 18.2% prior)
-
Decl 25% 3 Month: 6% (vs. 5.5%)
While still favorable overall, these numbers are starting to tick down gradually, possibly signaling a broader weakening of underlying strength if the trend continues.
Conclusion:
The October 29 data reflect a renewed surge in selling pressure and waning bullish participation. Despite a brief reprieve earlier in the week, the breadth metrics indicate that short-term momentum is deteriorating. The percentage of advancing stocks, strength above key moving averages, and breakout participation have all declined.
While the longer-term trend remains somewhat intact, cracks are forming.
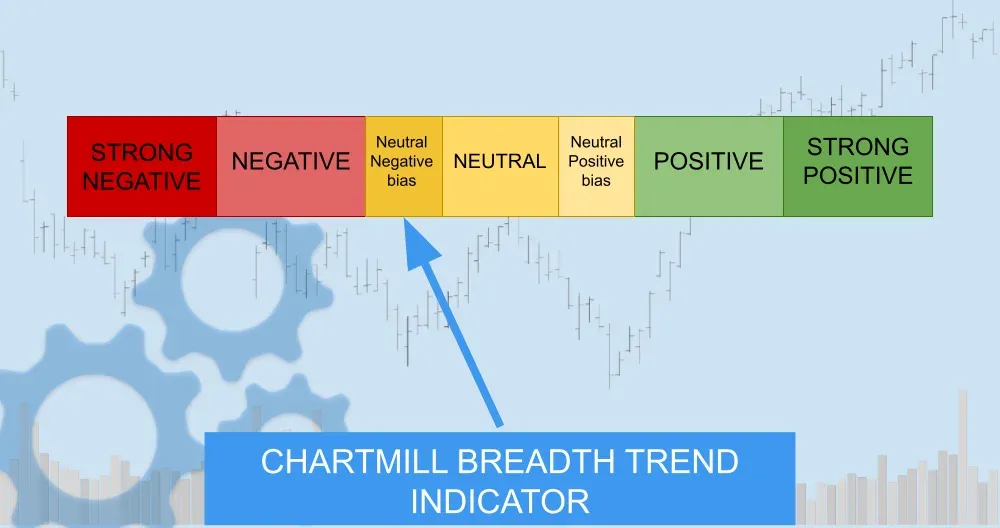
Breadth Trend Rating: Neutral with a Negative Bias
If selling persists into the next session and medium-term indicators deteriorate further, a downgrade to fully negative could follow.
Kristoff - ChartMill
Next to read: Nvidia Tops $5 Trillion as Fed Dampens Wall Street’s Mood