

(All data & visualisations by ChartMill.com)
Daily Market Trend Analysis – October 30, 2025 (After Market Close)
Short Term Trend
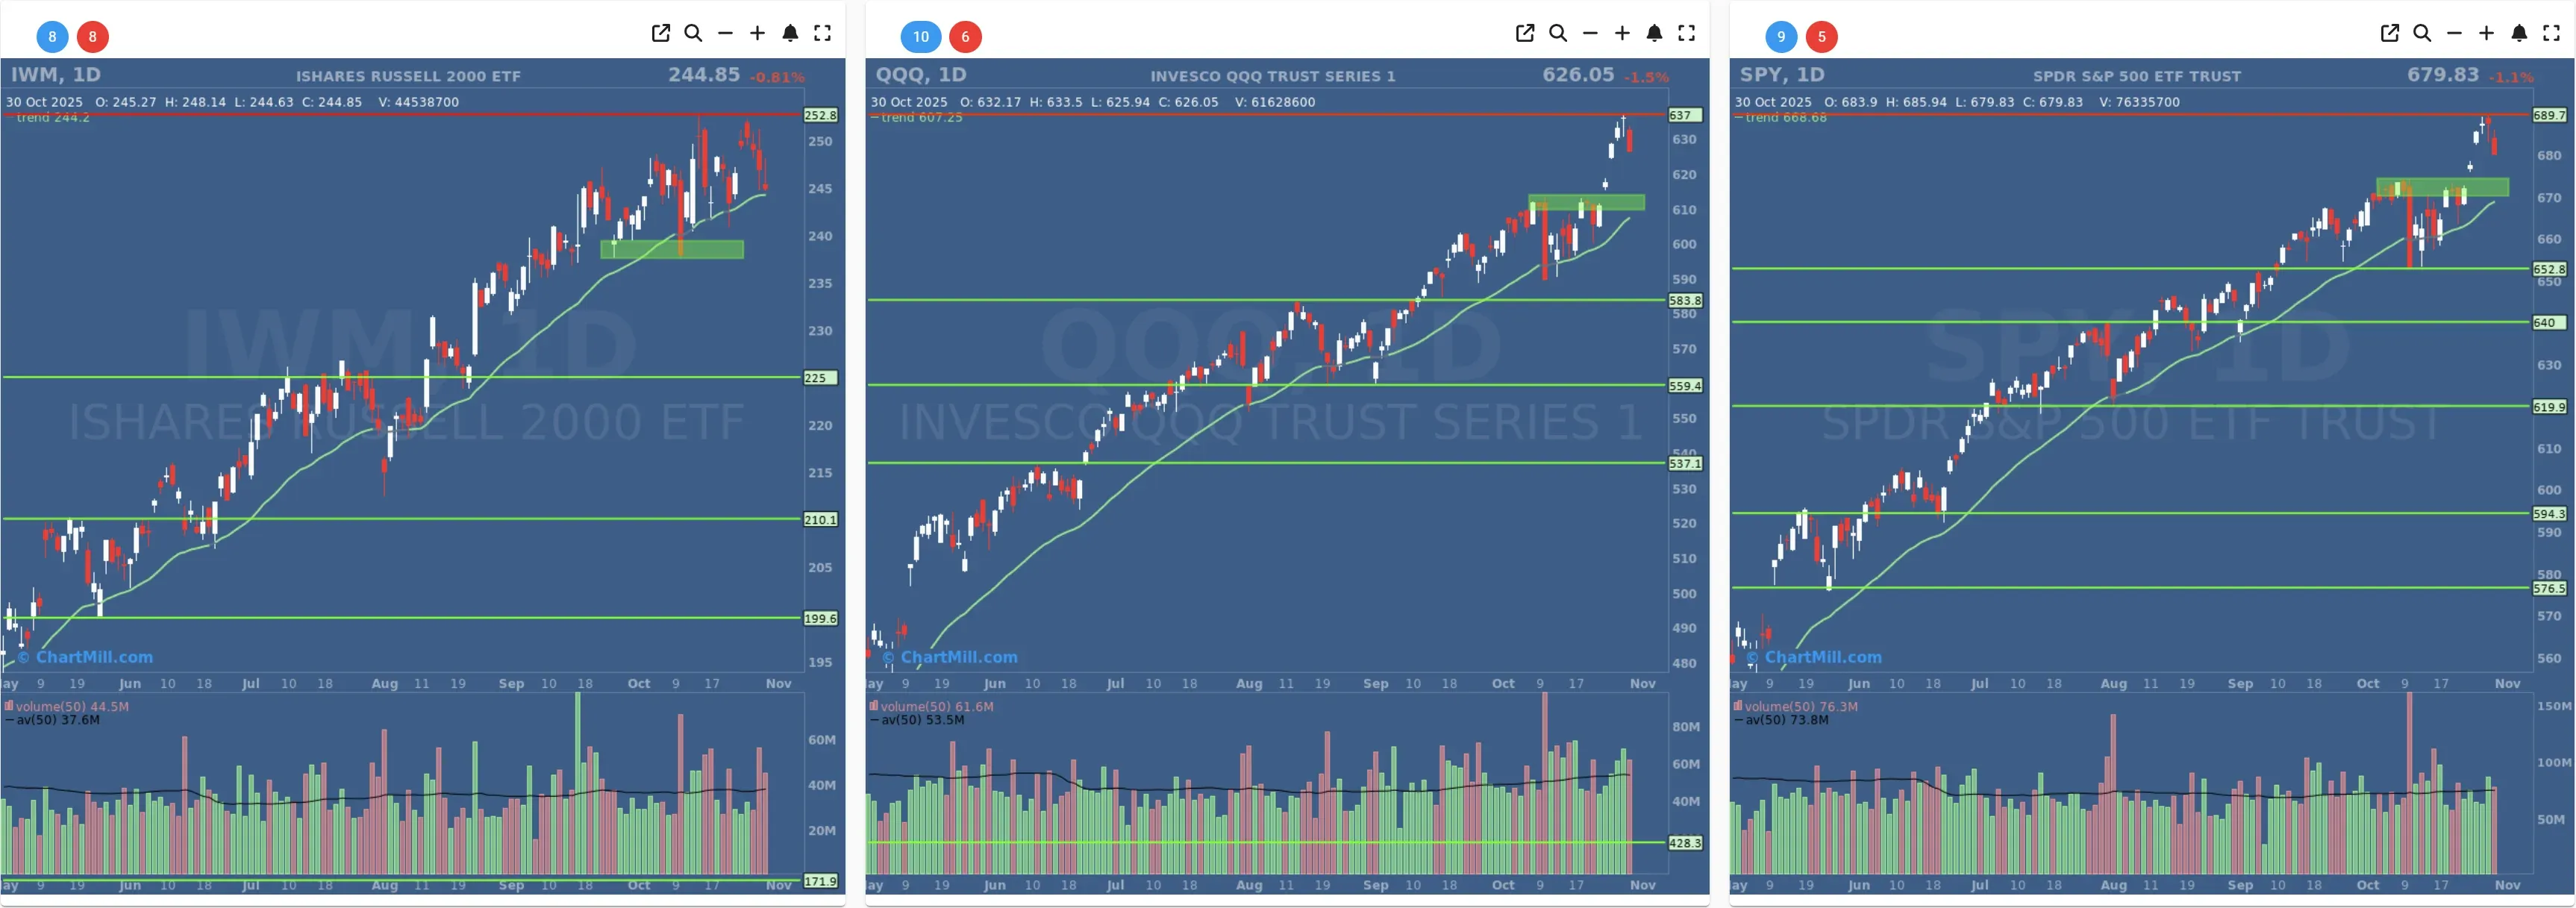
- Short-Term Trend: Positive (No Change)
- Next Support at $673
- Next Resistance $690
- Volume: At Average (50)
- Pattern: Down Day - Gap Down - Weak Candle Close - Three Day Reversal Pattern
- Short-Term Trend: Positive (No Change)
- Next Support at $613
- Next Resistance /
- Volume: Slightly Above Average (50)
- Pattern: Down Day - Gap Down - Weak Candle Close - - Three Day Reversal Pattern
- Short-Term Trend: Positive (No Change)
- Next Support at $235
- Next Resistance at $252
- Volume: At Average (50)
- Pattern: Down Day - Gap Down - Inverted Hammer Candle - Weak Candle Close
Long Term Trend
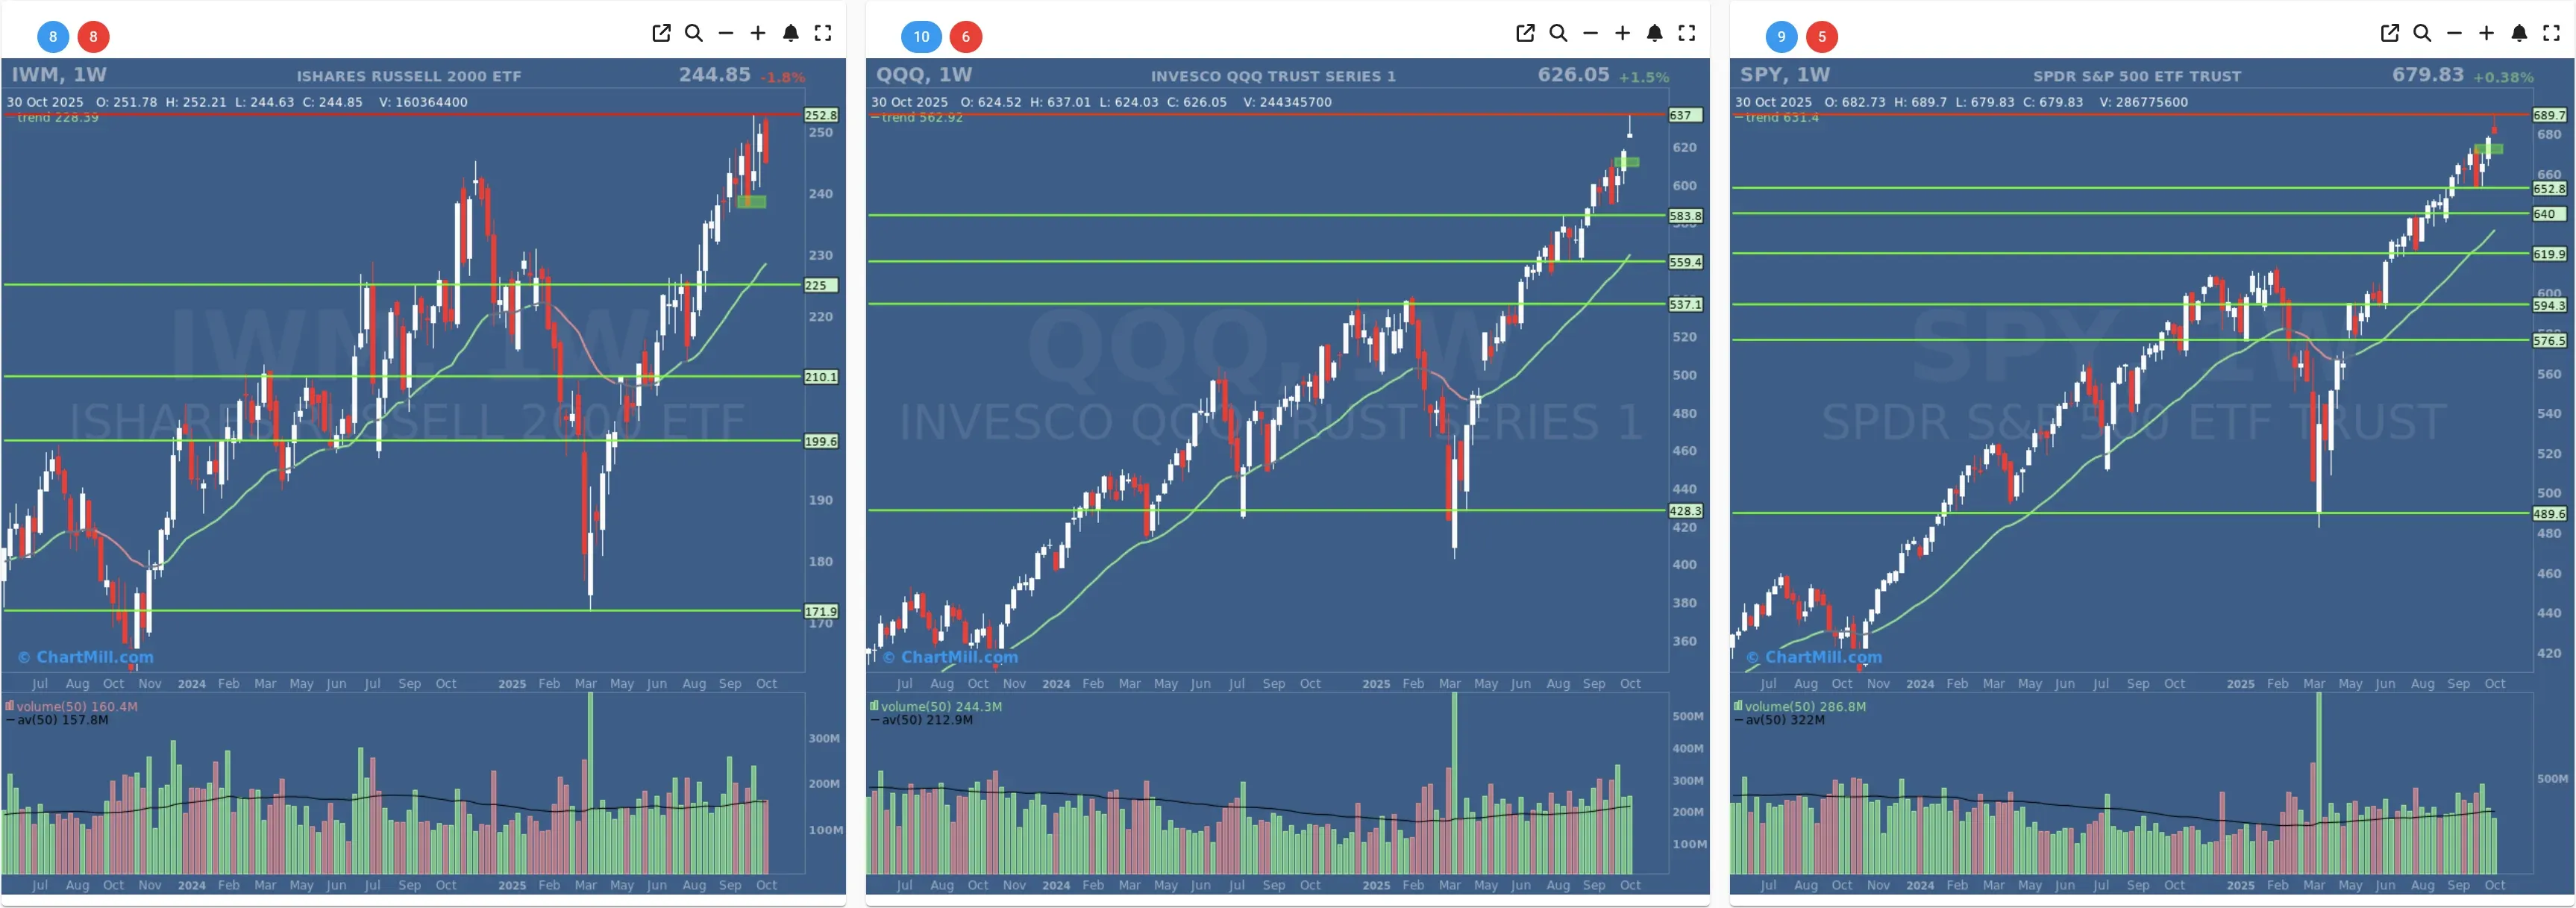
- Long-Term Trend: Positive (no change)
- Long-Term Trend: Positive (no change)
- Long-Term Trend: Positive (no change)
Daily Market Breadth Analysis – October 30, 2025 (After Market Close)
Following a short-lived recovery late last week, market breadth deteriorated again on Thursday, October 30, as declining stocks overwhelmed advancers. Participation across key timeframes is fading, and short-term momentum metrics are turning clearly negative.

Thursday’s session marked another deterioration in market breadth. The percentage of advancing stocks climbed slightly to 29.7%, up from 27.7% the day before, but still reflects extremely weak participation. Meanwhile, 67.8% of stocks declined, slightly better than Wednesday’s 70.1%, but still firmly in bearish territory.
High-magnitude moves remained skewed to the downside, with 5.6% of stocks falling more than 4%, compared to just 2.8% rising more than 4%. These ratios suggest that while the pace of deterioration may have slightly moderated, the underlying weakness in the market remains unresolved.
Fewer Stocks Holding Key Moving Averages
The weakness extended across technical support levels:
-
SMA(20)+ fell to 40%, down from 47.7% the day prior and from over 63% earlier this week.
-
SMA(50)+, SMA(100)+, and SMA(200)+ all saw minor declines, continuing the soft downtrend from last Friday’s highs.
These readings confirm that more stocks are slipping below their short- and intermediate-term trendlines.
New Highs Collapse; New Lows Creep Higher
The percentage of stocks hitting new highs dropped to just 2.5%, down from 9% a day earlier and 11.5% on Monday. Meanwhile, New Lows (3.6%) edged slightly higher, a concerning sign of deepening weakness under the surface.
Weekly & Monthly Breadth Metrics Roll Over
Participation over longer horizons is also turning lower:
-
Adv Week: 36.4%, down from 50.8%
-
Adv Month: 44.2%, falling from a peak of 58.7% just three days ago
-
Adv 3 Month: 66.6%, steadily slipping from the 72.2% high on Monday
This consistent rollover across timeframes signals fading follow-through and growing risk aversion among investors.
Context and Momentum Shift
Last week (Oct 23–24), breadth readings were relatively strong, with over 65% of stocks advancing and more than 60% above key moving averages. However, that rally lost momentum quickly. Since Monday, participation has deteriorated sharply, and Thursday's readings confirm that the market is failing to regain footing.
Crucially, this weakness occurred prior to the release of major earnings and macroeconomic data, suggesting the moves were driven more by internal technical factors and sentiment than by external catalysts.
Breadth Trend Rating: Neutral with a Negative Bias
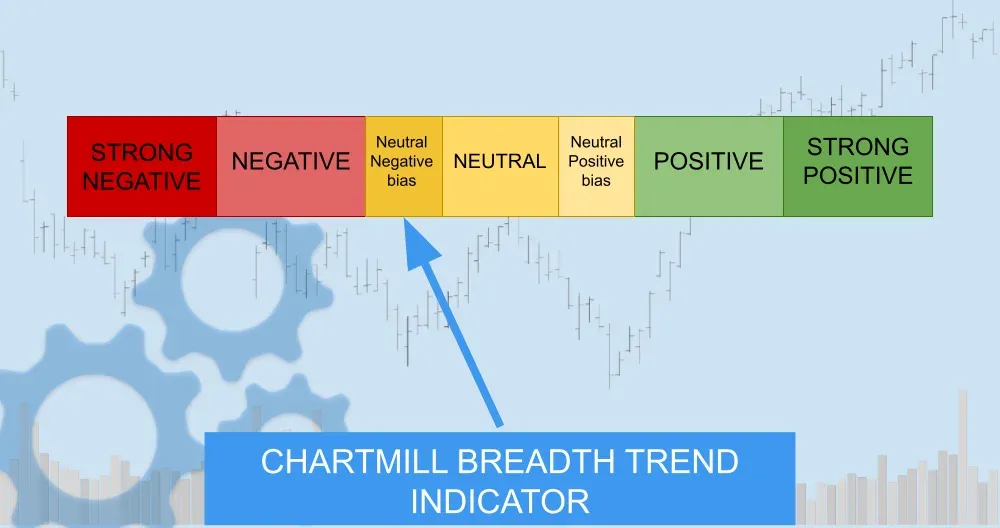
After a failed attempt to stabilize earlier in the week, the breadth trend has returned to a weakening state. While not as extreme as October 22–23 levels, the current data point to an erosion of market participation and momentum — leaving the overall outlook fragile and biased to the downside.
Kristoff - ChartMill
Next to read: Meta Meltdown Sends Nasdaq Tumbling as Apple Shines After Hours