

(All data & visualisations by ChartMill.com)
Daily Market Trend Analysis – October 9, 2025 (After Market Close)
Hesitant financial markets...
Short Term Trend
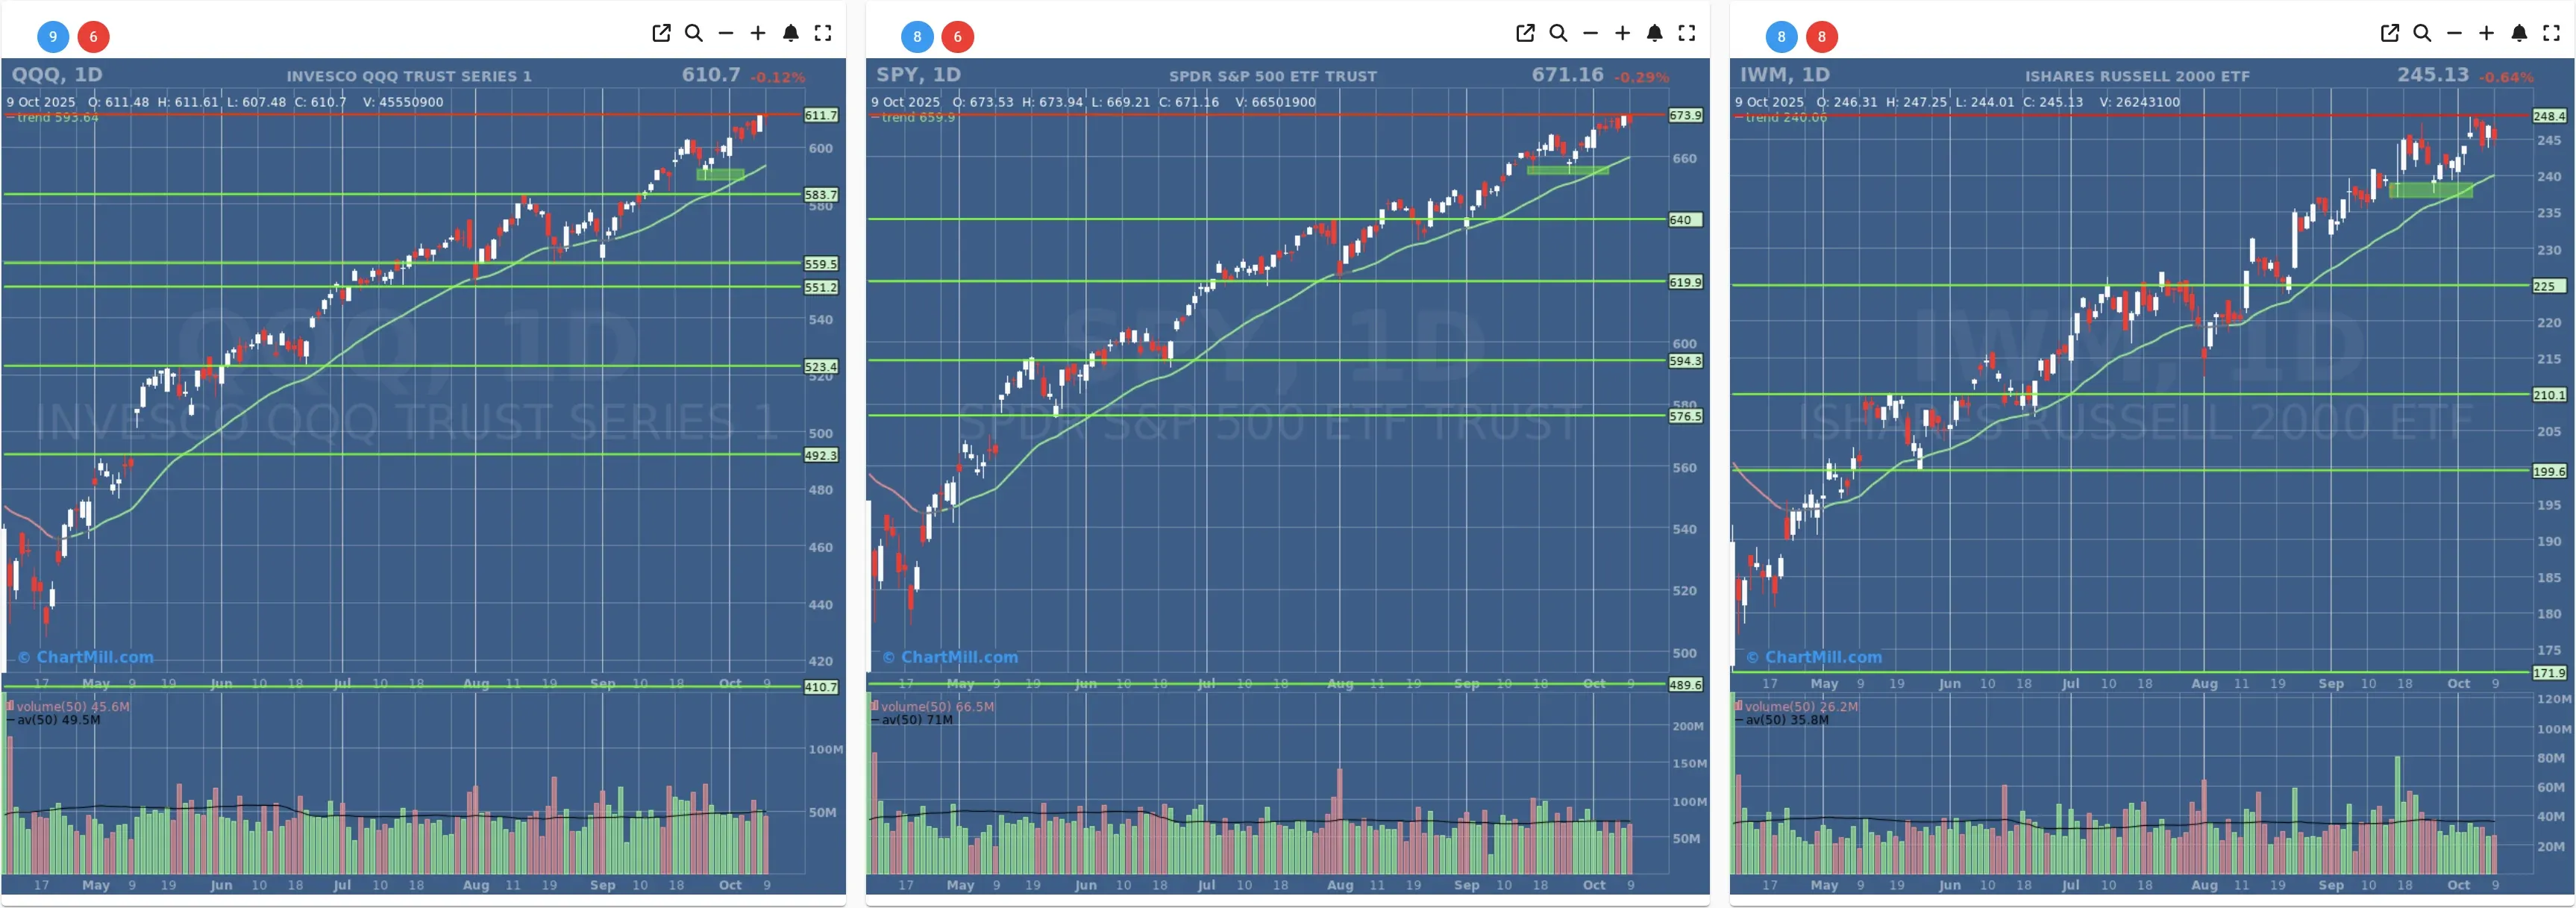
- Short-Term Trend: Positive (no change)
- Next Support at $666 - $660
- Next Resistance at /
- Volume: At Average (50)
- Pattern: Down Day - New Intraday High
- Short-Term Trend: Positive (no change)
- Next Support at $600
- Next Resistance at /
- Volume: At Average (50)
- Pattern: Down Day - New Intraday High - Hanging Man Candle
- Short-Term Trend: Positive (no change)
- Next Support at $235
- Next Resistance at $247
- Volume: Well Below Average (50)
- Pattern: Down Day - Range Becomes Narrower
Long Term Trend
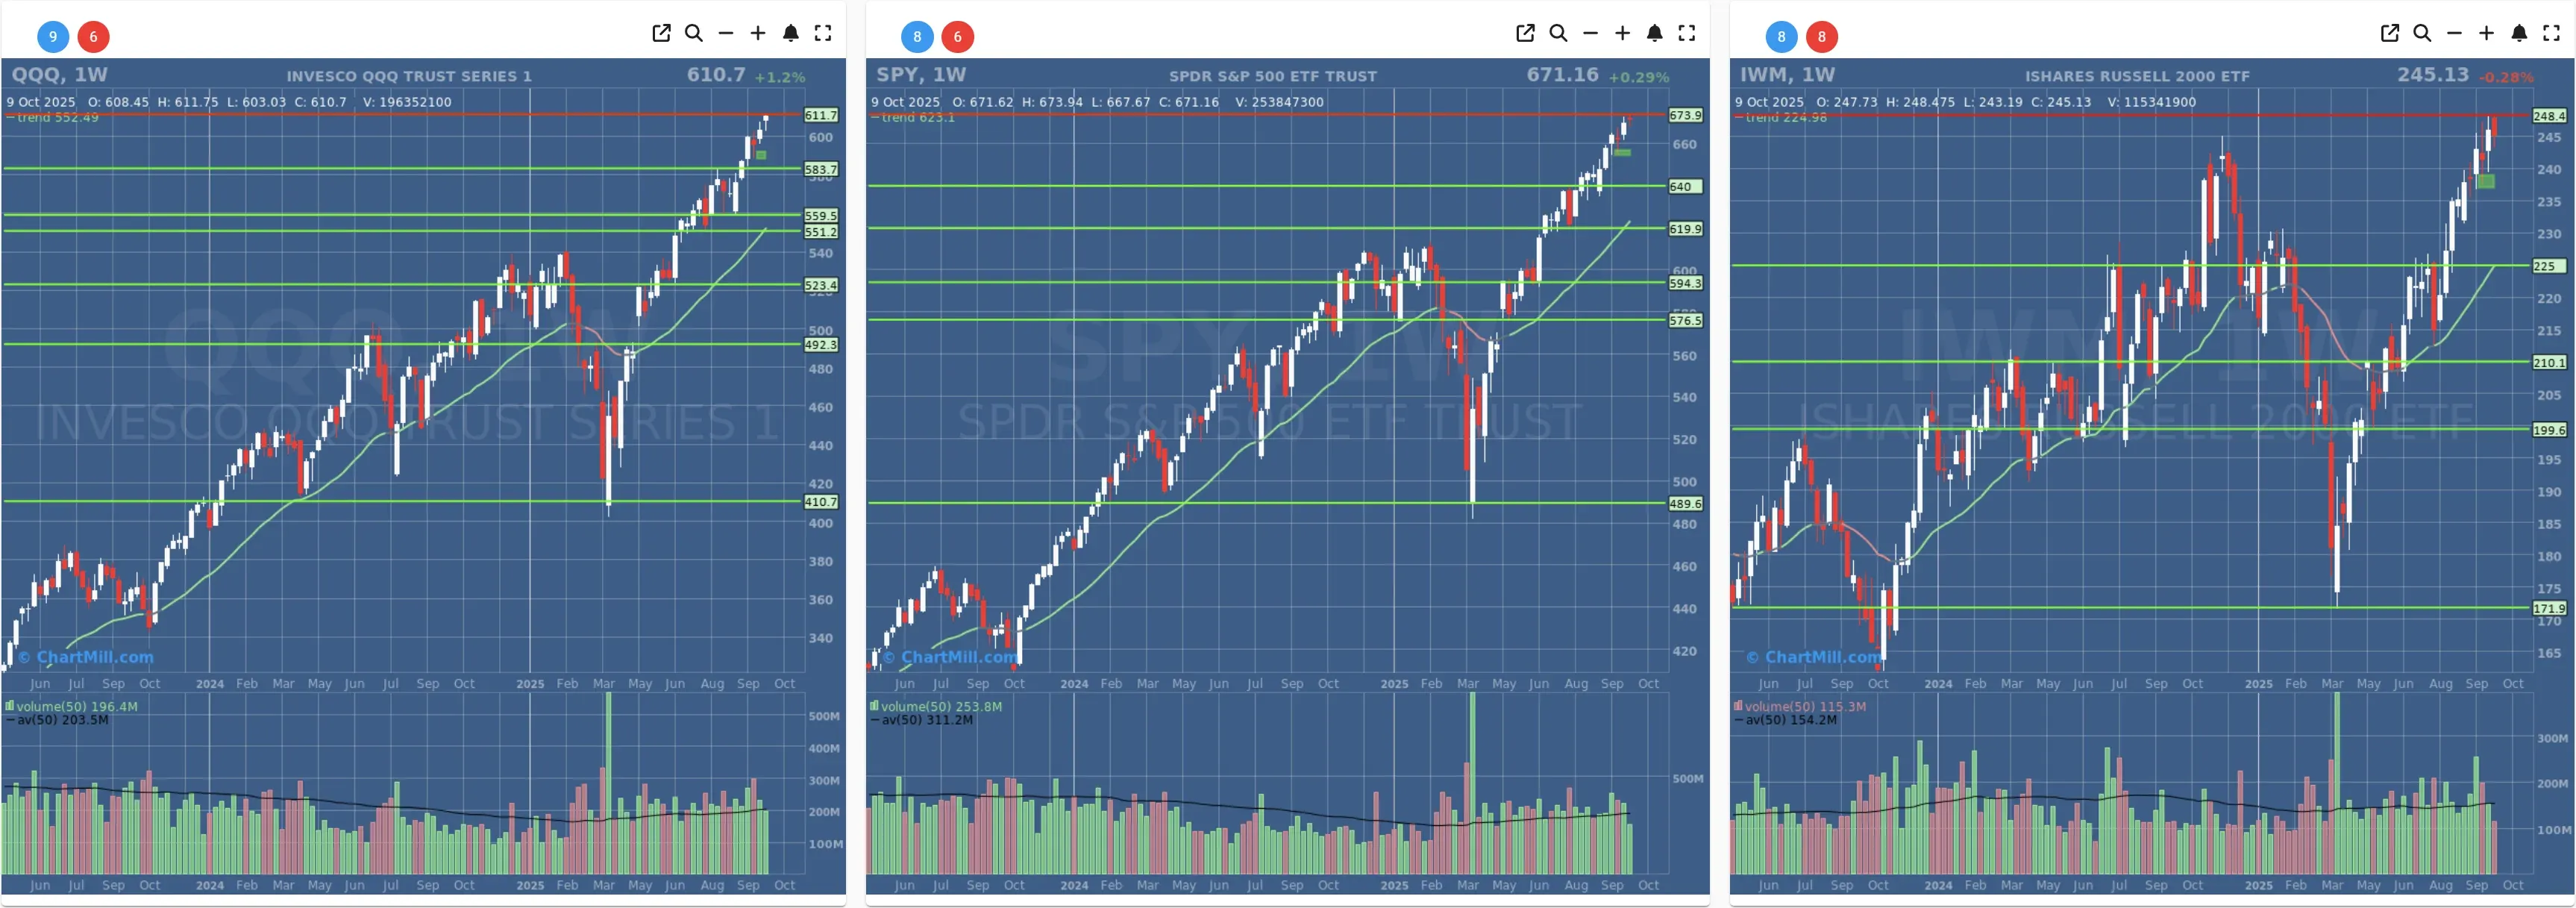
- Long-Term Trend: Positive (no change)
- Long-Term Trend: Positive (no change)
- Long-Term Trend: Positive (no change)
Daily Market Breadth Analysis – October 9, 2025 (After Market Close)
After Wednesday’s strong rebound, Thursday’s session saw a broad-based retreat across U.S. equities. Most of the short-term breadth indicators turned red again, signaling that the recent recovery attempt has faltered.
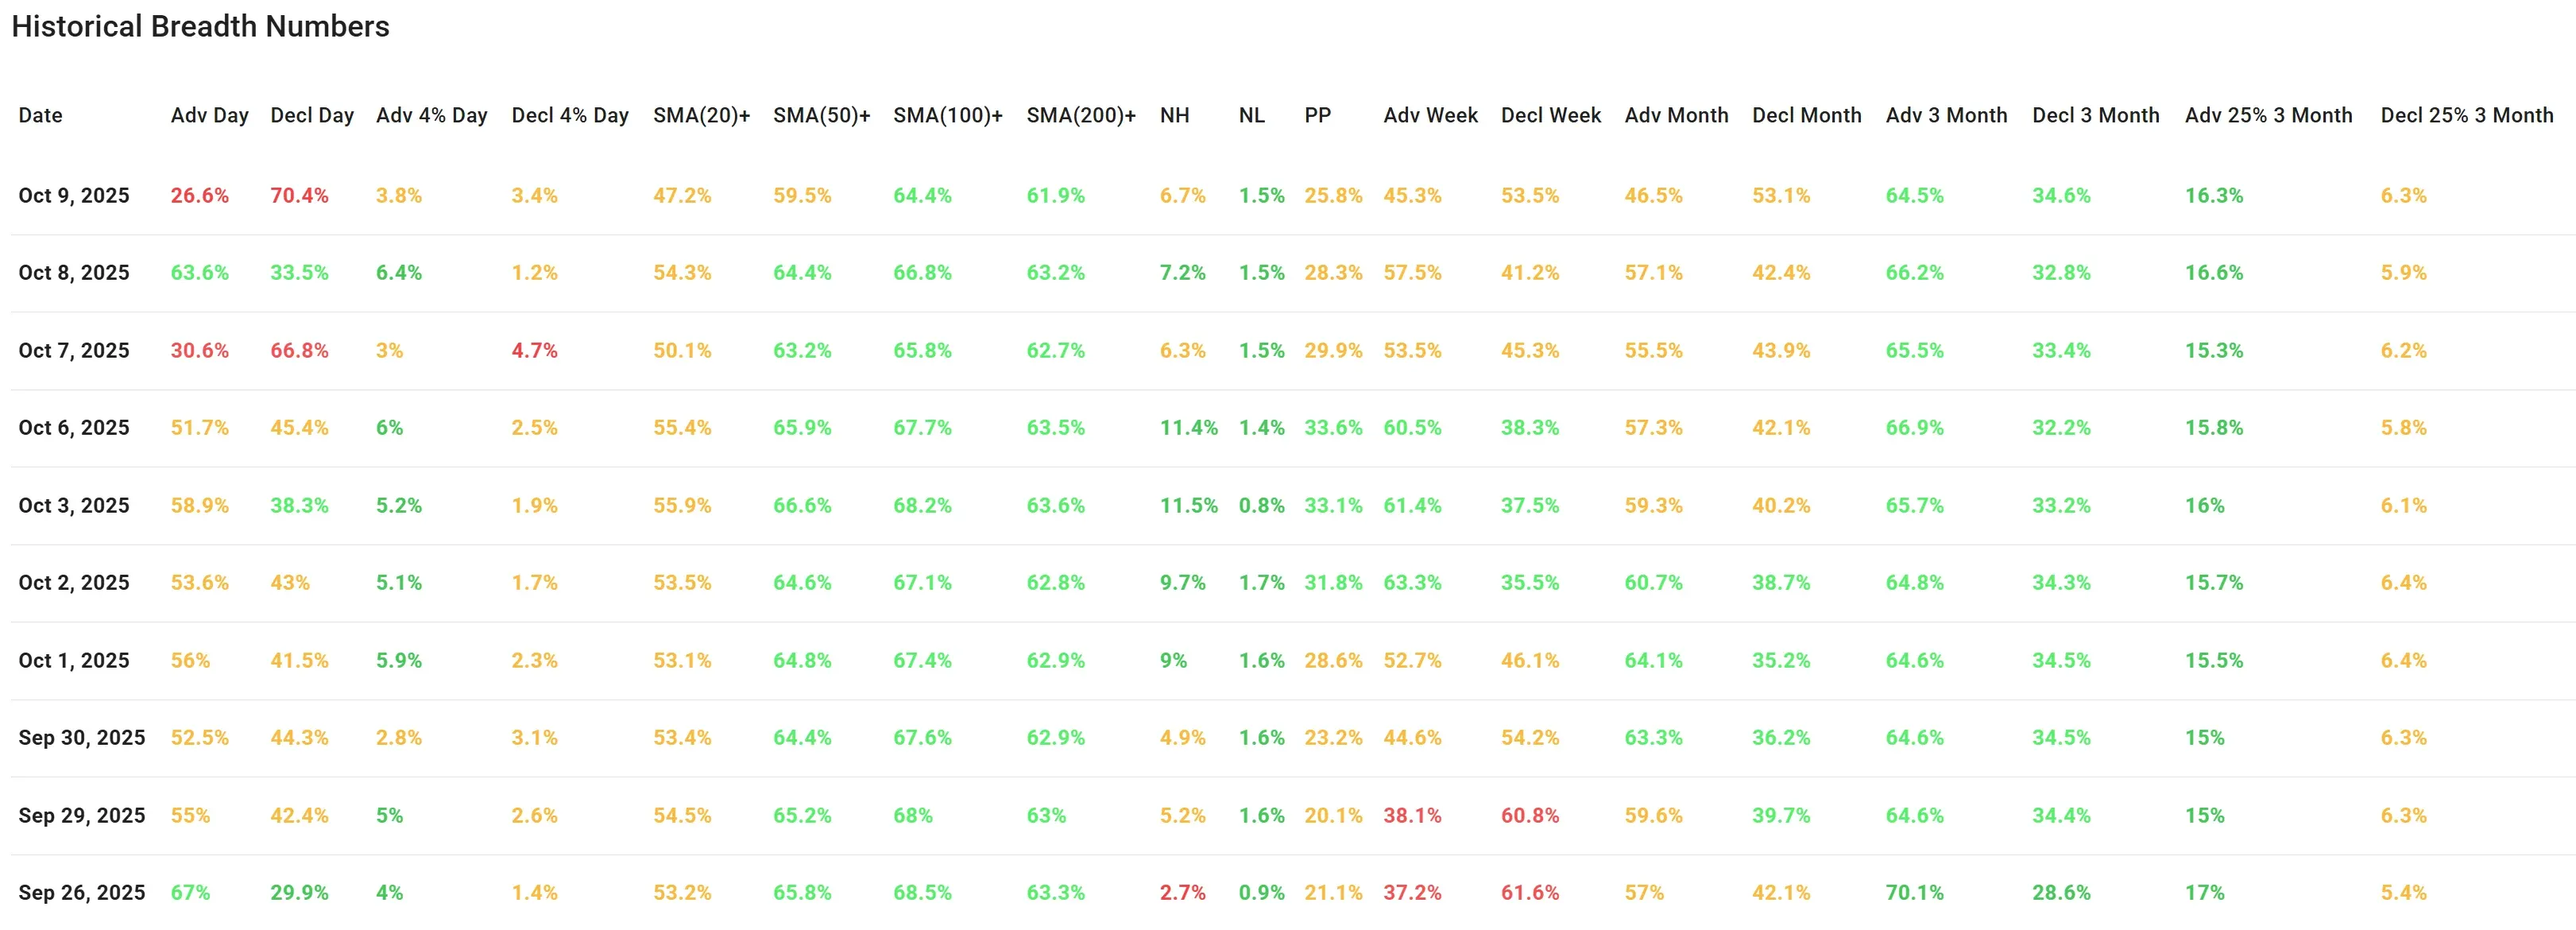
The market breadth data for Thursday shows a pronounced reversal following the encouraging rebound seen on Wednesday. Only 26.6% of stocks advanced, while 70.4% declined, nearly a mirror image of the prior session’s readings (63.6% advancers vs. 33.5% decliners).
This abrupt shift indicates that the positive momentum from midweek failed to carry through, with sellers regaining control across most sectors.
Short-Term Weakness Resurfaces
The proportion of stocks gaining more than 4% dropped sharply from 6.4% to 3.8%, while those falling more than 4% increased from 1.2% to 3.4%. This widening gap highlights renewed selling pressure, typical of a market facing resistance after a short-lived rebound.
The percentage of stocks above their 20-day SMA fell back from 54.3% to 47.2%, a notable decline after three sessions of improvement. Similarly, the 50-day SMA participation rate slipped to 59.5%, down from 64.4%.
Despite this pullback, longer-term metrics such as the 100- and 200-day SMA readings remain relatively steady (64.4% and 61.9%, respectively), showing that the broader structure remains intact for now.
Momentum and New Highs/ Lows
New highs dropped slightly from 7.2% to 6.7%, while new lows held steady near 1.5%. This mild deterioration confirms the short-term loss of breadth momentum without signaling a deeper breakdown yet.
Weekly and Monthly Breadth
The weekly metrics weakened moderately, with advancing stocks for the week falling from 57.5% to 45.3%. However, monthly breadth indicators remain balanced: 46.5% advancers vs. 53.1% decliners. Over a three-month horizon, the market still maintains a positive skew (64.5% advancers vs. 34.6% decliners), suggesting that the current weakness remains primarily a short-term phenomenon.
Context and Outlook
Thursday’s reversal appears to be a typical reaction within a broader consolidation phase rather than the start of a new downtrend. Given the stability of medium- and long-term averages, the market’s underlying structure is still neutral, though short-term momentum has clearly turned down again.
Friday’s session will be crucial to determine whether Thursday’s setback represents a brief pause or the beginning of renewed selling pressure.
Breadth Trend Rating: Neutral with a Negative Bias

The rebound momentum from Wednesday quickly faded, pushing short-term metrics back into negative territory. With medium- and long-term breadth still resilient, the overall tone remains corrective rather than outright bearish.
Kristoff - ChartMill
Next to read: Wall Street Pulls Back as Earnings Season Kicks Off; PepsiCo, Delta, and Costco Defy the Trend