

(All data & visualisations by ChartMill.com)
Daily Market Trend Analysis – October 8, 2025 (After Market Close)
New Highs for SPY and QQQ
Short Term Trend
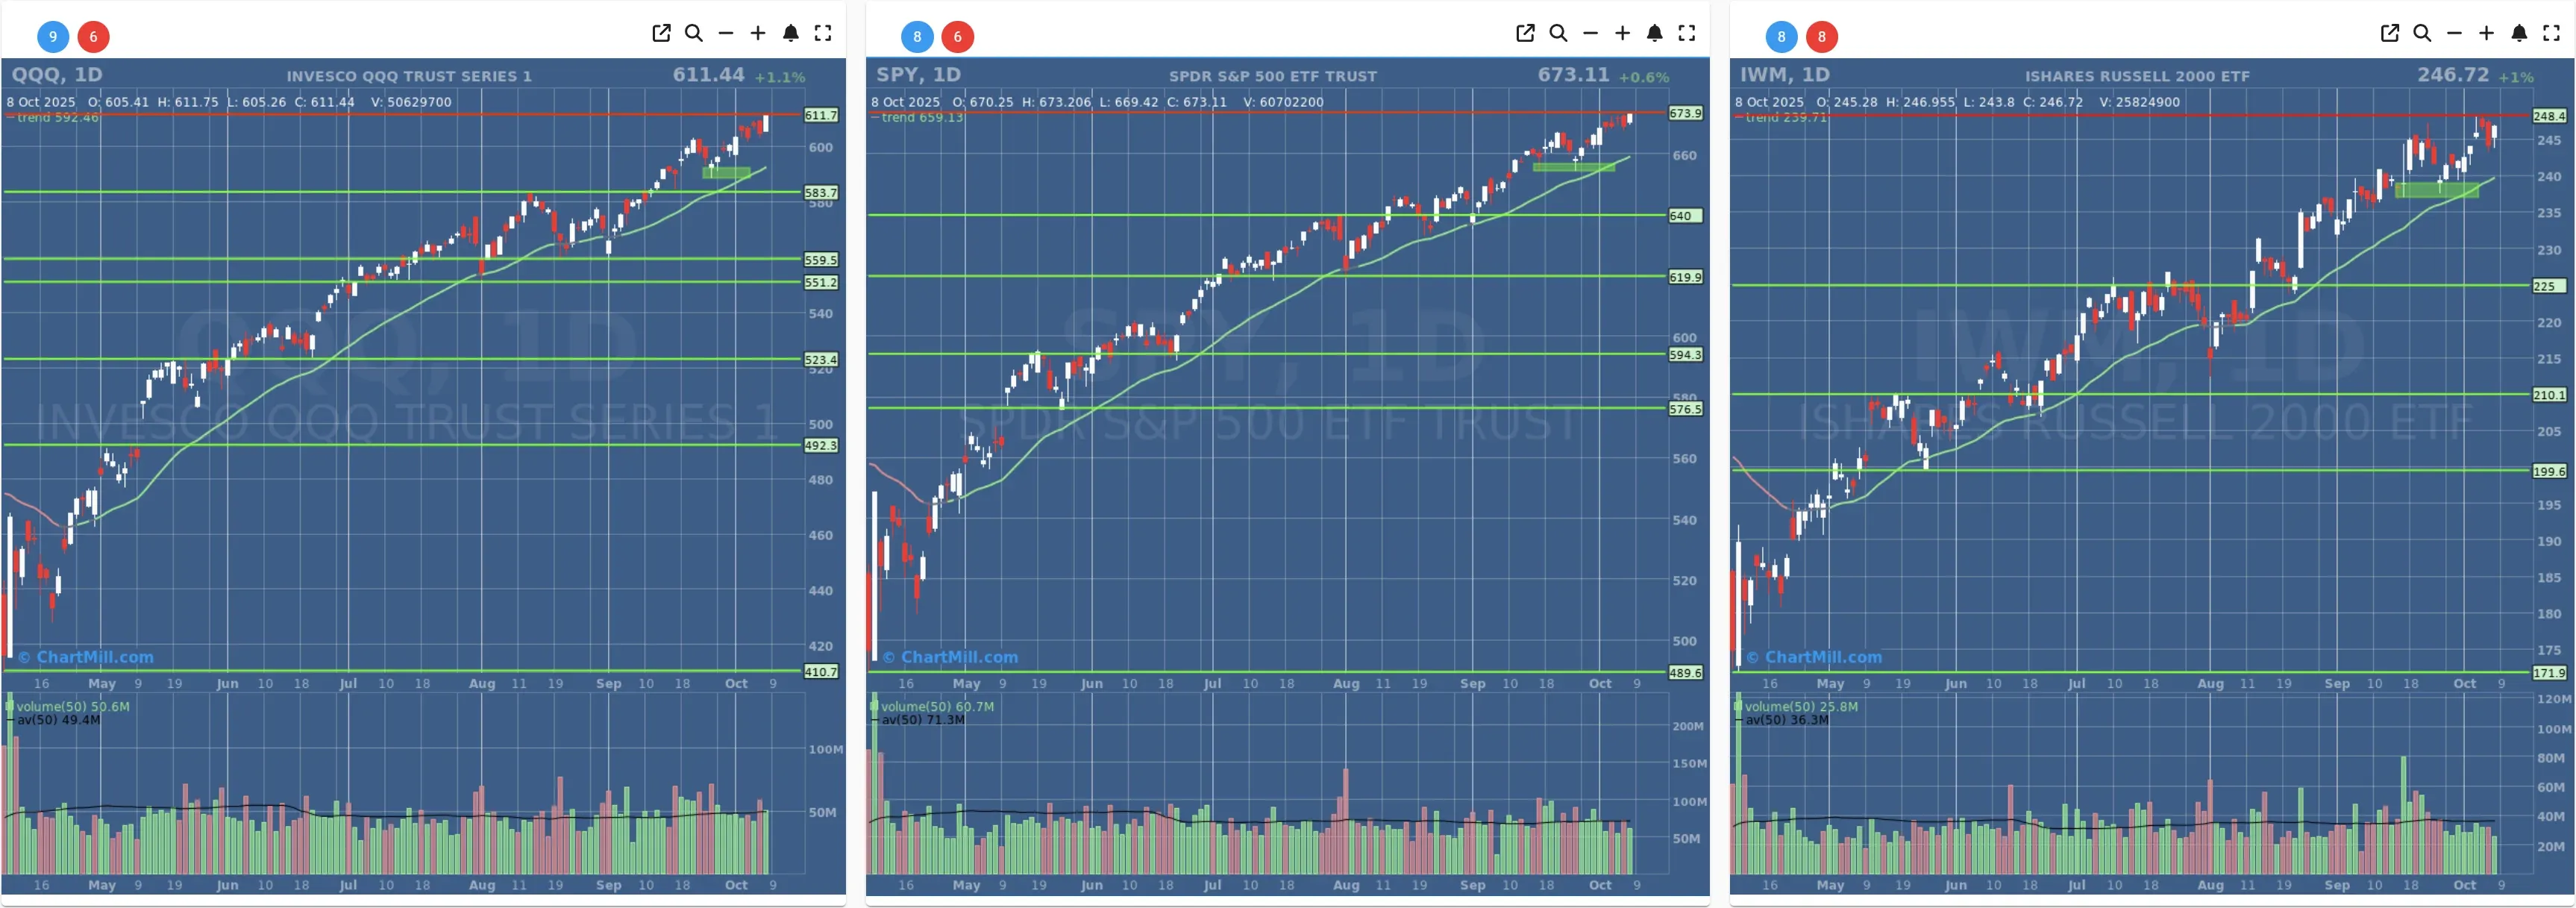
- Short-Term Trend: Positive (no change)
- Next Support at $666 - $660
- Next Resistance at /
- Volume: At Average (50)
- Pattern: Up Day - New High - Strong Candle Close
- Short-Term Trend: Positive (no change)
- Next Support at $600
- Next Resistance at /
- Volume: Slightly Below than Average (50)
- Pattern: Up Day - New High - Strong Candle Close
- Short-Term Trend: Positive (no change)
- Next Support at $235
- Next Resistance at $247
- Volume: Well Below than Average (50)
- Pattern: Up Day - Inside Day Candle
Long Term Trend
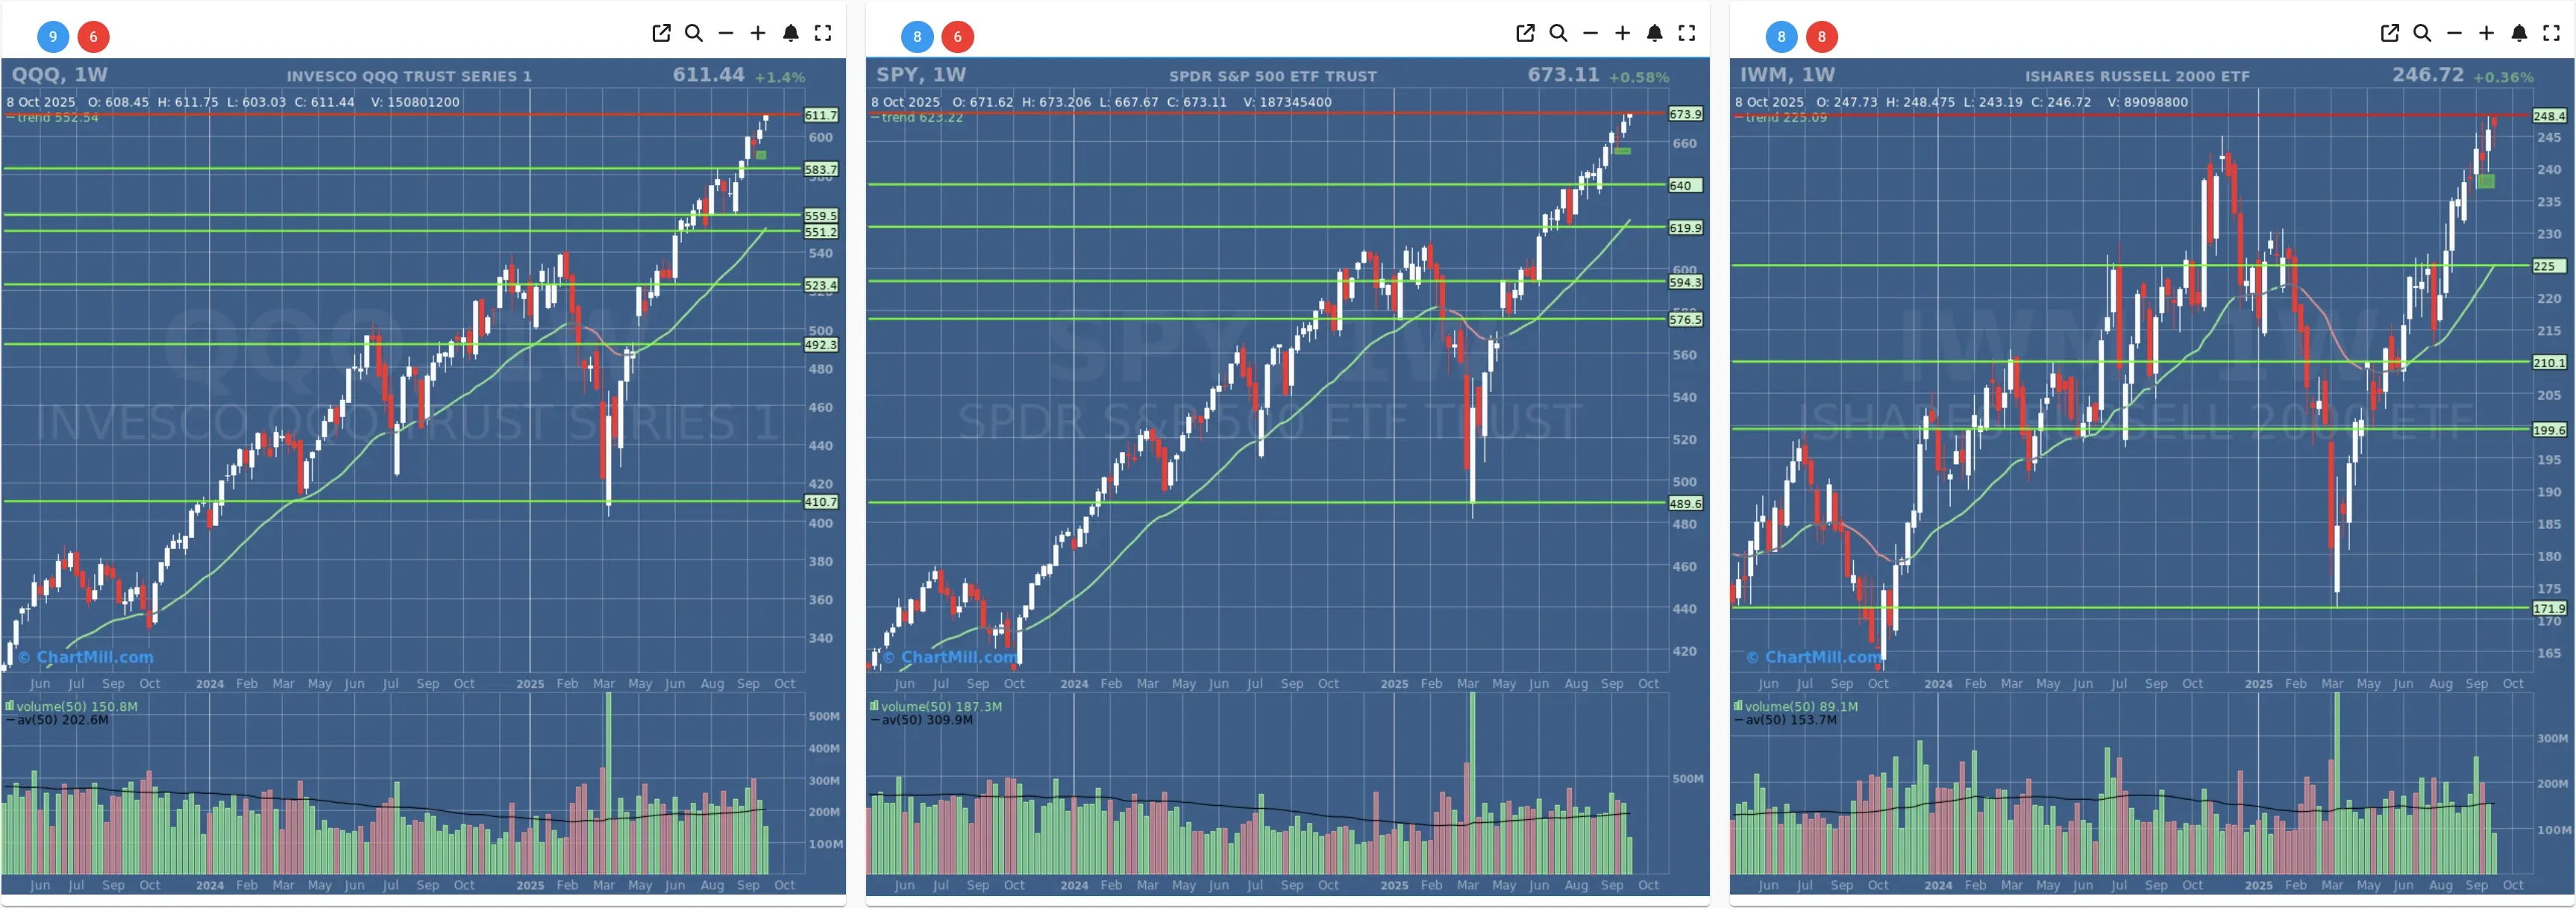
- Long-Term Trend: Positive (no change)
- Long-Term Trend: Positive (no change)
- Long-Term Trend: Positive (no change)
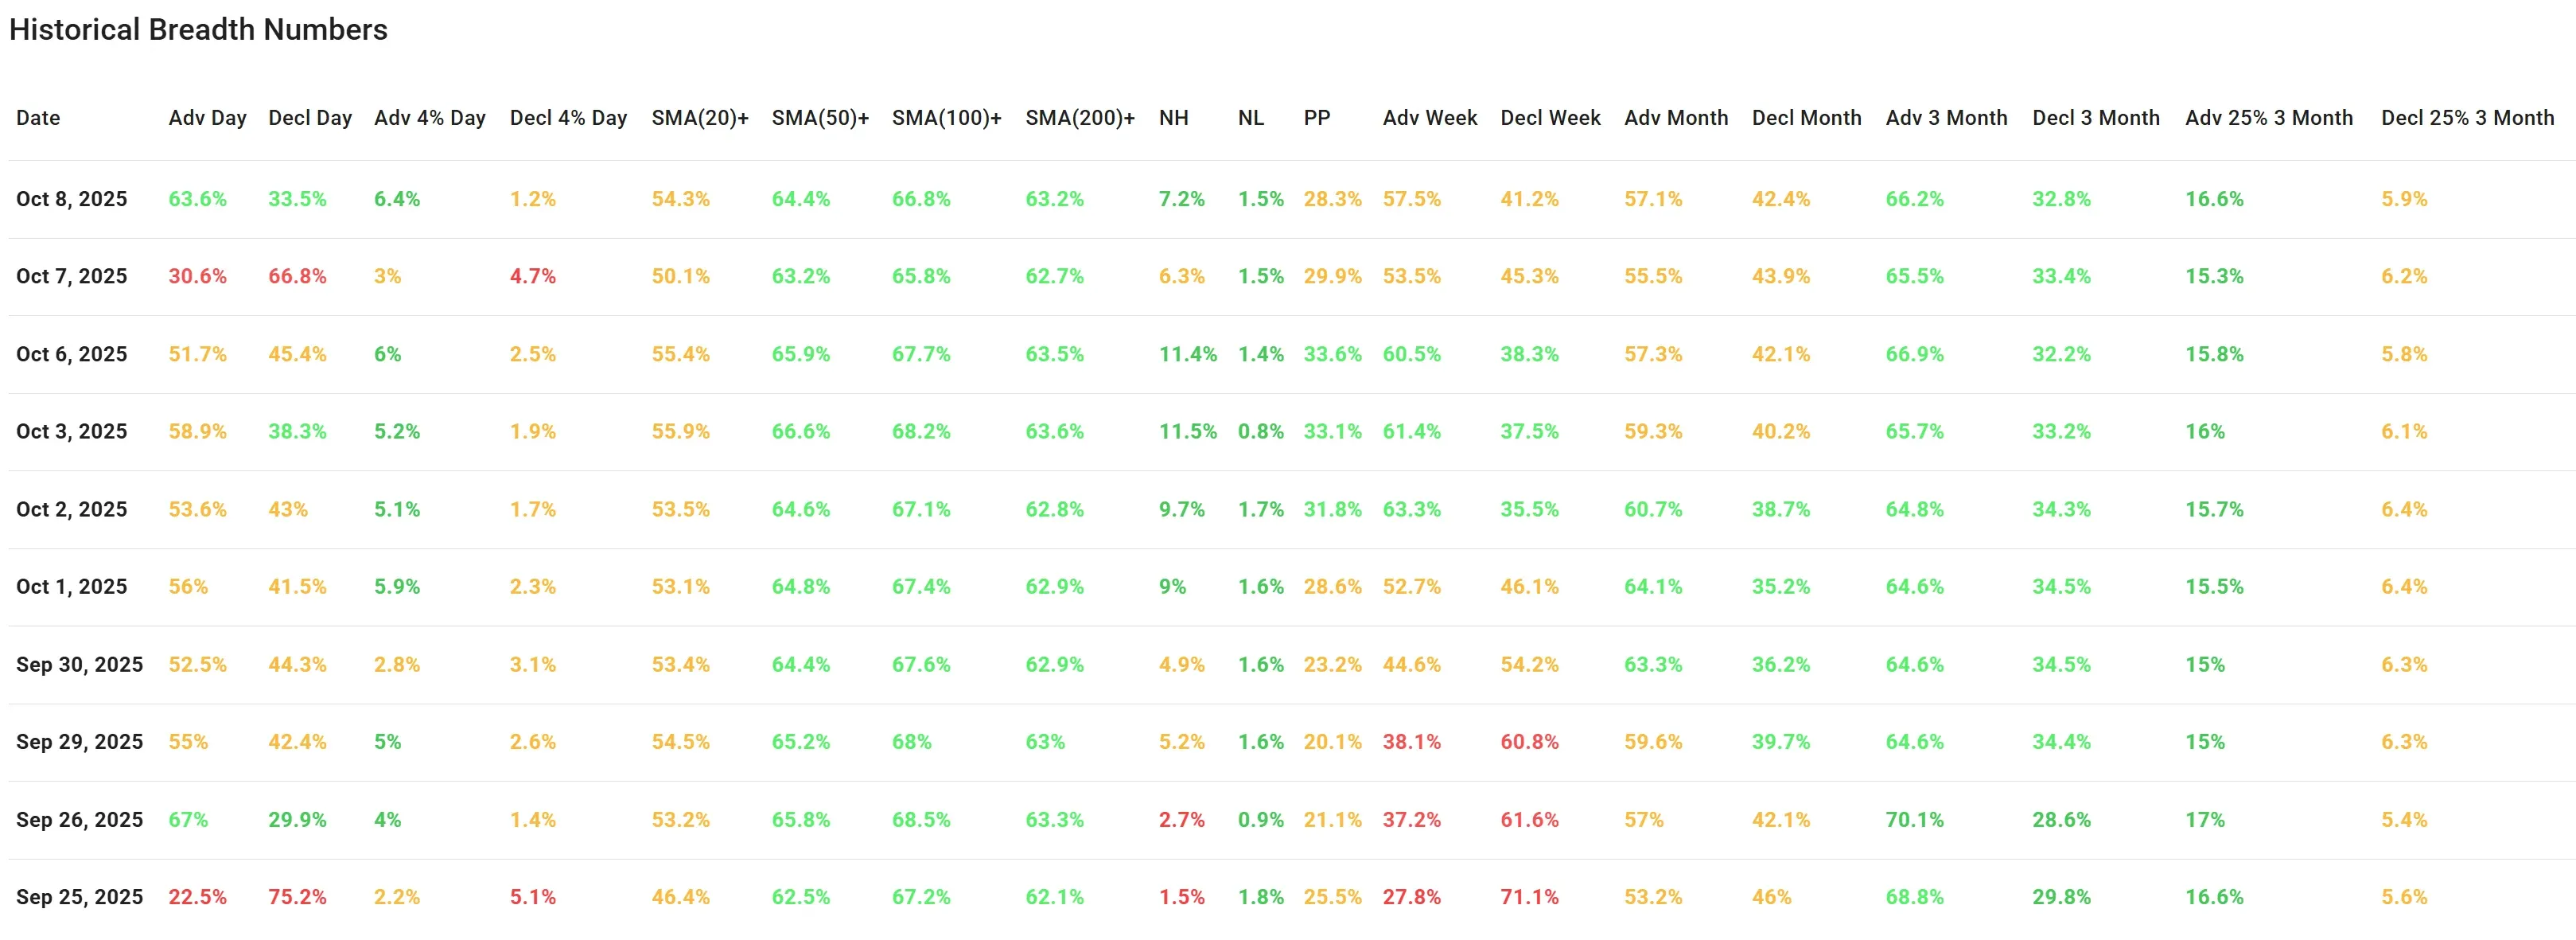
Daily Market Breadth Analysis – October 8, 2025 (After Market Close)
After Tuesday’s clear breakdown in market breadth - where only 30.6% of stocks advanced and 66.8% declined - Wednesday brought a sharp reversal in sentiment, with 63.6% of stocks finishing higher and only 33.5% declining. The share of stocks gaining over 4% also more than doubled to 6.4%, while 4%+ losers fell from 4.7% to just 1.2%. This indicates a strong one-day rebound, both in terms of participation and magnitude.
However, when viewed in the broader 10-day context, this bounce does not yet signal a definitive trend change.
Key Observations:
Breadth Recovery — A One-Day Pop or Reversal?
Wednesday’s action reversed the previous day’s steep deterioration, but it came immediately after one of the weakest breadth days in the past two weeks. Volatility in breadth metrics suggests a market still searching for direction rather than one confidently trending upward.
Percentage of Stocks Above Key SMAs Stabilizes
-
Stocks trading above their 20-, 50-, 100- and 200-day SMAs all ticked higher:
-
SMA(20)+: 54.3% (up from 50.1%)
-
SMA(50)+: 64.4% (up from 63.2%)
-
SMA(100)+: 66.8% (up from 65.8%)
-
SMA(200)+: 63.2% (up from 62.7%)
These figures show that more stocks are regaining technical footing, but they remain roughly in line with recent levels — not yet suggesting broad-based bullish conviction.
New Highs vs New Lows
New highs ticked up slightly from 6.3% to 7.2%, and new lows remained unchanged at 1.5%. While this uptick is constructive, it doesn't yet signal a meaningful expansion in leadership.
Short-Term Breadth Mixed
-
Advancing stocks over the past week: 57.5%
-
Declining stocks over the past week: 41.2%
-
The percentage of stocks up over the past month is steady at 57.1%, slightly better than the previous day (55.5%).
These intermediate-term metrics have stabilized but are not yet moving decisively higher.
3-Month Metrics Hold Steady
-
Advancers (3 months): 66.2%
-
Decliners (3 months): 32.8%
-
The number of stocks up 25%+ in the last 3 months remained at 16.6%, while the number of 25%+ losers declined slightly to 5.9%.
These suggest a broader base of strength remains intact from the longer-term trend, though new momentum has not yet expanded.
Conclusion:
The strong bounce on October 8 is encouraging, especially considering the severity of the previous day’s weakness. However, given the highly reactive nature of the move and the fact that intermediate-term indicators remain neutral, it's too early to declare a new bullish trend.
The market may still be in a choppy consolidation phase, and further confirmation from breadth expansion - especially an increase in new highs and 25%+ gainers - would be needed to move the needle toward a more sustained uptrend.
Breadth Trend Rating: Neutral
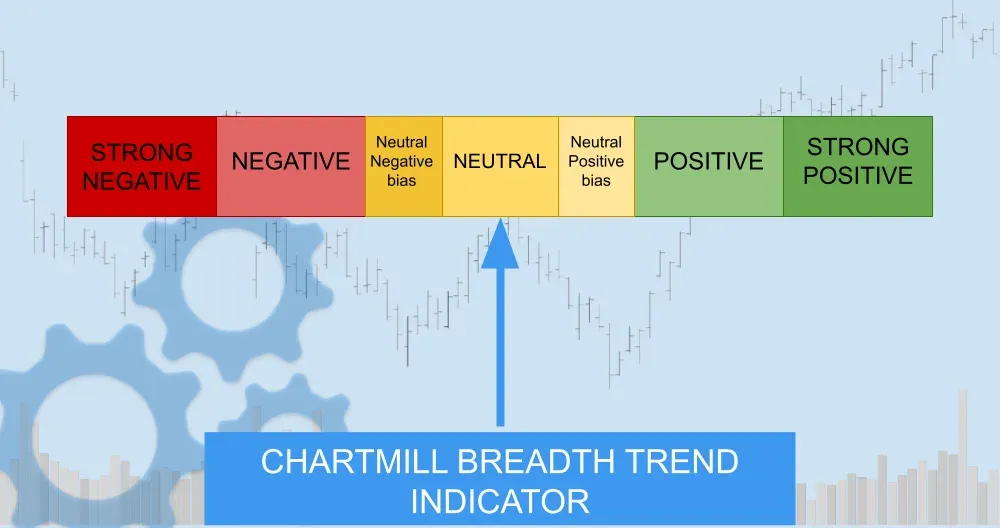
Despite Wednesday's rebound, breadth metrics suggest the market is currently caught in a holding pattern, with no decisive trend in place. It’s a mixed-to-neutral landscape, with improving short-term action but insufficient confirmation from broader, longer-term metrics.
Kristoff - ChartMill
Next to read: AI Chipmakers Keep Dominating as Gold Hits Record Highs