

(All data & visualisations by ChartMill.com)
Daily Market Trend Analysis – October 16, 2025 (After Market Close)
IWM down more than 2%
Short Term Trend
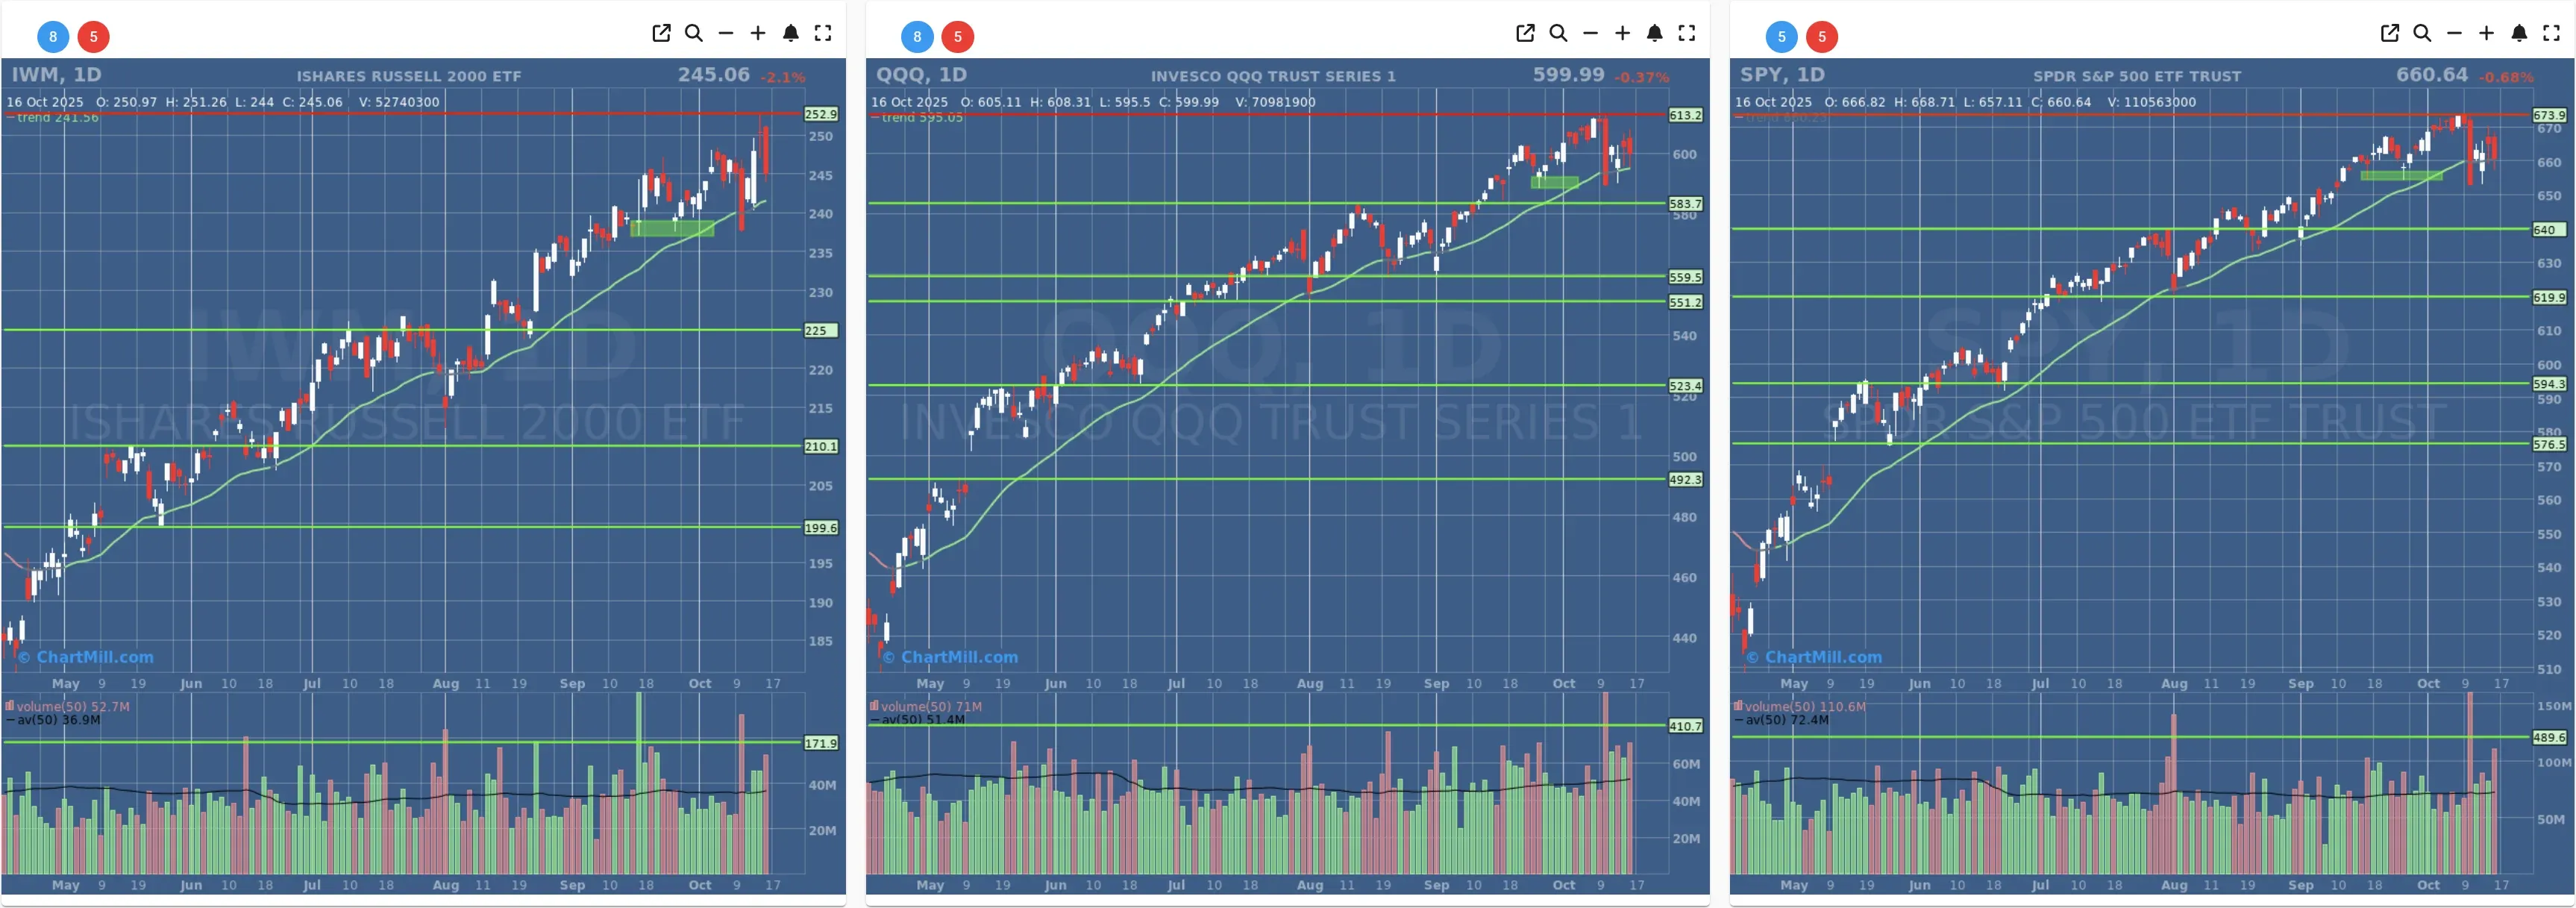
- Short-Term Trend: Neutral (No Change)
- Next Support at $650 - $640
- Next Resistance at $673
- Volume: Well Above Average (50)
- Pattern: Down Day
- Short-Term Trend: Positive (No Change)
- Next Support at $583
- Next Resistance at $611
- Volume: Well Above Average (50)
- Pattern: Down Day
- Short-Term Trend: Positive (No Change)
- Next Support at $235
- Next Resistance at $248
- Volume: Well Above Average (50)
- Pattern: Down Day - Weak Candle Close
Long Term Trend
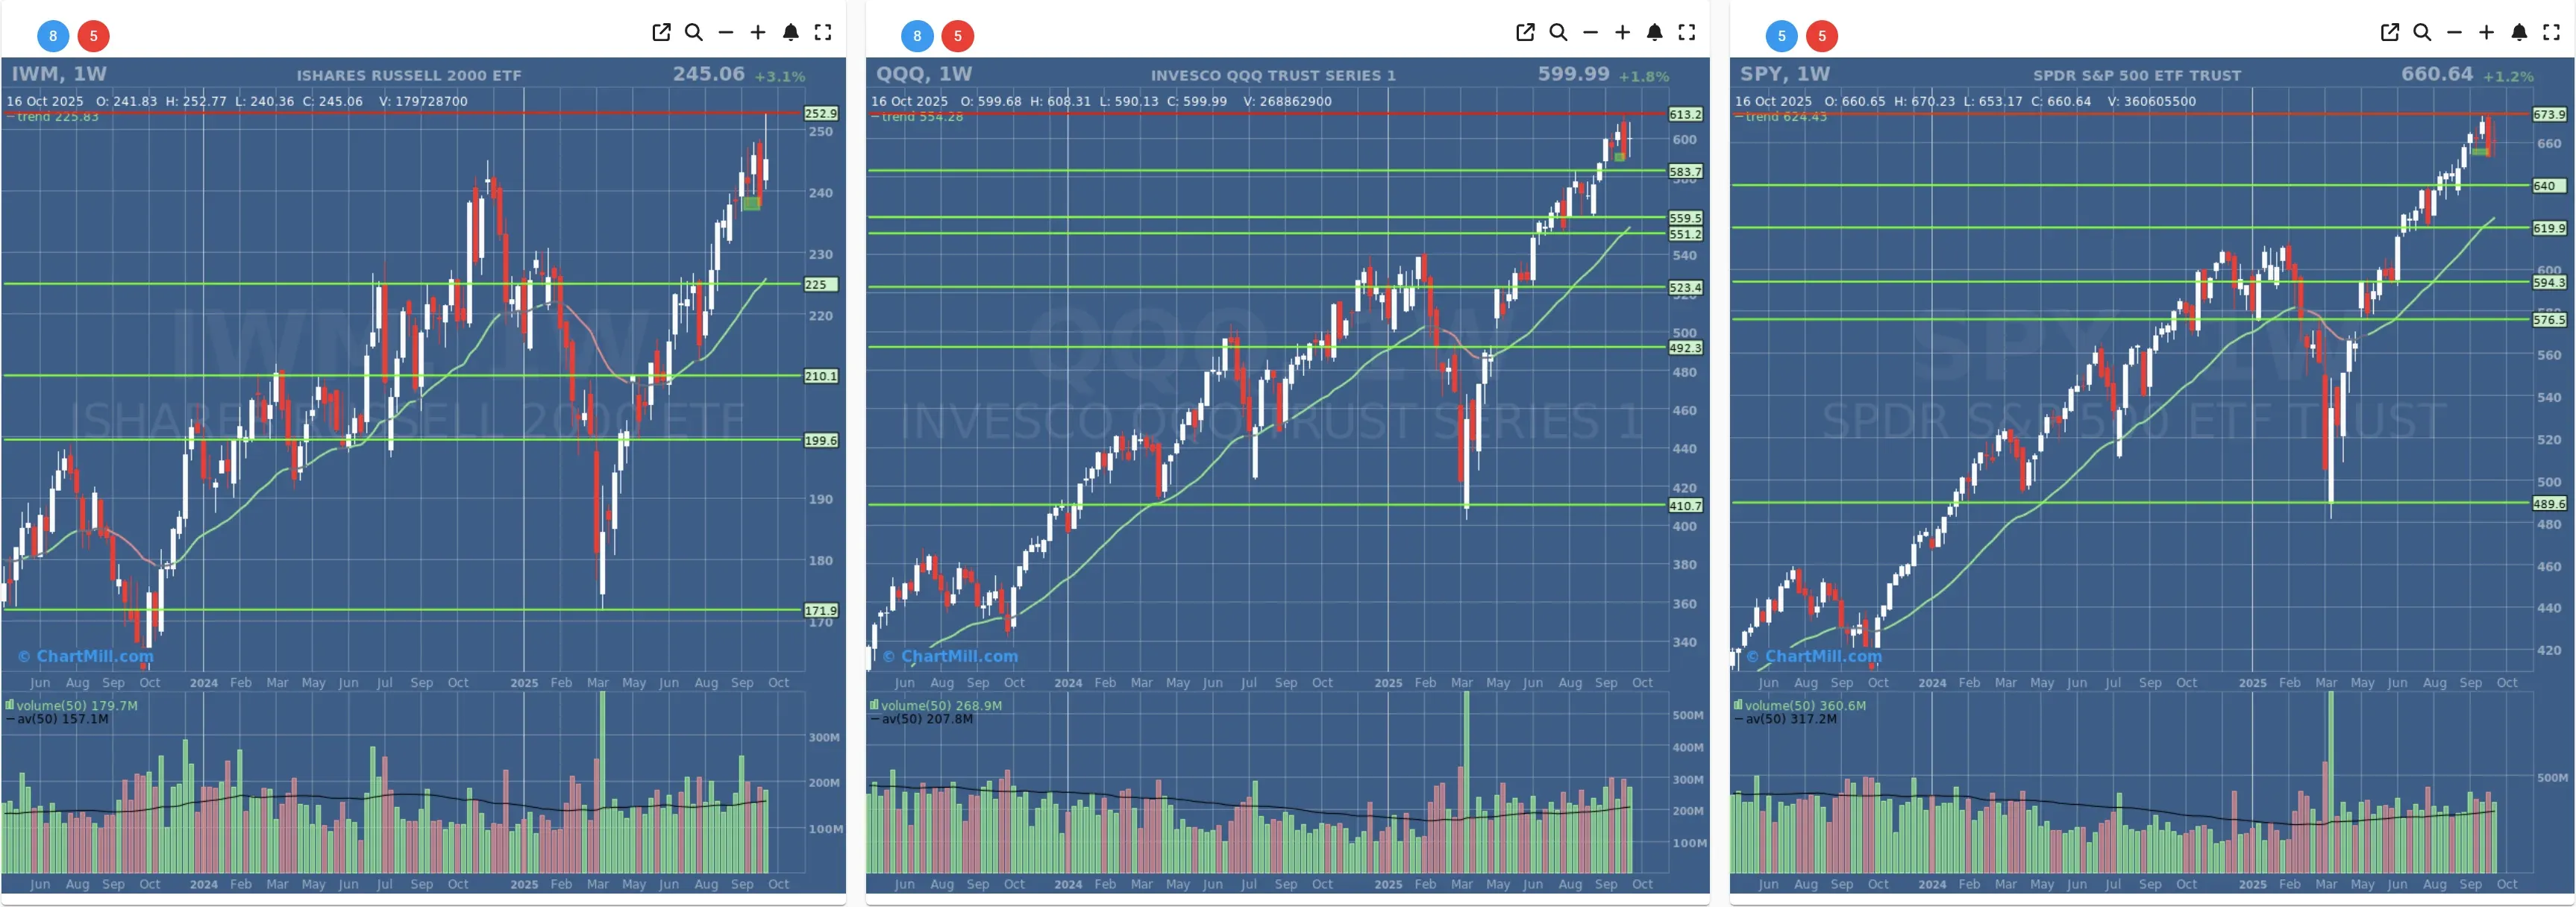
- Long-Term Trend: Positive (no change)
- Long-Term Trend: Positive (no change)
- Long-Term Trend: Positive (no change)
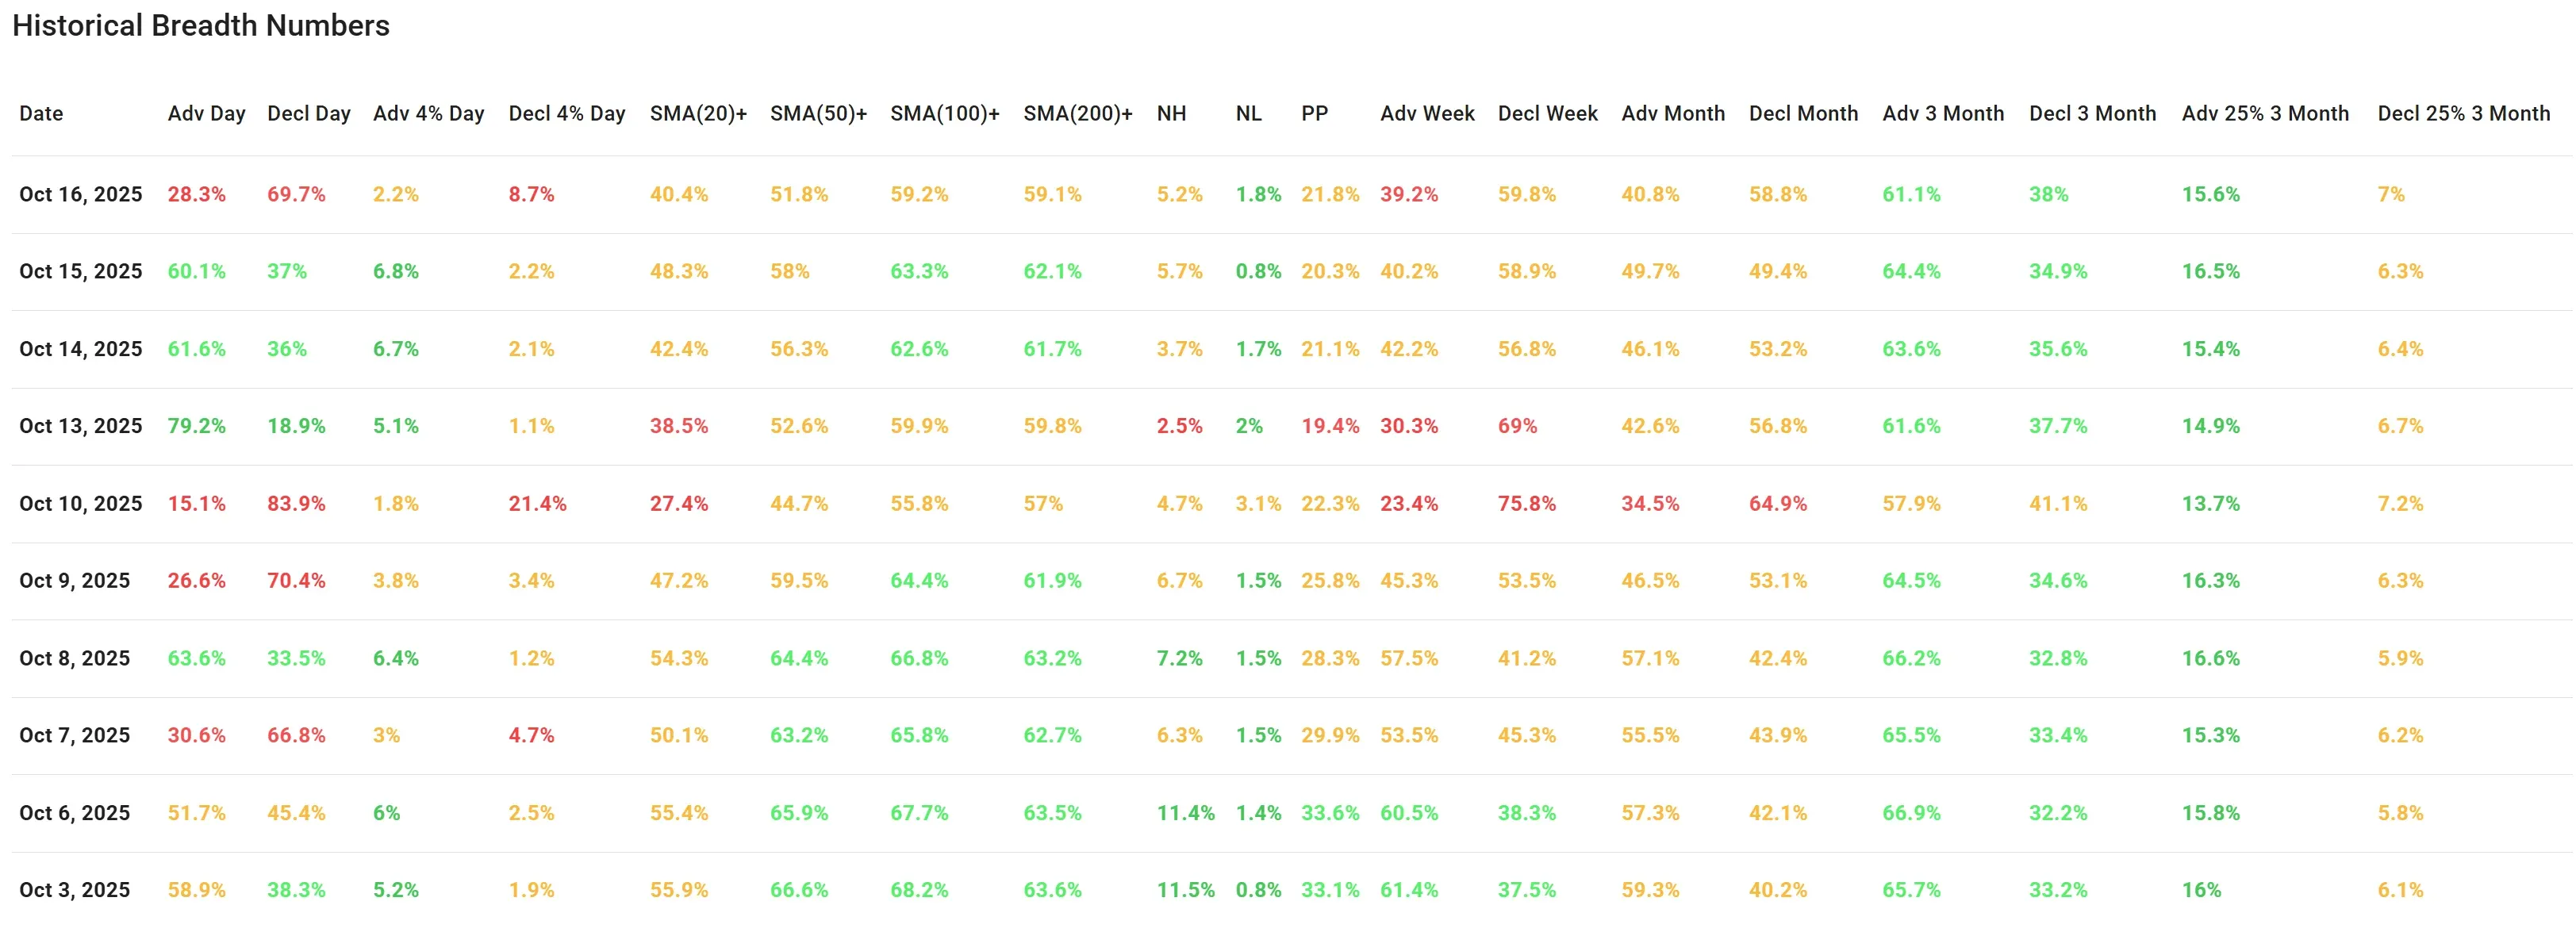
Daily Market Breadth Analysis – October 16, 2025 (After Market Close)
After two constructive sessions, breadth rolled over hard on Thursday, with decliners re-taking a clear majority and short-term momentum slipping back below key thresholds. Intermediate-term gauges remain intact, but they’re deteriorating.
Session snapshot
-
Adv/Decl: 28.3% vs 69.7% — broad downside participation after Wednesday’s balanced/positive finish.
-
Big movers (±4%): Adv 2.2% vs Decl 8.7% — outsized losses outnumbered outsized gains by ~4:1, confirming decisive selling pressure.
-
New Highs/Lows: NH 5.2% vs NL 1.8% — new lows stayed contained; this looks like a risk-off rotation rather than a breakdown spree.
-
% above MAs: 20DMA 40.4% (↓ from 48.3%), 50DMA 51.8% (↓ from 58.0%), 100DMA 59.2% (↓ from 63.3%), 200DMA 59.1% (↓ from 62.1%). Short-term momentum slipped back into net-negative territory while longer-term breadth still (barely) holds majority above their trend lines.
Rolling breadth:
-
1-week: Adv 39.2% / Decl 59.8% — weekly tilt has turned negative again.
-
1-month: Adv 40.8% / Decl 58.8% — monthly breadth flipped negative today (was roughly balanced yesterday).
-
3-month: Adv 61.1% / Decl 38.0% — medium-term still constructive, but slipping.
-
3-month +25% movers: Adv 15.6% vs Decl 7.0% — leadership pockets persist but narrowed.
What changed vs Wednesday (Oct 15):
-
The two-day rebound (Oct 13–15) failed to broaden. Advancers fell from 60.1% to 28.3%, while big decliners surged from 2.2% to 8.7%.
-
The % above 20DMA dropped back to 40.4% (sub-50% = near-term control to sellers). Even the 50/100/200DMA cohorts pulled back several points, signaling ongoing distribution beneath the surface.
-
Despite the selling, new lows remained modest (1.8% vs 0.8% yesterday), suggesting corrections are still mostly within existing ranges rather than fresh breakdown waves.
Context & interpretation:
The data depict a sharp risk-off day that unwound much of the early-week progress. Weak short-term breadth and a newly negative monthly tilt argue for caution on breakouts and for tighter risk on existing longs.
The persistence of a majority above the 100/200DMA and muted new lows tempers the message: this is deterioration, not capitulation.
Bottom line: Short-term trend has slipped back to the bears; intermediate trend is weakening but not broken. Expect choppy tape where failed follow-through is common until the 20DMA cohort reclaims >50% and the share of big decliners normalizes.
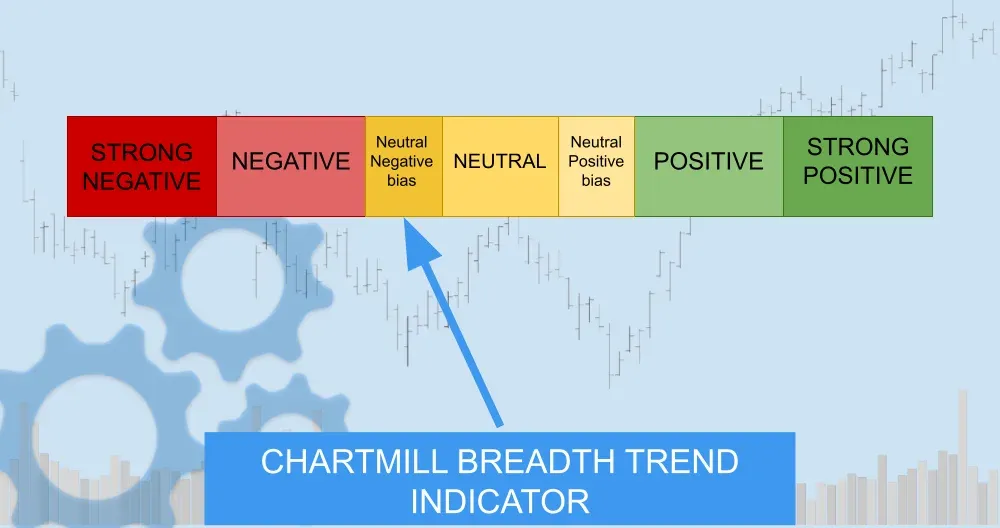
Breadth Trend Rating: Neutral with a negative bias.
- Kristoff - ChartMill
Next to read: AI Stocks Take a Breather as Bank Worries Resurface