(All data & visualisations by ChartMill.com)
Daily Market Trend Analysis – October 15, 2025 (After Market Close)
New High for IWM
Short Term Trend

- Short-Term Trend: Neutral (No Change)
- Next Support at $650 - $640
- Next Resistance at $673
- Volume: Slightly Above Average (50)
- Pattern: Up Day - Gap Up - Doji Candle
- Short-Term Trend: TREND CHANGE! > Positive (up from neutral)
- Next Support at $583
- Next Resistance at $611
- Volume: Above Average (50)
- Pattern: Up Day - Gap Up - Doji Candle
- Short-Term Trend: TREND CHANGE! > Positive (up from neutral)
- Next Support at $235
- Next Resistance at $248
- Volume: Above Average (50)
- Pattern: Up Day - Gap Up - New High - Doji Candle
Long Term Trend

- Long-Term Trend: Positive (no change)
- Long-Term Trend: Positive (no change)
- Long-Term Trend: Positive (no change)
Daily Market Breadth Analysis – October 15, 2025 (After Market Close)
Wednesday’s session (Oct 15) extended the post-selloff repair. Daily breadth stayed solid (~60% advancers) and more stocks pushed back above key moving averages. New highs expanded while new lows dried up. The weekly window is still net negative, but the gap is narrowing.

Daily pulse — constructive and consistent
-
Adv/Decl: 60.1% vs 37.0% (yesterday 61.6% vs 36.0%). That’s a third straight positive day after the Oct 10 washout.
-
Big movers: 4%+ advancers 6.8% vs decliners 2.2% (virtually unchanged from yesterday’s 6.7%/2.1%). Upside participation remains broader than downside spikes.
Trend participation - steady improvement
Above MAs:
-
20-DMA: 48.3% (↑ from 42.4%)
-
50-DMA: 58.0% (↑ from 56.3%)
-
100-DMA: 63.3% (↑ from 62.6%)
-
200-DMA: 62.1% (↑ from 61.7%)
Short-term (20-DMA) breadth is inflecting higher, confirming what we noted yesterday: the bounce is pulling more names back into uptrends rather than just lifting the same leaders.
Leadership & stress — better mix
New Highs / New Lows: 5.7% NH (↑ from 3.7%) vs 0.8% NL (↓ from 1.7%). Leadership broadened and downside stress eased further, a clean follow-through to Tuesday’s improvement.
Time-frame check - near-term up, weekly not there yet
-
1-Week window: Adv 40.2% / Decl 58.9% (slightly worse than yesterday’s 42.2%/56.8%). The weekly look still reflects last week’s damage; it will take a couple more good days to flip this.
-
1-Month window: Adv 49.7% / Decl 49.4% (better vs 46.1%/53.2%).
-
3-Month window: Adv 64.4% / Decl 34.9% (modestly stronger); Adv ≥25% (3M): 16.5% (↑), Decl ≥25% (3M): 6.3% (↓). The medium-term backdrop remains supportive and is edging higher.
Context
Price action continues to reflect post-earnings season strength in select groups and cooling downside momentum after last Friday’s capitulation-like breadth. There was no widely known intraday macro surprise that would invalidate the data-driven read; this looks like a genuine internal repair rather than a news-driven one-off.
What changed vs. yesterday?
The quality of the bounce improved (more stocks reclaimed the 20/50/100/200 DMAs; NH↑, NL↓).
Weekly breadth slipped a touch, reminding us the short-term rally is still digesting the prior downdraft.
Bottom line
Near-term breadth is consistently positive and improving beneath the surface.
The weekly lens remains net negative but is on the mend; another couple of constructive sessions could tip it neutral.
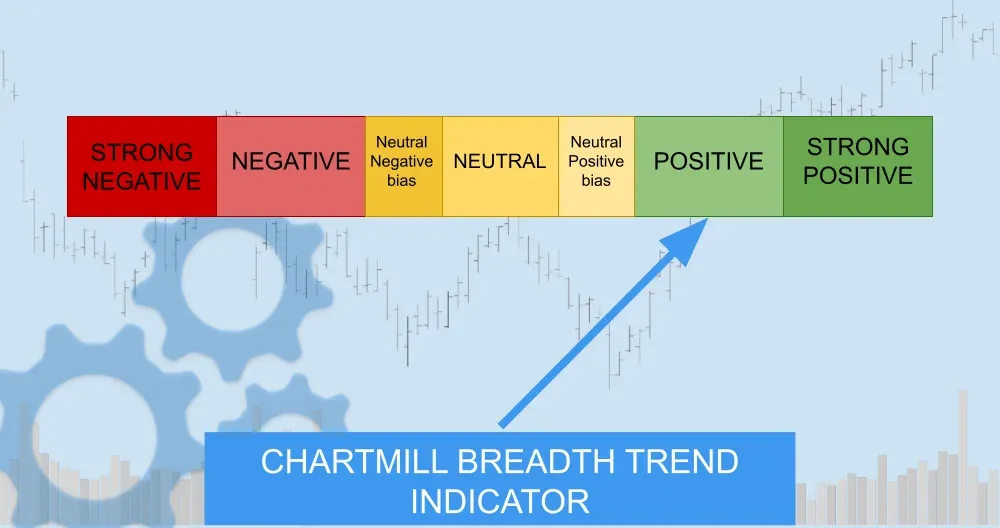
Breadth Trend Rating: positive.
(Up one notch from yesterday’s neutral-to-positive bias as the improvement broadened across MAs and NH/NL, even if the weekly window hasn’t flipped yet.)
- Kristoff - ChartMill
Next to read: Banks and AI Keep Wall Street Afloat Amid Trade Tensions