

(All data & visualisations by ChartMill.com)
Daily Market Trend Analysis – October 10, 2025 (After Market Close)
Big red day and short term trend change!
Short Term Trend
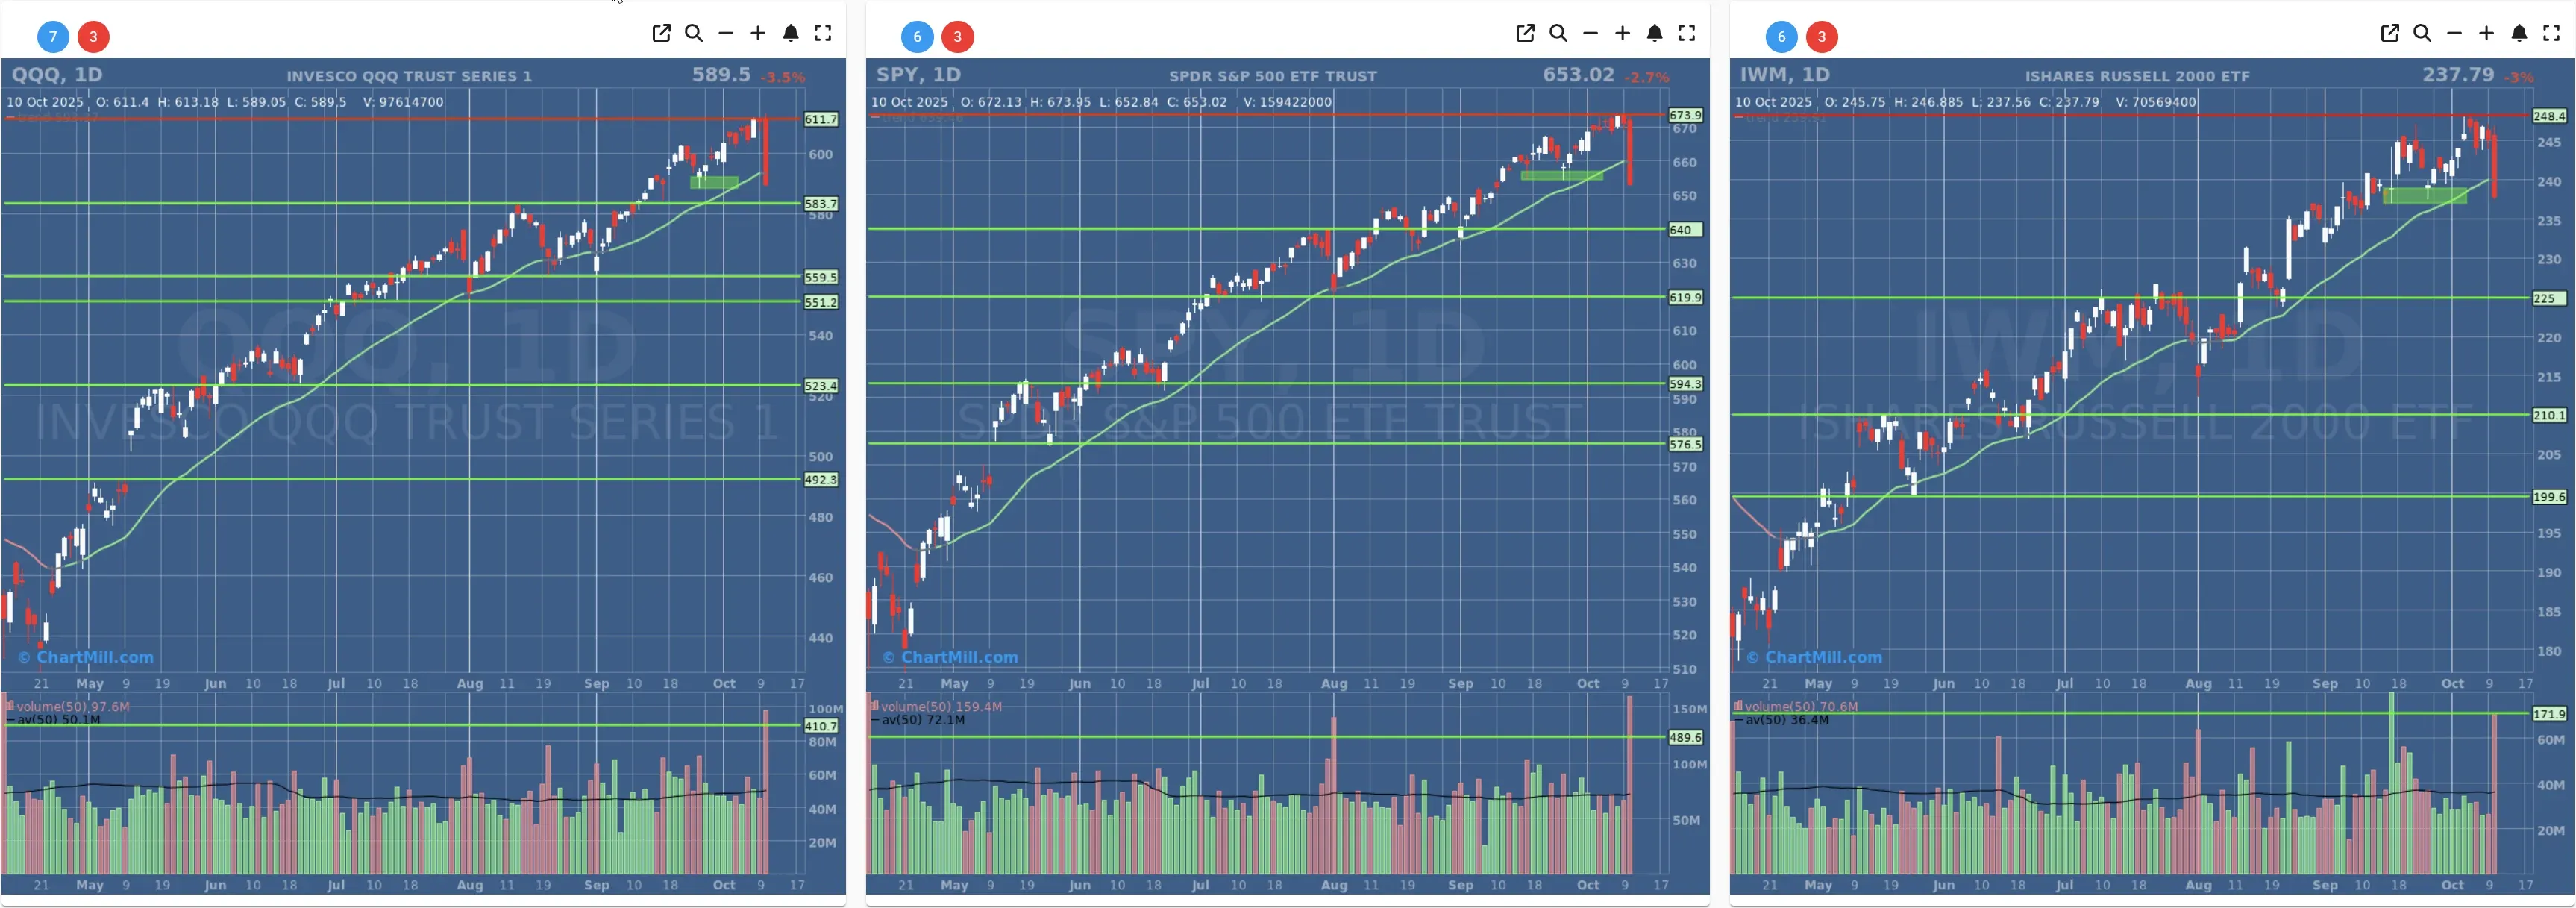
- Short-Term Trend: TREND CHANGE! > Neutral (down from positive)
- Next Support at $650 - $640
- Next Resistance at $673
- Volume: Extreme: Far above Average (50)
- Pattern: Down Day - Very Strong Bearish Candle
- Short-Term Trend: TREND CHANGE! > Neutral (down from positive)
- Next Support at $583
- Next Resistance at $611
- Volume: Extreme: Far above Average (50)
- Pattern: Down Day - Very Strong Bearish Candle
- Short-Term Trend: TREND CHANGE! > Neutral (down from positive)
- Next Support at $235
- Next Resistance at $248
- Volume: Extreme: Far above Average (50)
- Pattern: Down Day - Very Strong Bearish Candle
Long Term Trend
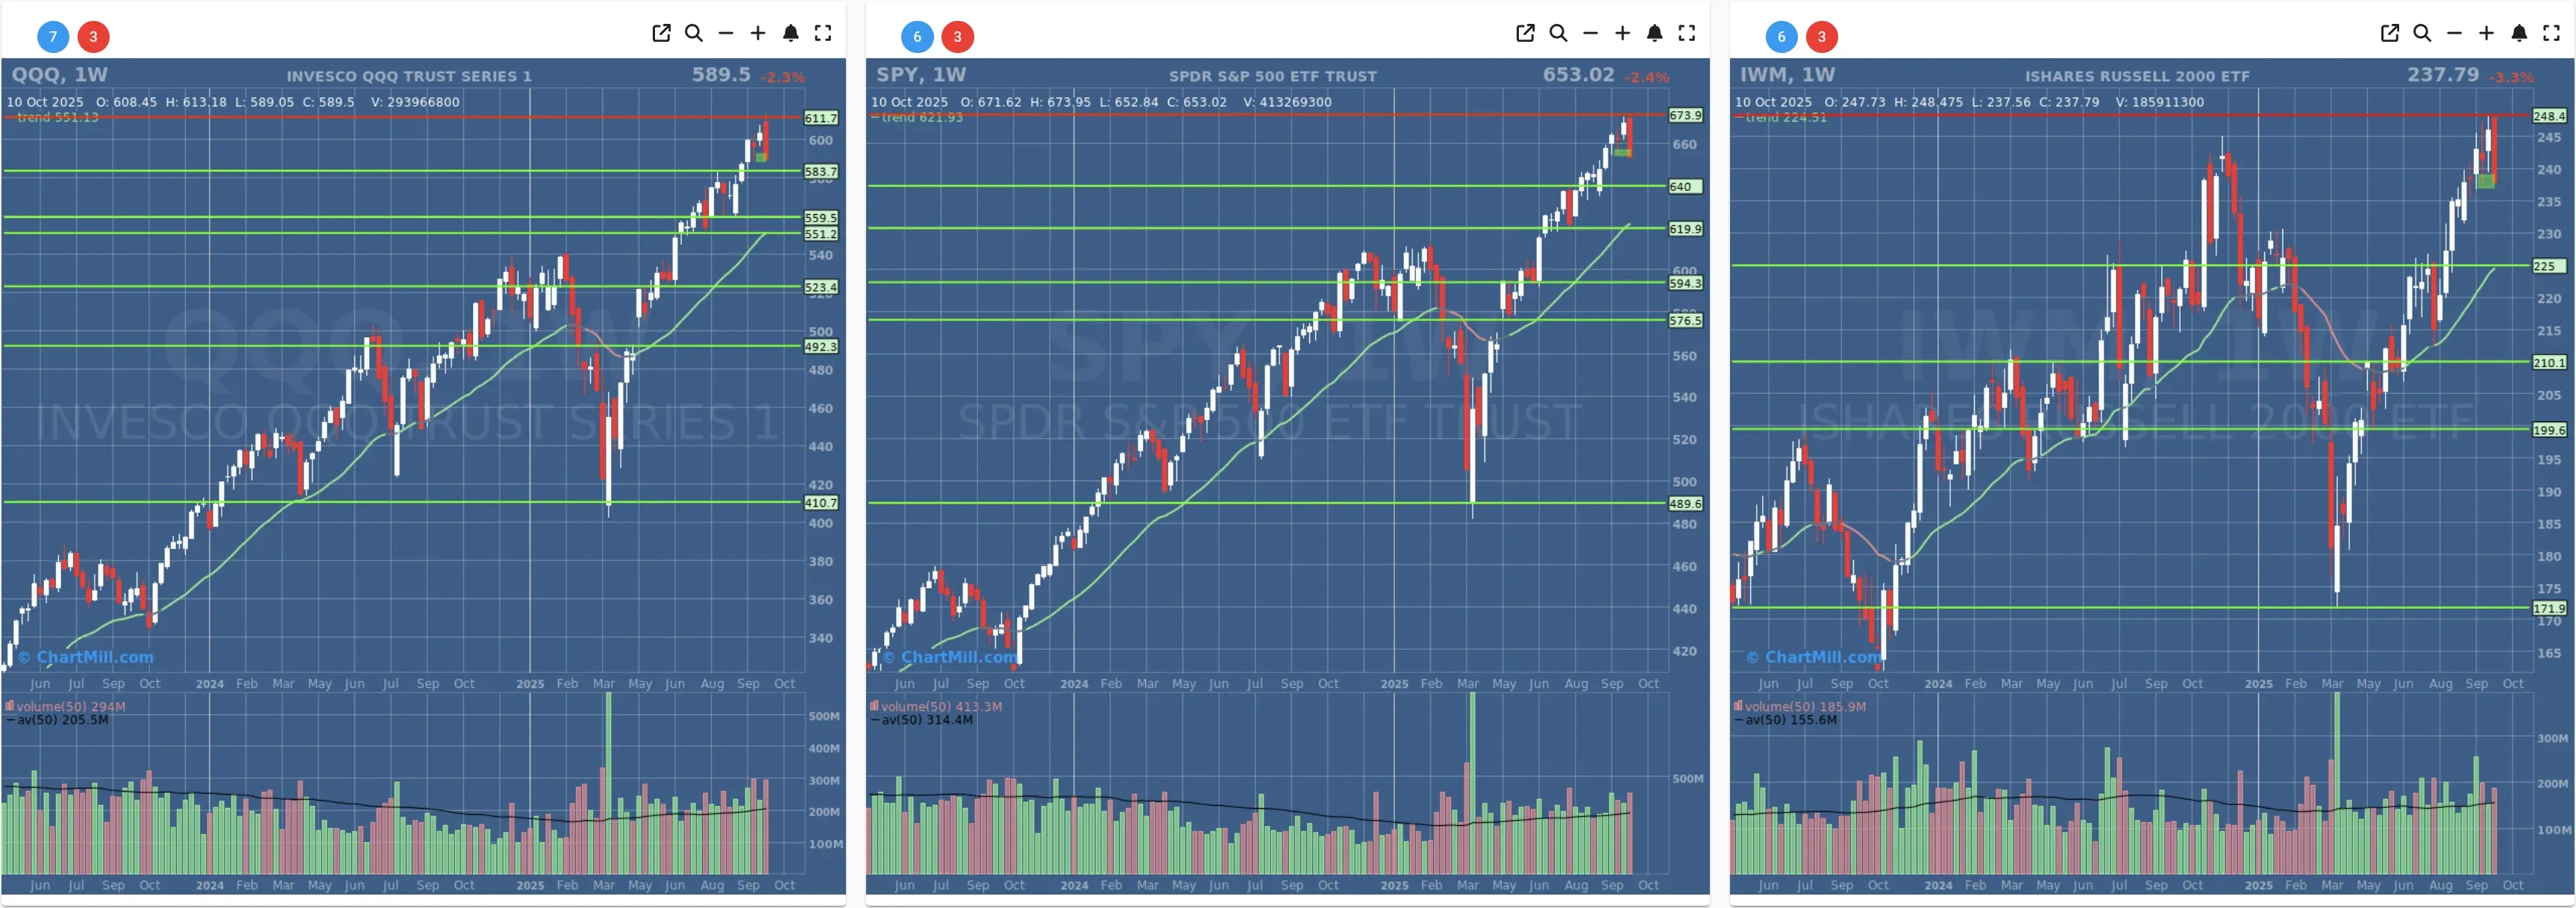
- Long-Term Trend: Positive (no change)
- Long-Term Trend: Positive (no change)
- Long-Term Trend: Positive (no change)
Daily Market Breadth Analysis – October 10, 2025 (After Market Close)
After a brief recovery attempt midweek, market breadth deteriorated again on Friday, October 10. Declining stocks overwhelmed advancers, and short-term momentum gauges worsened. The underlying trend has clearly shifted back to a defensive posture.
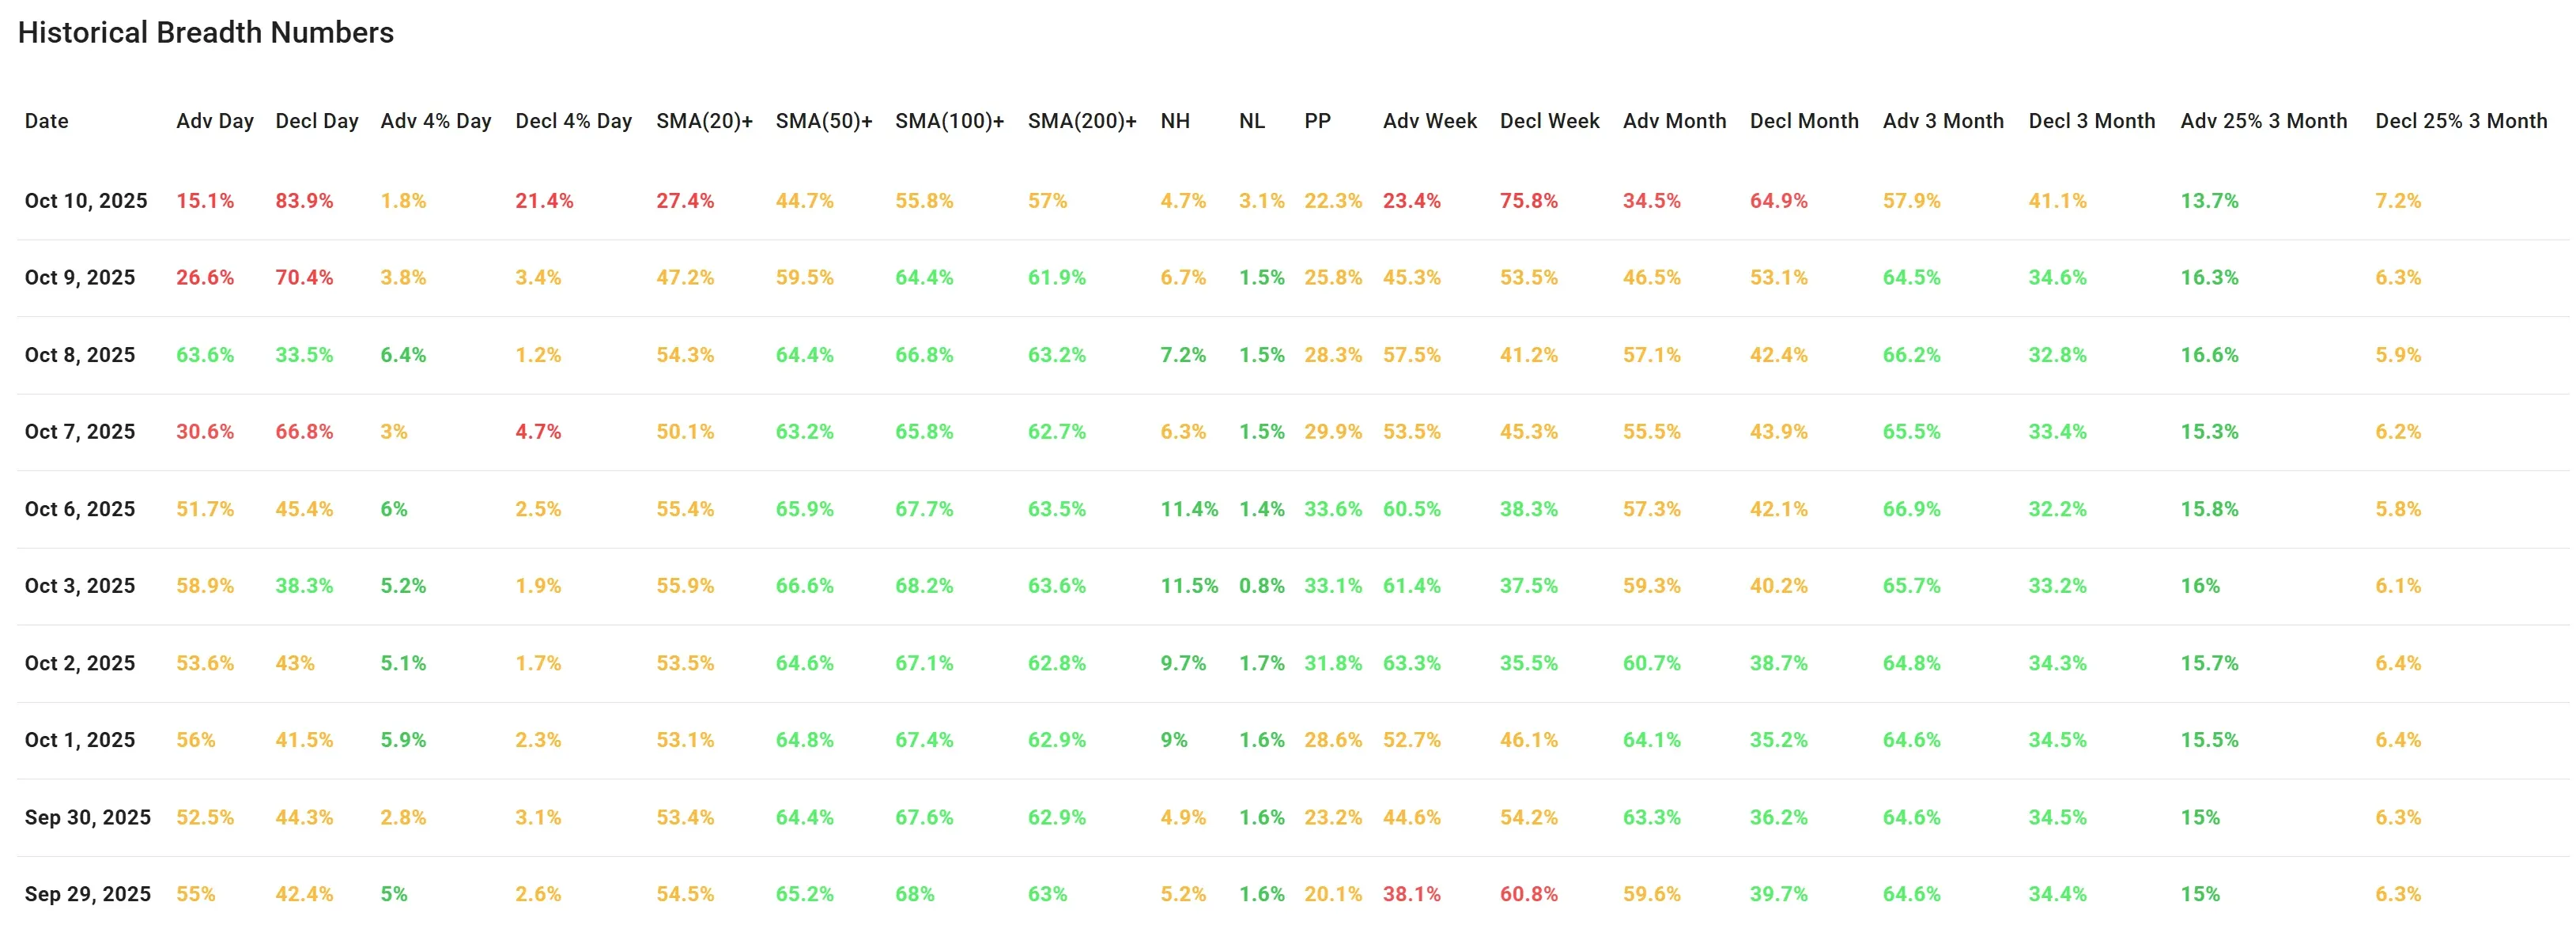
The breadth data for Friday, October 10, confirms a sharp deterioration in short-term market momentum, effectively nullifying Wednesday’s temporary rebound. Key indicators paint a picture of widespread weakness:
-
Only 15.1% of stocks advanced on the day, compared to 83.9% that declined, the most negative A/D reading in over a week.
-
Even more striking is the surge in high-magnitude losers: 21.4% of all stocks fell more than 4%, up from just 3.4% the day before. Meanwhile, only 1.8% gained more than 4%.
-
Breadth on a weekly basis continued to weaken: only 23.4% of stocks advanced this week, while 75.8% declined.
This marks a strong reversal from October 8, when 63.6% of stocks advanced and only 33.5% declined. The previous optimism was already fading on Thursday (Oct 9), but Friday’s data confirms that selling pressure has intensified.
Trend Indicators Show Deterioration
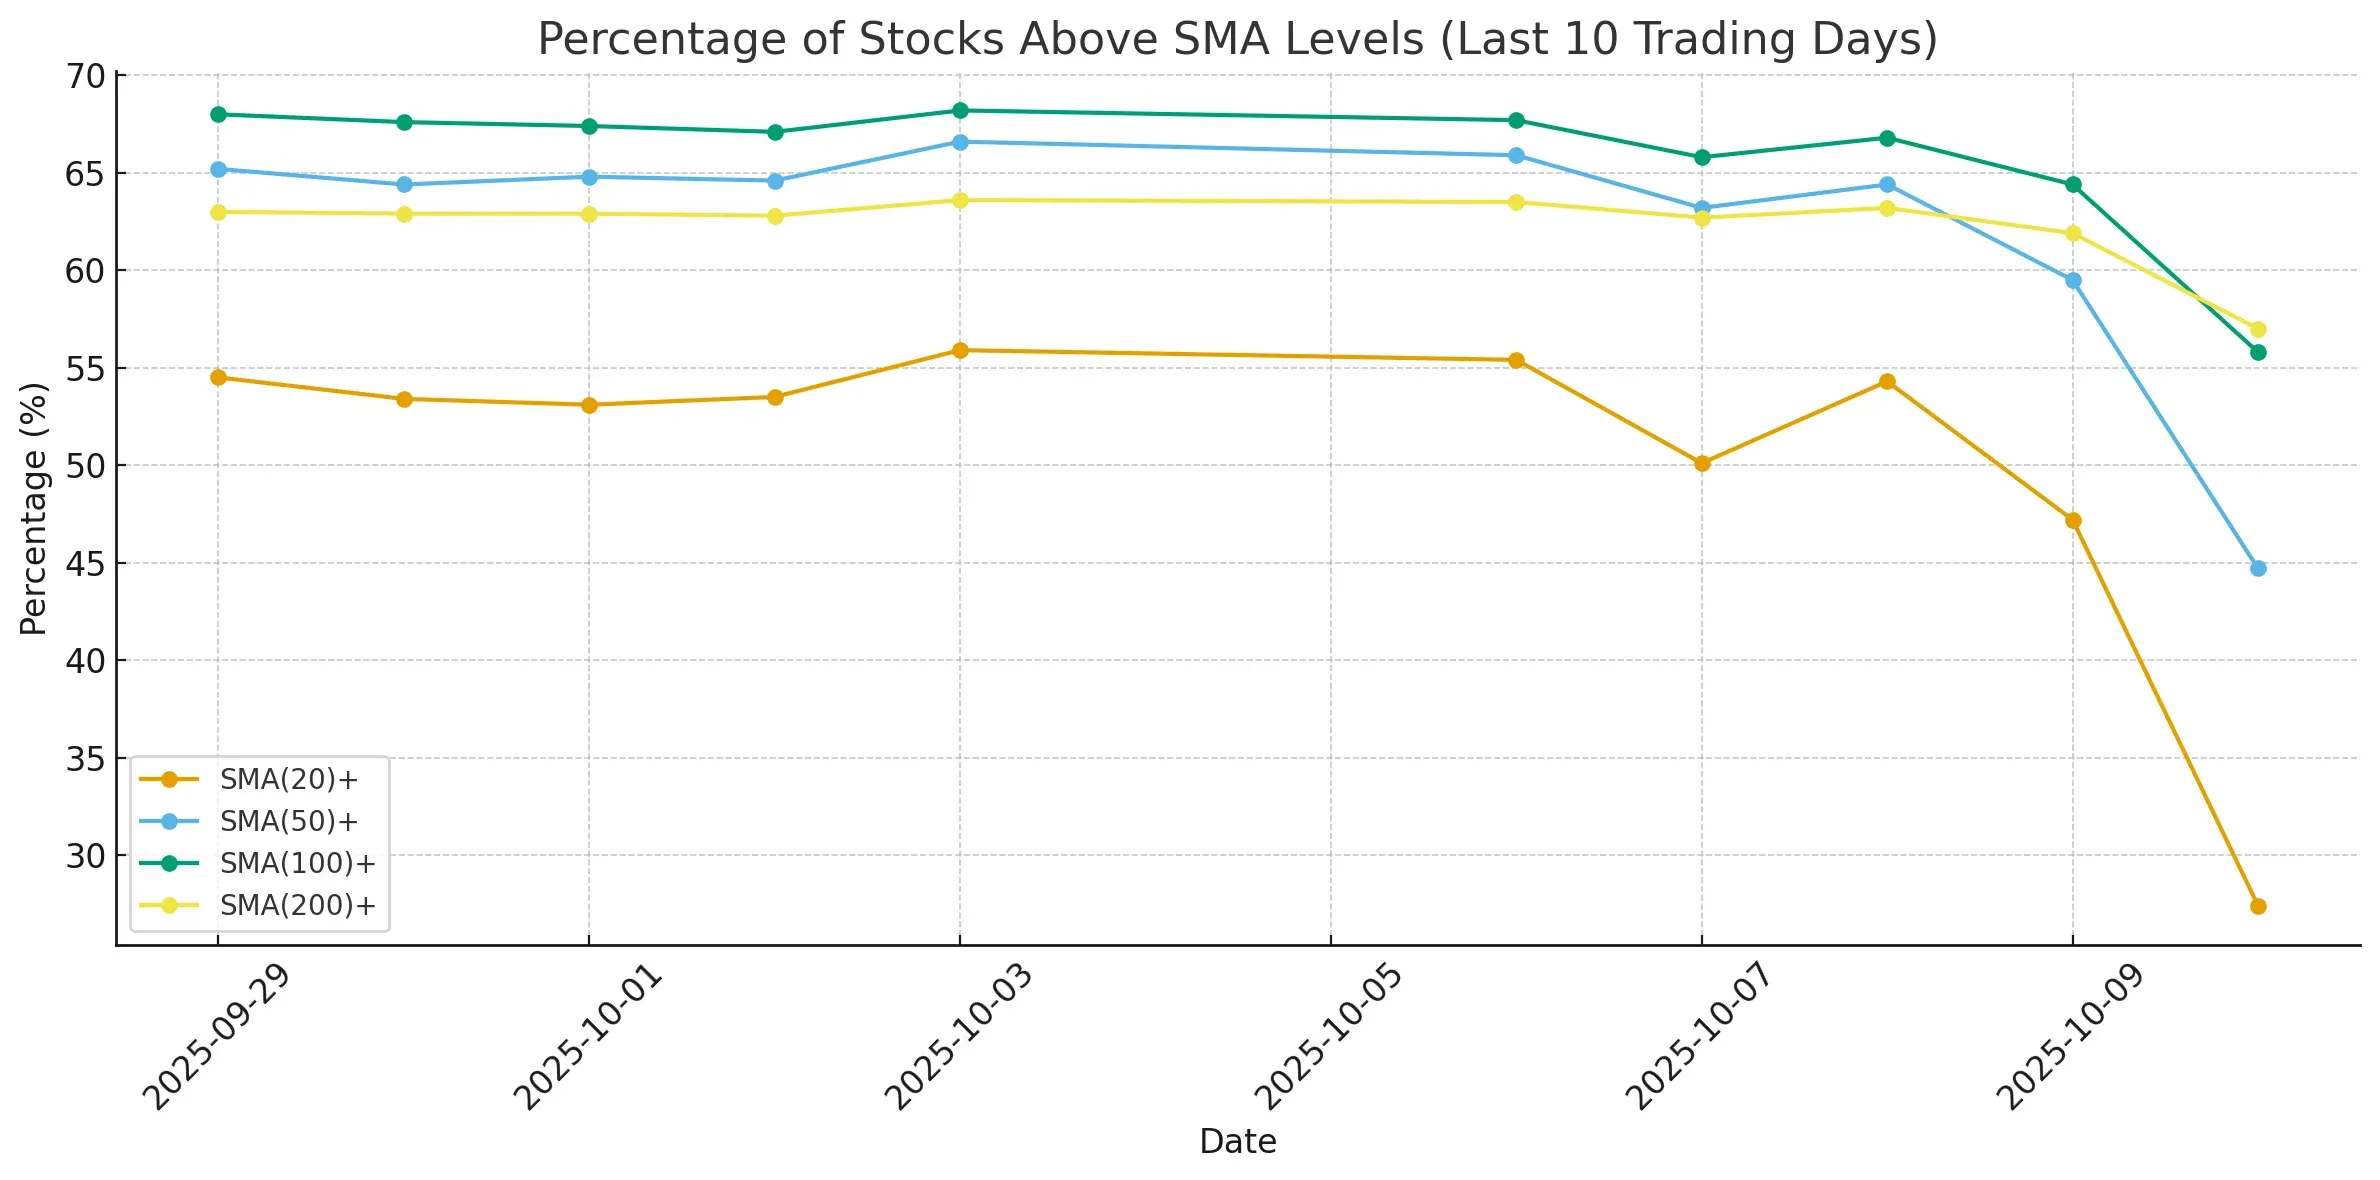
The percentage of stocks trading above their short-term moving averages dropped sharply:
-
SMA(20)+: Down from 47.2% to 27.4%
-
SMA(50)+: Down from 59.5% to 44.7%
-
Even longer-term levels like SMA(100)+ and SMA(200)+ are beginning to soften slightly, though they remain above 55%.
New Highs vs. New Lows
-
New highs (NH) dropped to 4.7%, the lowest since October 1.
-
New lows (NL) ticked up slightly to 3.1%, but remain relatively muted – suggesting this is more a broad softening than a collapse into new lows.
-
The Percentage of Stocks showing a Pocket Pivot (PP) declined from 25.8% to 22.3%, reflecting overall deterioration in price trends.
Longer-Term Breadth Still Intact…
Despite the short-term weakness:
-
Monthly and 3-month metrics are not yet showing extreme stress:
-
Advancers over the last month: 34.5%
-
3-month advancers above 25%: 13.7%, only slightly down from 16.3% the day before.
These figures suggest that the broader uptrend from the summer is not fully broken yet. Keep in mind that these longer-term numbers tend to lag and could deteriorate quickly if selling persists into next week.
Conclusion:
The brief midweek rebound (Oct 8) now appears to have been a dead cat bounce, as Friday’s figures show broad-based selling pressure returning with force. Participation is narrowing rapidly, and the deterioration in short-term moving average metrics adds weight to this shift in sentiment.
Unless we see a strong reversal early next week, this could mark the beginning of a deeper correction phase.
Breadth Trend Rating: Negative
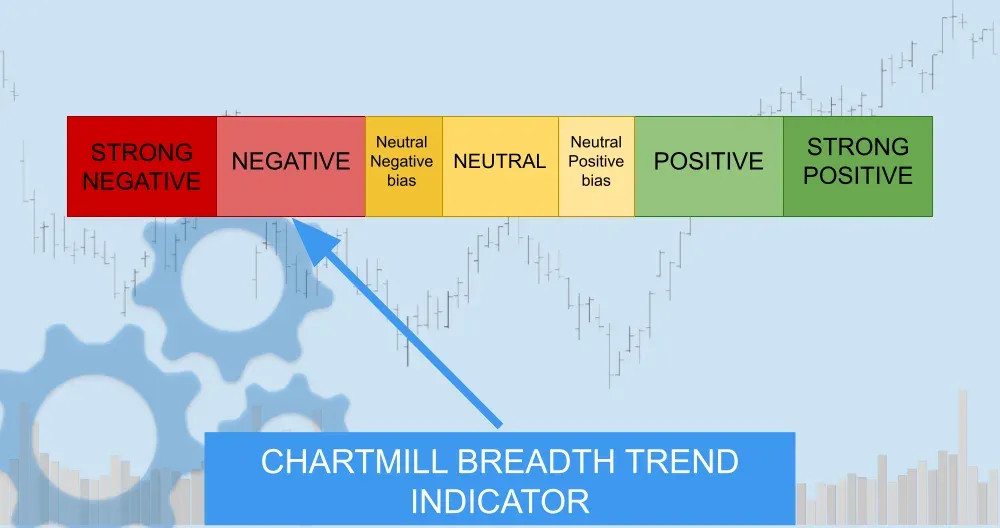
The data reflects a decisive return to risk-off sentiment, with short-term indicators weakening sharply and widespread declines dominating. While not yet in full-blown panic territory, breadth momentum is clearly negative and weakening.
Kristoff - ChartMill
Next to read: Wall Street Suffers Worst Day Since April as Trump Revives Trade War Fears