

(All data & visualisations by ChartMill.com)
Daily Market Trend Analysis – September 12, 2025 (After Market Close)
New high for QQQ, intraday high for SPY, Inside Day candle for IWM
Short Term Trend
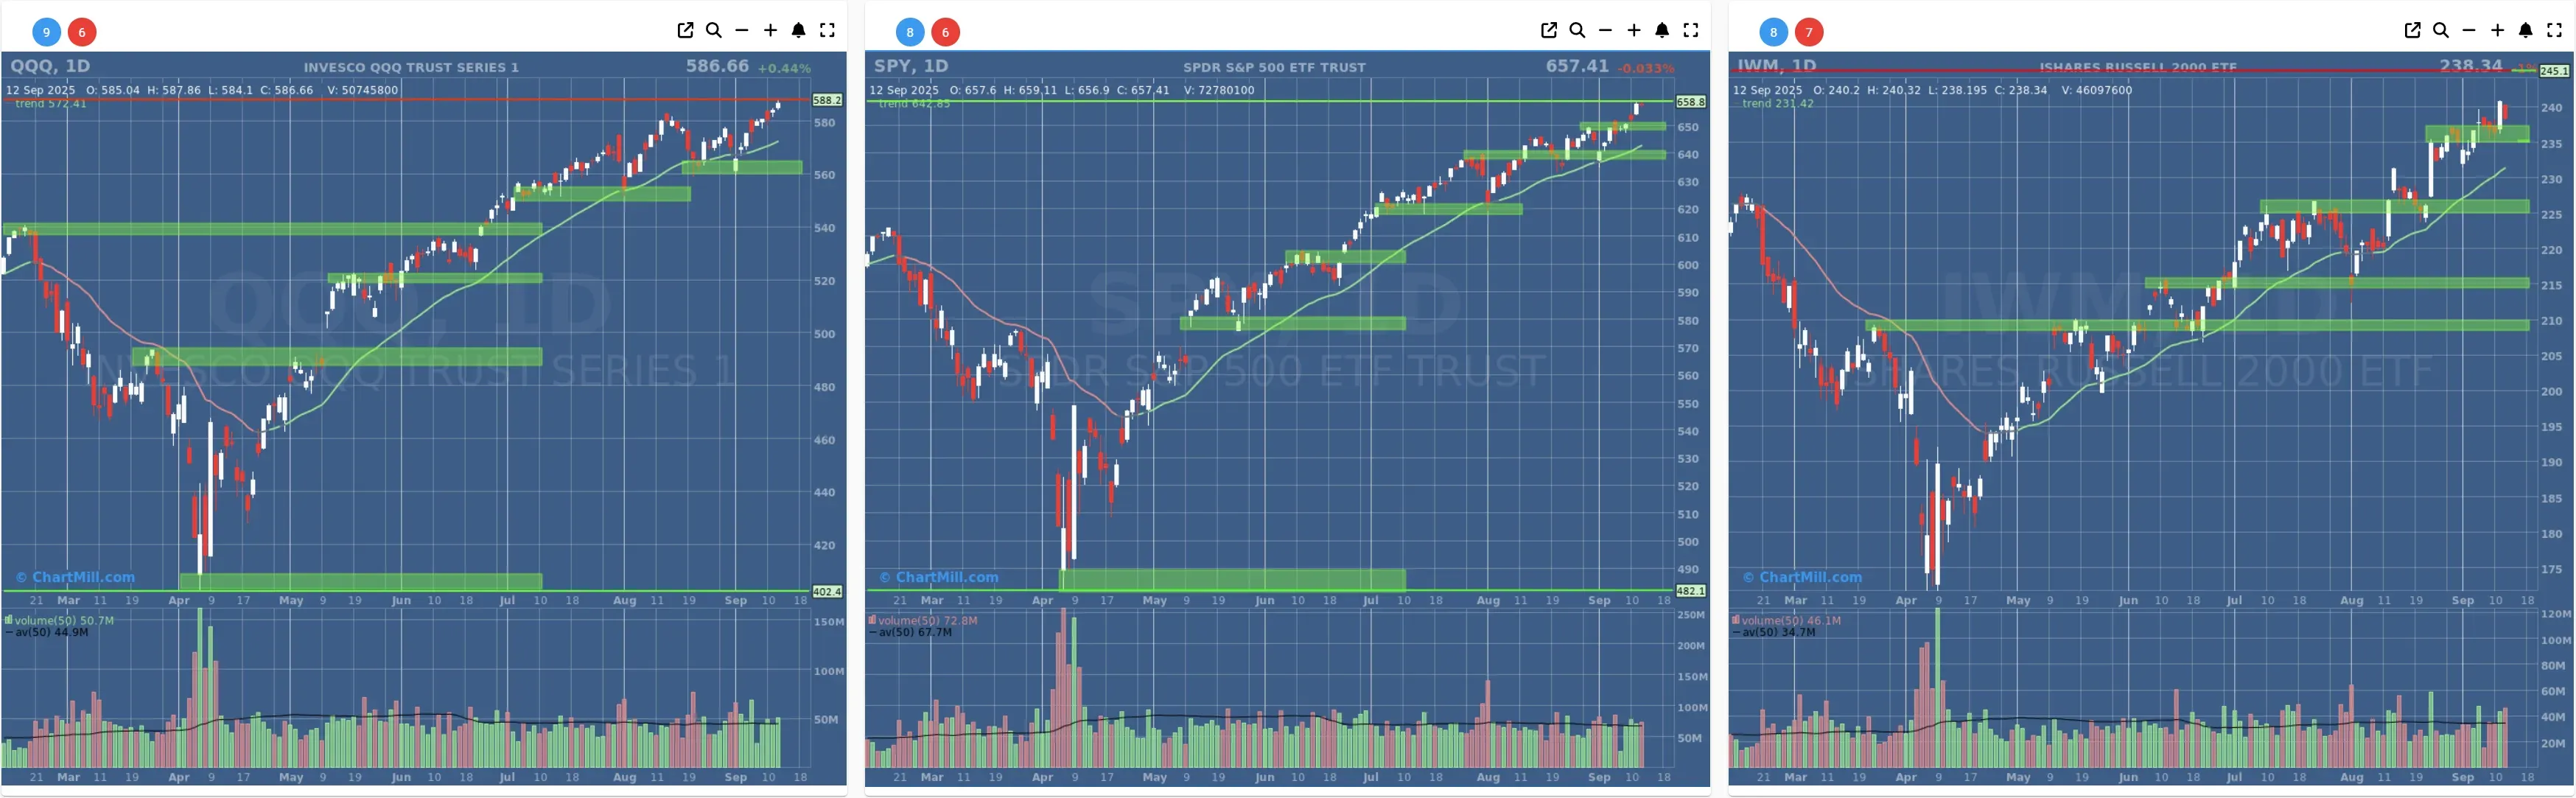
- Short-Term Trend: Positive (no change)
- Next Support at $650 - $640
- Next Resistance at ?
- Volume: Slightly Above Average (50)
- Pattern: Down Day - Intraday High
- Short-Term Trend: Positive (no change)
- Next Support at $560
- Next Resistance at ?
- Volume: Slightly Above Average (50)
- Pattern: Up Day - New High
- Short-Term Trend: Positive (no change)
- Next Support at $235
- Next Resistance at $245
- Volume: Above Average (50)
- Pattern: Down Day - Inside Day
Long Term Trend
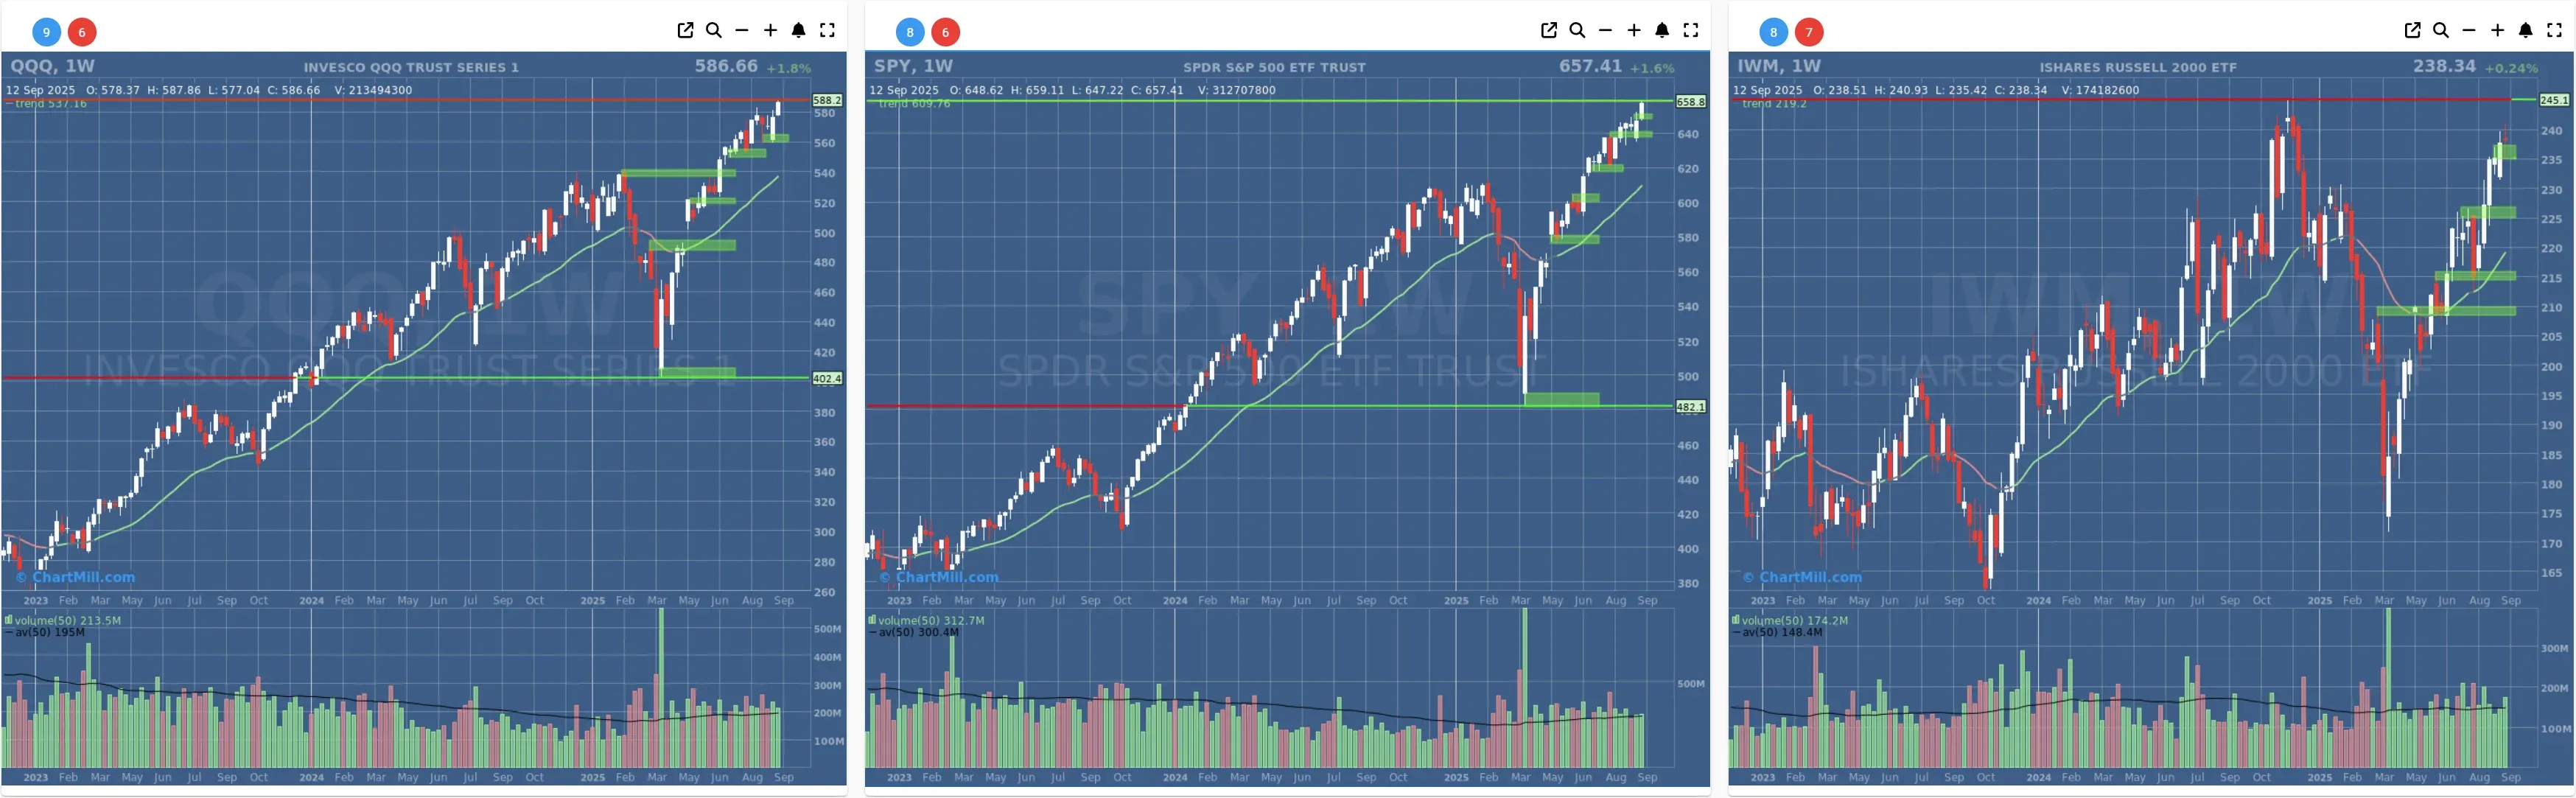
- Long-Term Trend: Positive (no change)
- Long-Term Trend: Positive (no change)
- Long-Term Trend: Positive (from neutral)
Daily Market Breadth Analysis – September 12, 2025 (After Market Close)
Following a strong rebound on Thursday, September 11, market breadth weakened sharply again on Friday, September 12, with broad-based selling pressure resuming across the board. Participation levels declined on nearly all key metrics, reversing the brief improvement seen the day before. The current trend returns to a negative footing.

After a promising bounce on September 11, when nearly 80% of stocks advanced, the optimism proved short-lived.
On September 12, advancing stocks dropped sharply to just 31.3%, while 65.7% declined, marking a return to the pattern seen earlier in the month. This shift suggests that the prior session was more of a reflexive bounce than the start of sustained improvement.
Key Observations:
Breadth Deterioration Across Timeframes:
-
Advancers (Day): Fell from 79.6% to 31.3%
-
Advancers (Week): Down to 60.4% from 71.7%
-
Advancers (Month): Modestly higher at 70.4%, but this metric remains a lagging indicator
-
Advancers (3-Month): Slight improvement to 73.6%, but without strong confirmation from short-term action
SMA Participation Weakens Again:
Despite holding reasonably well compared to prior low points, participation above short-term averages softened:
-
SMA(20)+: 68.4% (vs. 74.6%)
-
SMA(50)+: 70.2% (vs. 72.2%)
-
SMA(200)+: 63.7% (down slightly from 65.1%)
While still above early September levels, these declines reflect fragility in the market’s trend structure.
New Highs vs. New Lows:
The number of stocks hitting new highs dropped from 13.6% to 7.5%, while new lows held steady at a low 0.9%. The drop in new highs is particularly telling, as it underscores waning momentum in leadership stocks.
Pocket Pivots (PP) & Volatility Leadership:
The PP metric, which captures short-term relative strength, dropped to 35.1% from 41.4%, showing fewer stocks with near-term bullish characteristics.
The percentage of stocks up >25% over 3 months remains steady at 18.1%, though this too may face headwinds if weakness persists.
Trend Continuation or Reversal?
This sharp reversal suggests that the strong showing on Sep 11 was an outlier rather than a new trend. It echoes the same pattern seen earlier this month, where single-day strength (e.g., Sep 4) failed to generate follow-through, often being followed by renewed weakness. The underlying trend remains choppy, with no clear momentum shift in favor of the bulls.
Market participants may still be on edge due to lingering macro uncertainty or positioning ahead of next week’s data. But from a purely technical breadth standpoint, Thursday’s action tips the short-term bias back toward decline and caution.
Current Breadth Trend Rating:
Neutral
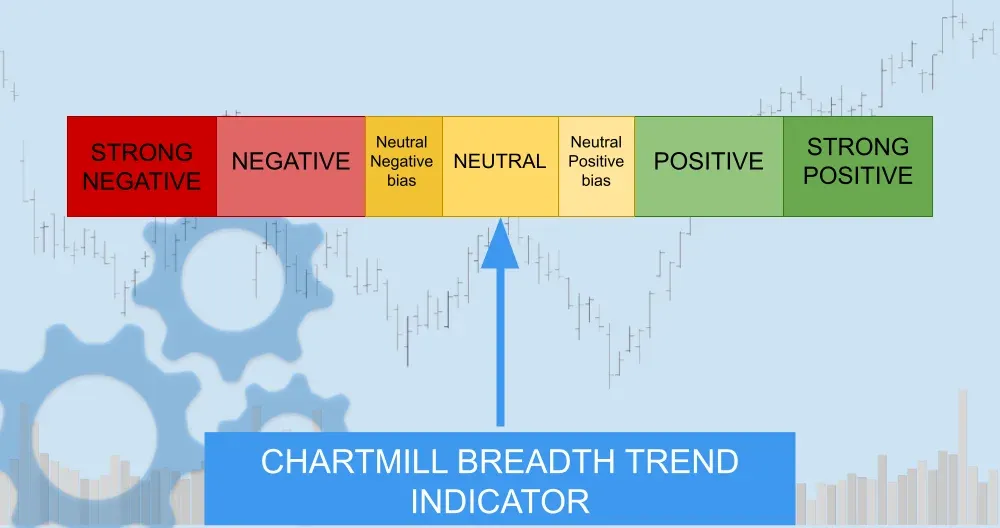
The short-term trend has lost momentum after Thursday’s broad advance, but the underlying breadth remains resilient enough to prevent a shift to a fully negative outlook.
Participation above key SMAs is still solid, longer-term advances remain above 70%, and new lows remain contained.
The inability to build on Thursday's strength adds to the sense of fragility and lack of confirmation, keeping us in neutral territory for now.
Kristoff - ChartMill
Next to read: Oracle Retreats, Fed Rate Cut Looms, and Vaccine Politics Shake Pharma Stocks