

(All data & visualisations by ChartMill.com)
Daily Market Trend Analysis – October 24, 2025 (After Market Close)
New ATH for SPY & QQQ
Short Term Trend
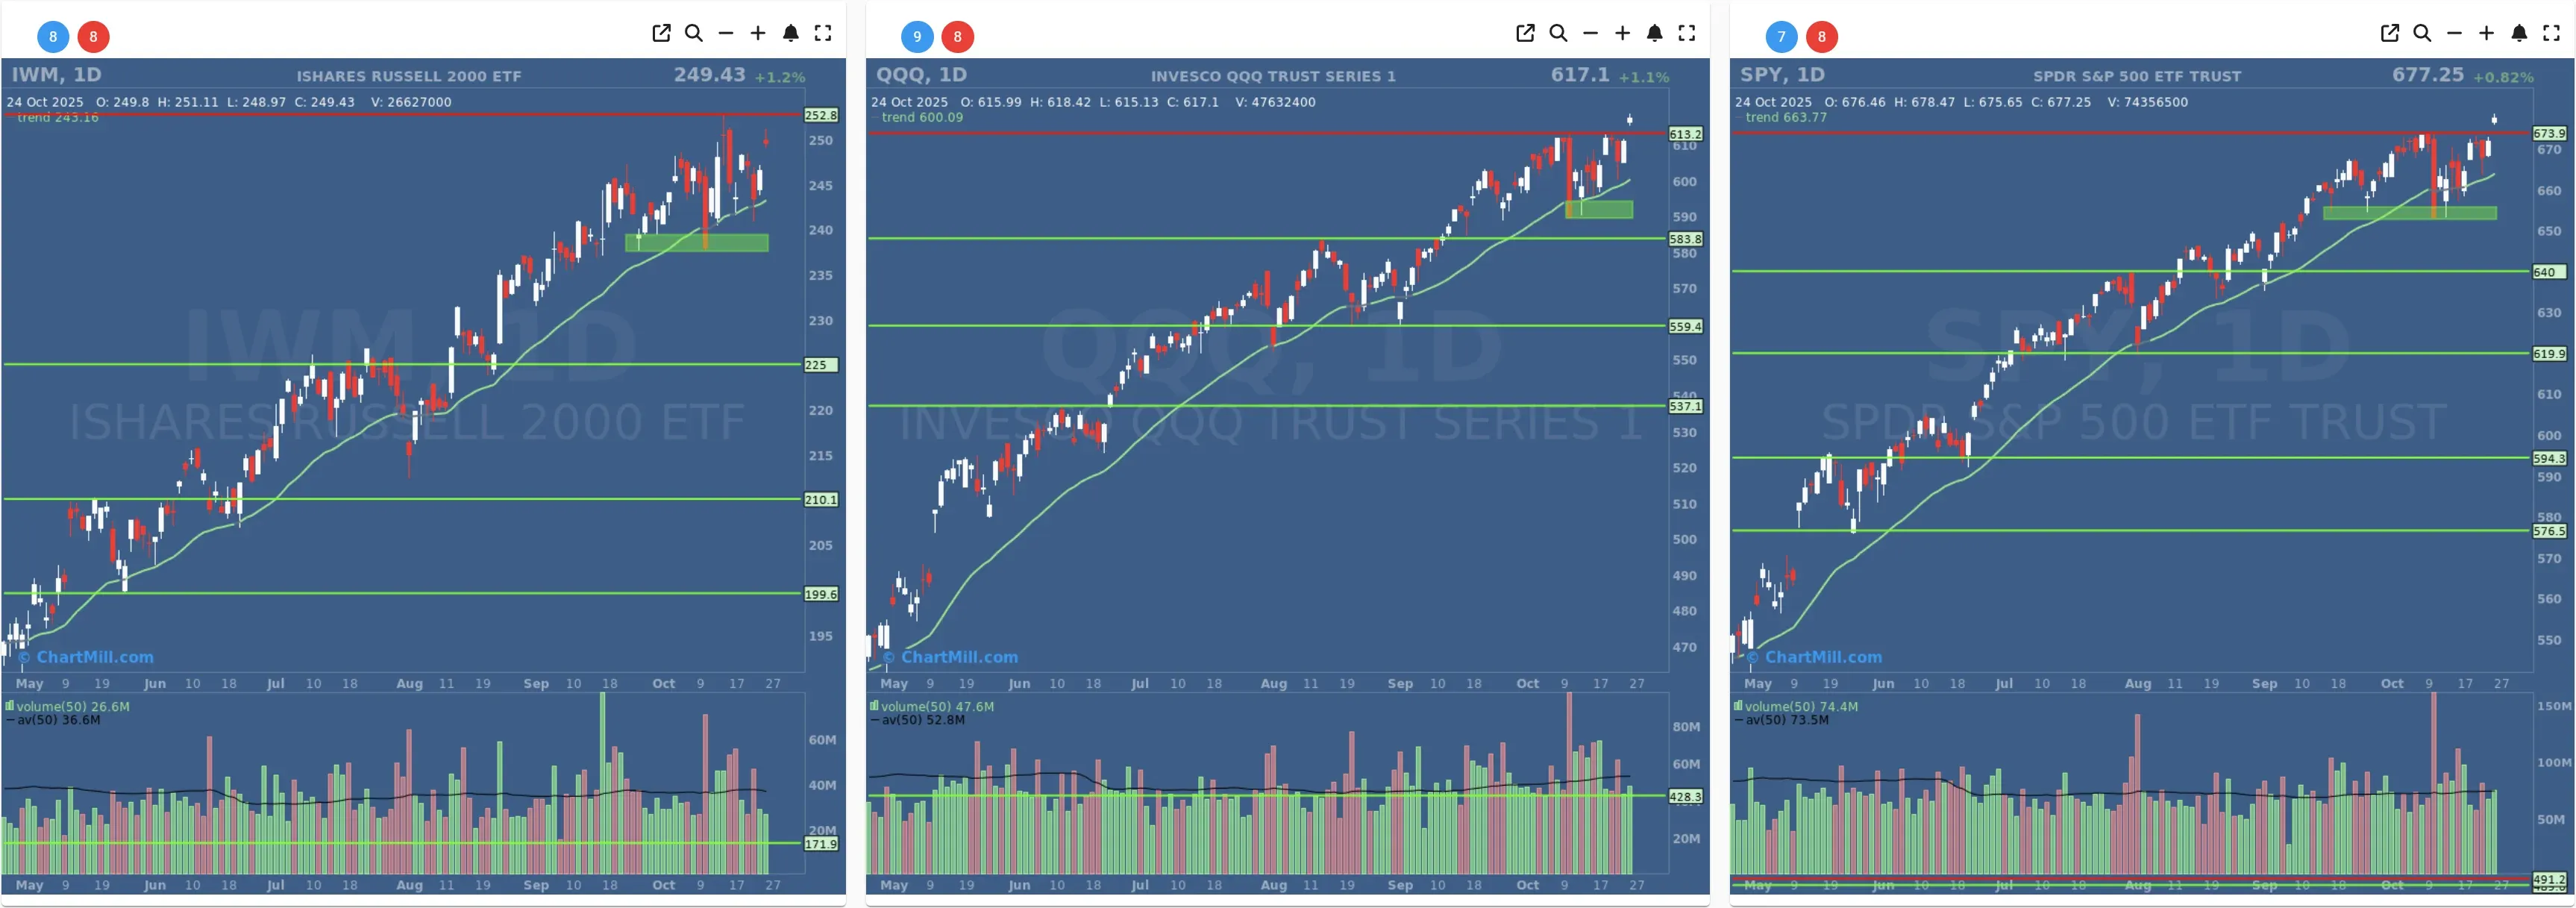
- Short-Term Trend: Positive (No Change)
- Next Support at $650 - $640
- Next Resistance at $673
- Volume: At Average (50)
- Pattern: Up Day - Gap Up - New All Time High
- Short-Term Trend: Positive (No Change)
- Next Support at $583
- Next Resistance at $611
- Volume: Slightly Below Above Average (50)
- Pattern: Up Day - Gap Up - New All Time High
- Short-Term Trend: Positive (No Change)
- Next Support at $235
- Next Resistance at $248
- Volume: Well Below Average (50)
- Pattern: Down Day - Gap up - Doji Candle
Long Term Trend
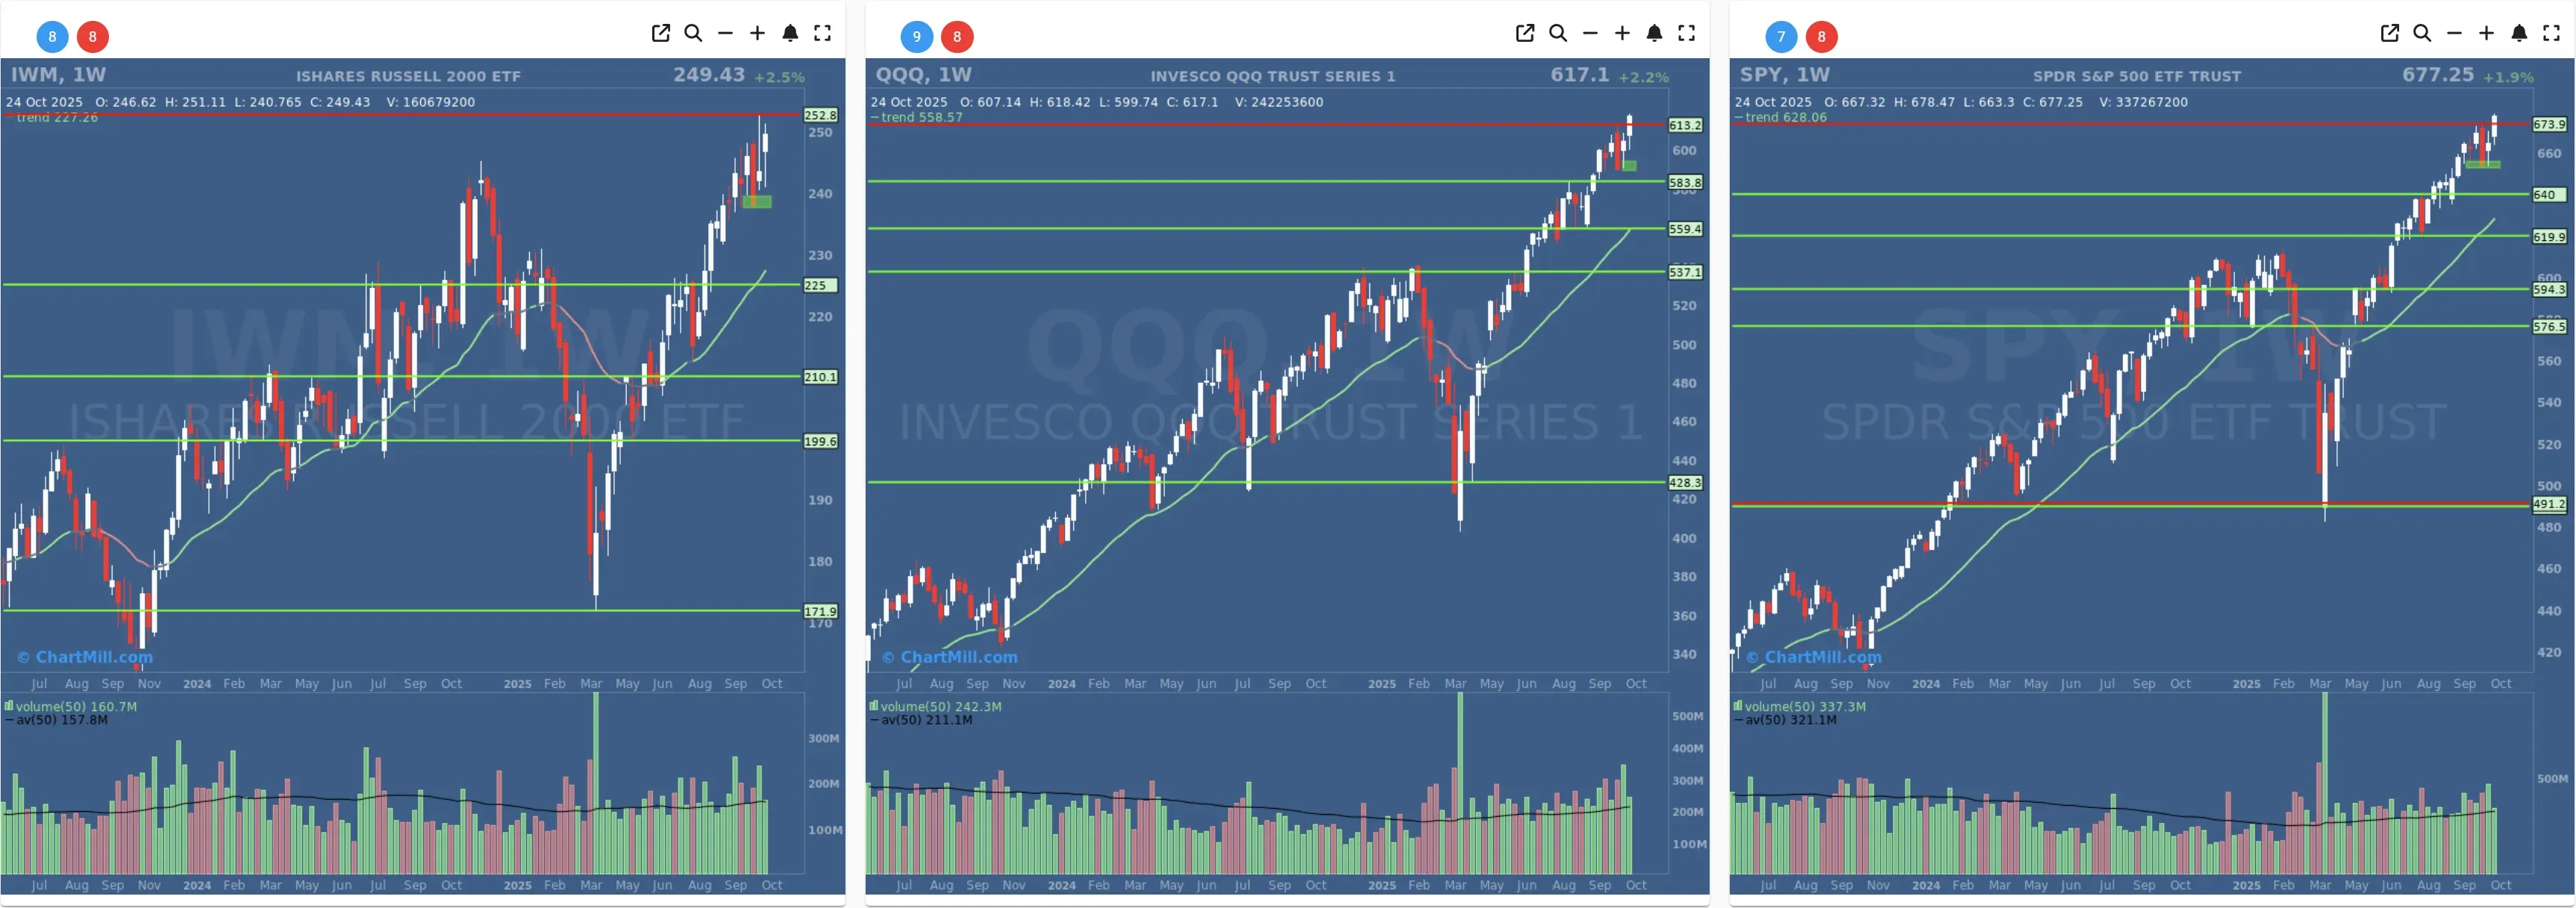
- Long-Term Trend: Positive (no change)
- Long-Term Trend: Positive (no change)
- Long-Term Trend: Positive (no change)
Daily Market Breadth Analysis – October 24, 2025 (After Market Close)
After a volatile mid-week reversal, Friday’s market breadth extended Thursday’s gains, reinforcing a short-term shift toward strength.
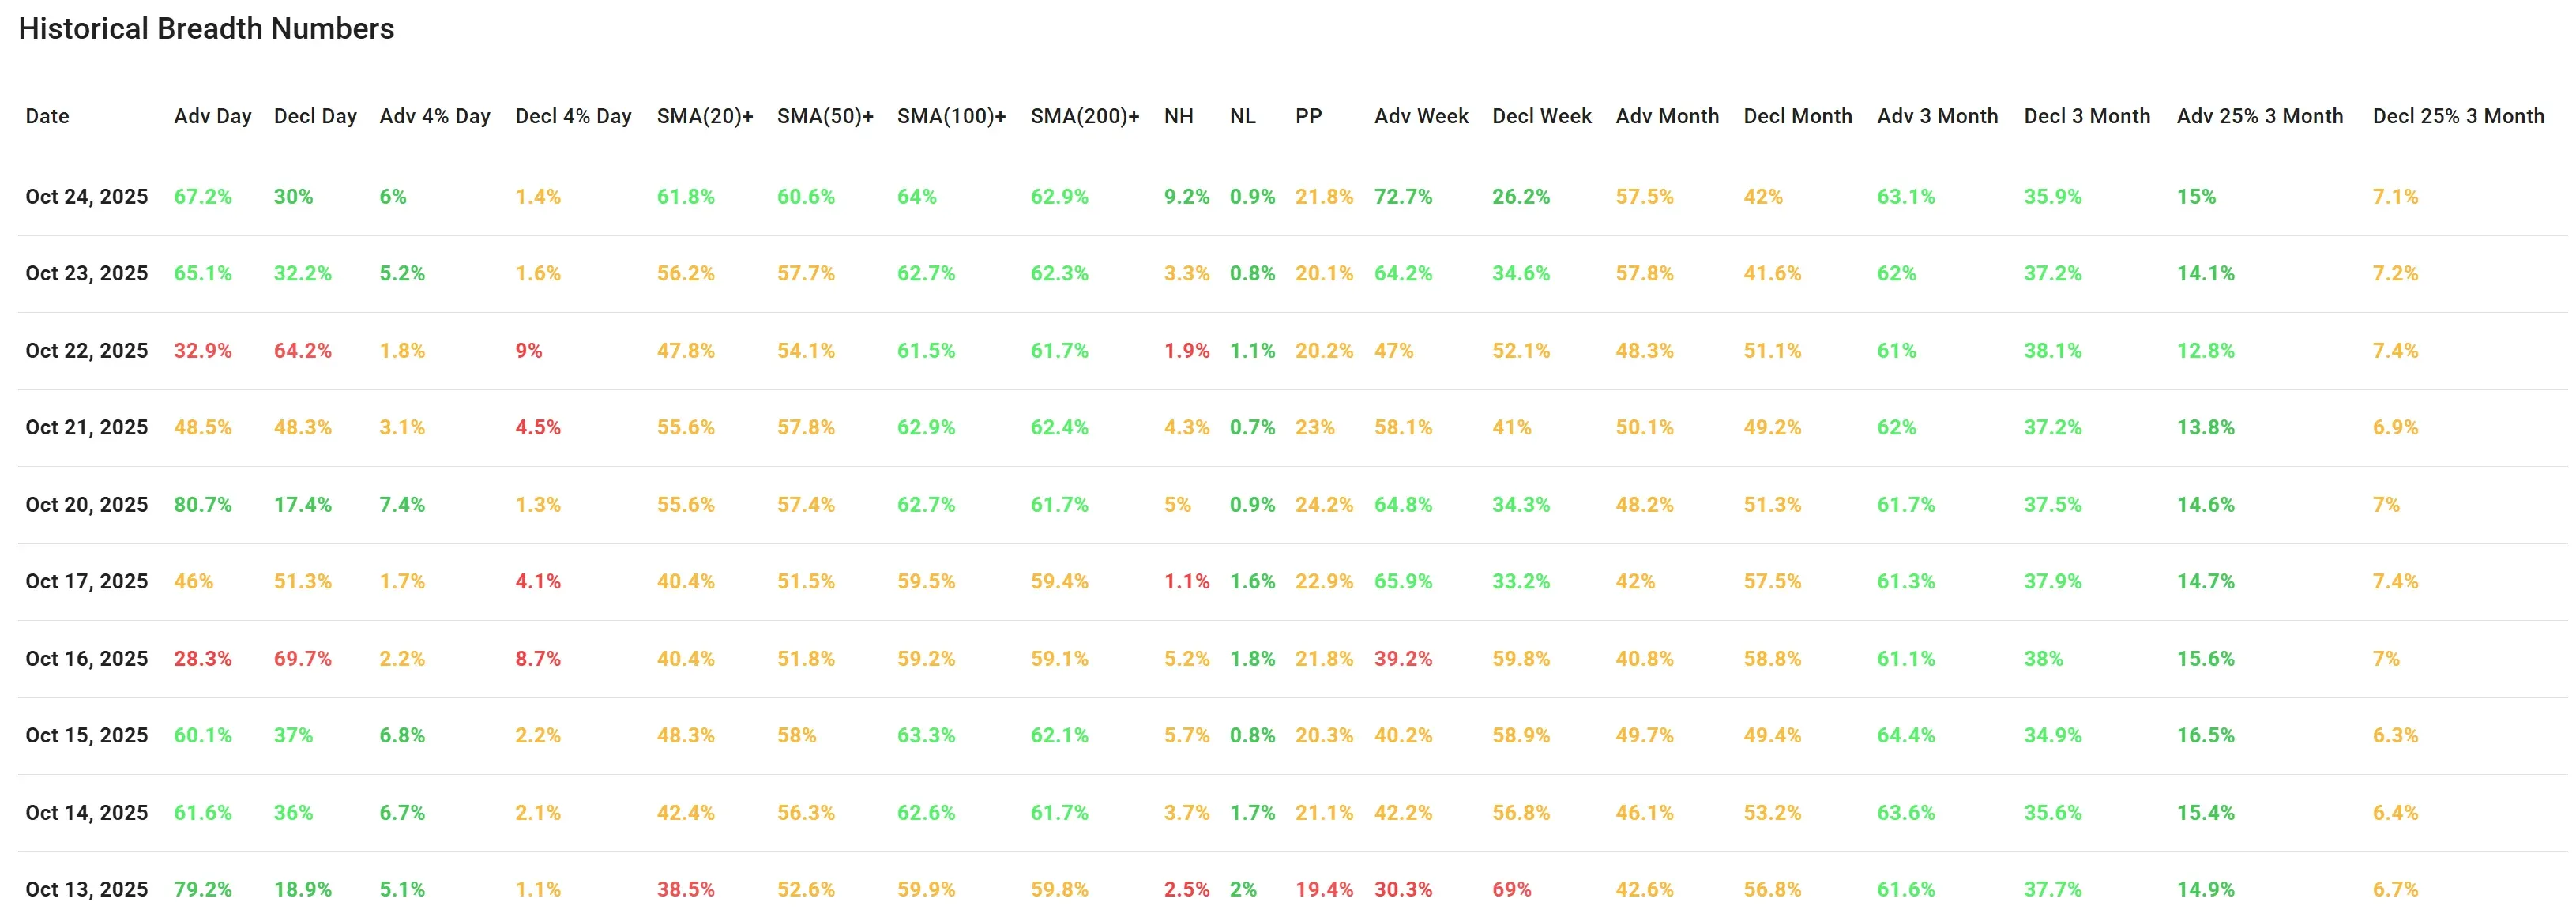
Market breadth closed out the week on a constructive note, marking a second consecutive day of strength. The percentage of advancing stocks surged to 67.2%, building on Thursday’s already strong 65.1% reading. This confirms that the sharp drop seen on Wednesday (Oct 22, when just 32.9% of stocks advanced) was short-lived and not part of a broader breakdown.
More importantly, advancing stocks with >4% daily gains rose to 6%, the highest level since October 20. This indicates growing participation from high-momentum names, a key signal of improving market internals.
Decliners continued to retreat, dropping to 30% of issues, while only 1.4% fell more than 4% — signaling limited selling pressure.
Participation above key moving averages also expanded:
-
SMA(20)+: up to 61.8% (vs 56.2% prior)
-
SMA(50)+: now at 60.6%, recovering from a low of 51.5% seen just three days earlier
-
SMA(100)+ and SMA(200)+ also showed broad-based strength at 64% and 62.9%, respectively.
The new highs (NH) indicator surged to 9.2%, the highest since Oct 13, while new lows (NL) dropped further to just 0.9%. This shift in the NH/NL balance confirms that leadership is re-emerging after a brief deterioration earlier in the week.
The percentage of stocks showing a pivot point (PP) climbed to 21.8%, another uptick reflecting momentum recovery.
On a weekly basis, breadth was clearly bullish:
-
Advancing week: 72.7%
-
Declining week: 26.2%
Monthly trends are also tilting in favor of bulls:
-
Advancing month: 57.5%
-
Declining month: 42%
3-month trend: steady at 63.1% advancing, only 35.9% declining
The only segment still showing hesitation is among the more explosive gainers. While 15% of stocks are up at least 25% over the past 3 months (a solid reading), it has yet to expand meaningfully in recent sessions.
Breadth Trend Rating: Positive
Friday’s strength confirms a shift toward improving participation and market internals, suggesting a short-term bullish turn in breadth.

Conclusion:
Breadth has clearly improved, especially in the last two sessions. Wednesday’s sharp decline now appears to have been a temporary shakeout rather than a continuation of the prior weakness. Short-term metrics are turning positive, and if this momentum holds into next week, it could signal the start of a broader recovery phase.
Kristoff - ChartMill
Next to read: Wall Street Sets New Records as Quantum Stocks and Cooling Inflation Steal the Show