

(All data & visualisations by ChartMill.com)
Daily Market Trend Analysis – October 23, 2025 (After Market Close)
QQQ & SPY close to ATH
Short Term Trend
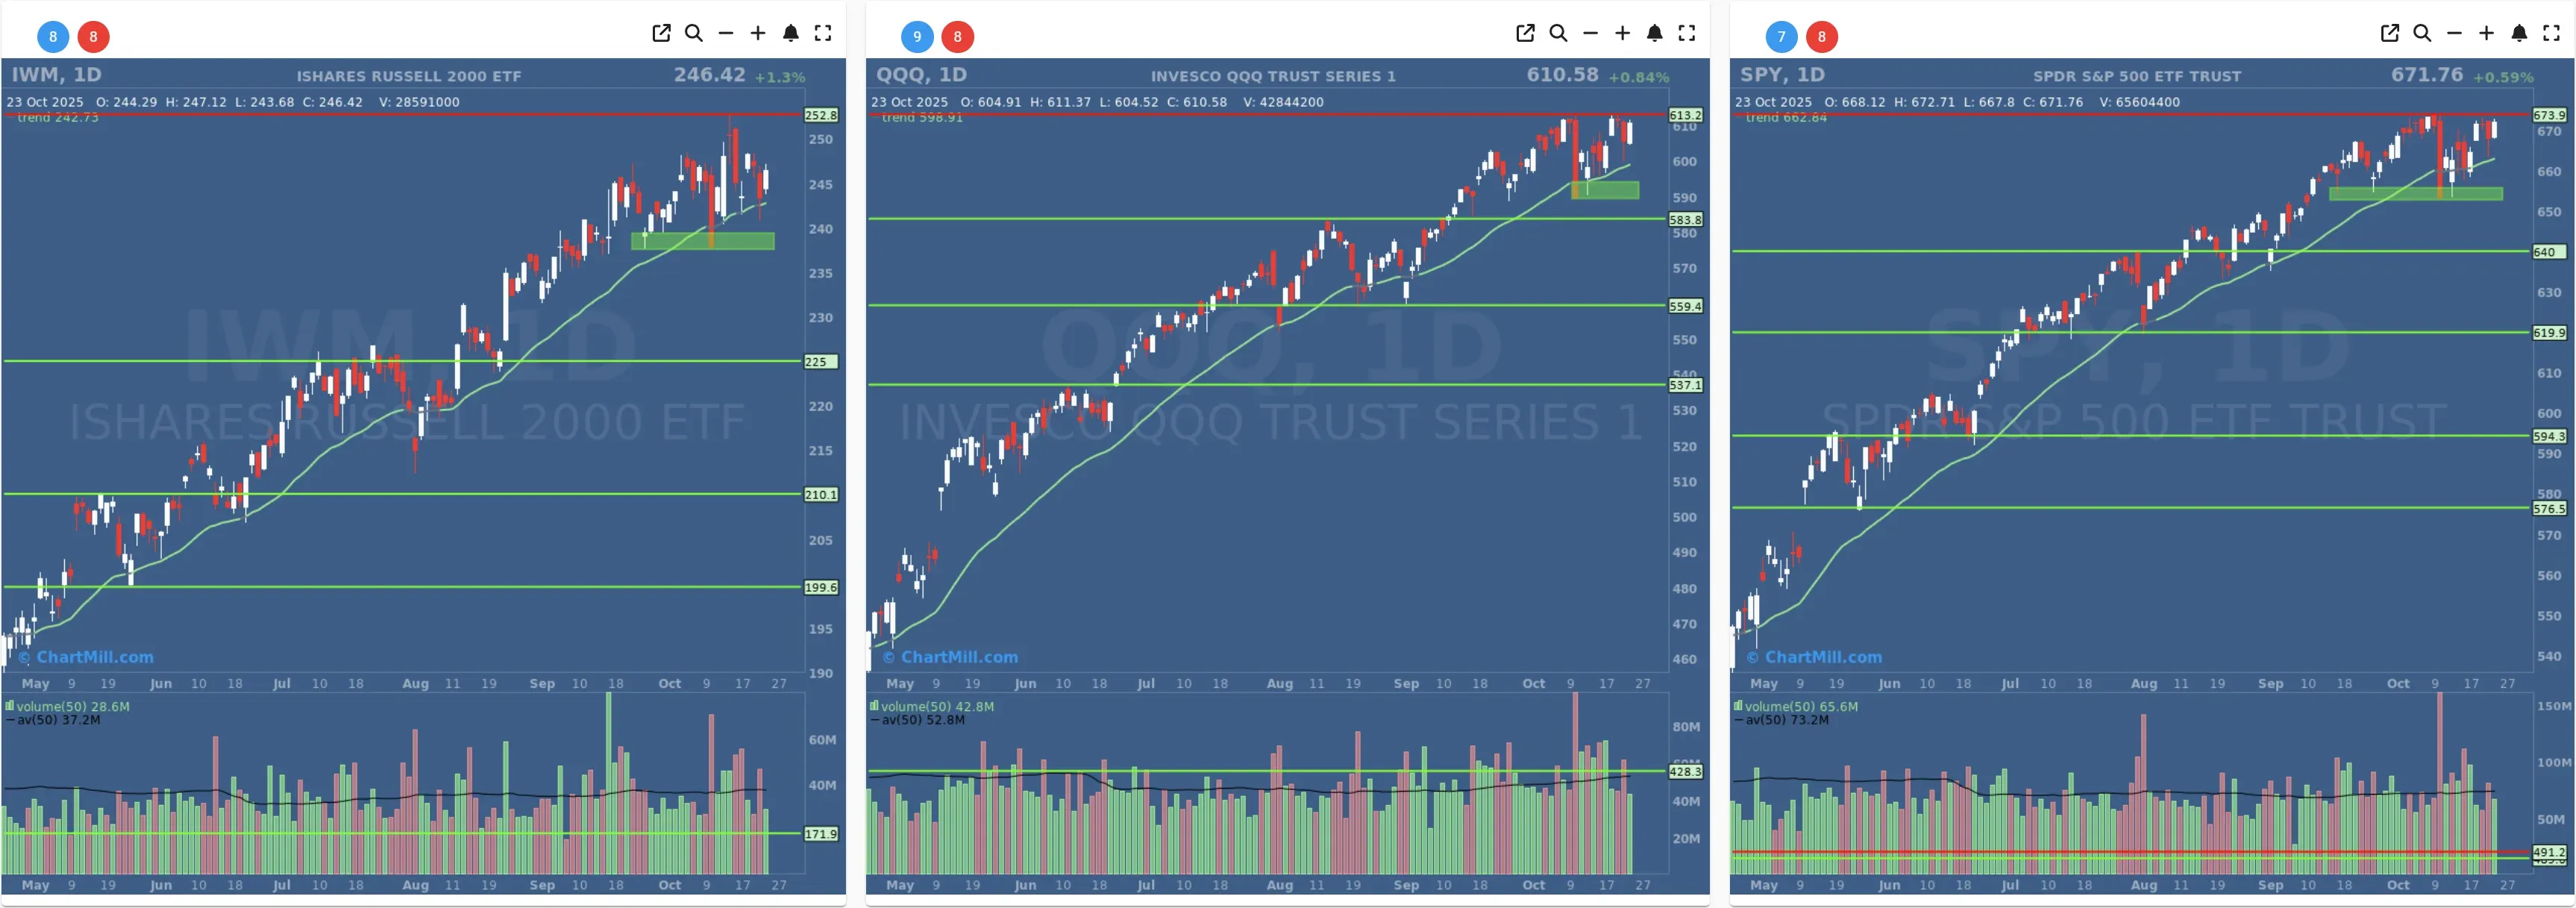
- Short-Term Trend: Positive (No Change)
- Next Support at $650 - $640
- Next Resistance at $673
- Volume: Below Above Average (50)
- Pattern: Up Day - Close to ATH - Strong Candle Close
- Short-Term Trend: Positive (No Change)
- Next Support at $583
- Next Resistance at $611
- Volume: Below Above Average (50)
- Pattern: Up Day - Close to ATH - Strong Candle Close
- Short-Term Trend: TREND CHANGE! > Positive (Up from Neutral)
- Next Support at $235
- Next Resistance at $248
- Volume: Well Below Average (50)
- Pattern: Up Day - Gap up - Strong Candle Close
Long Term Trend
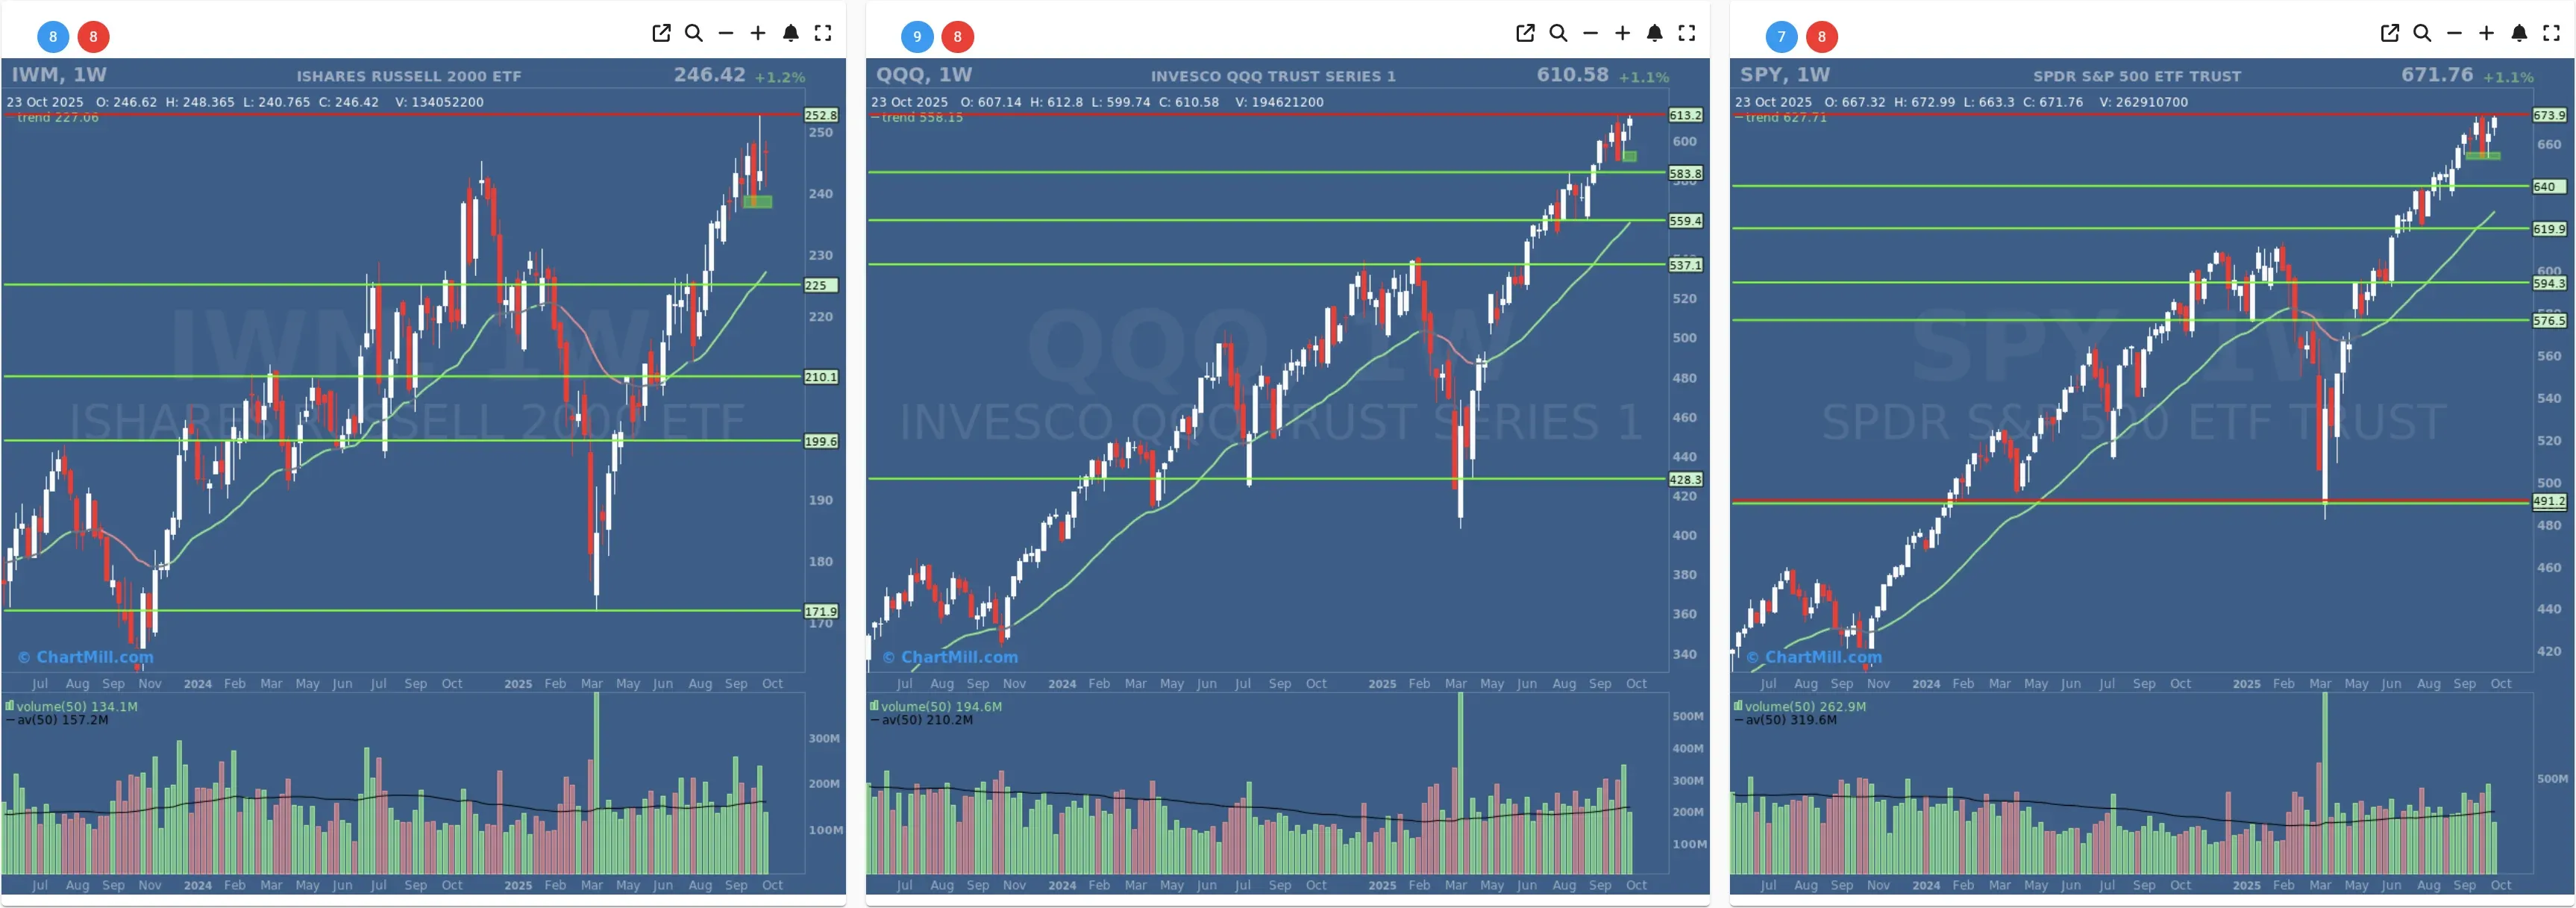
- Long-Term Trend: Positive (no change)
- Long-Term Trend: Positive (no change)
- Long-Term Trend: Positive (no change)
Daily Market Breadth Analysis – October 23, 2025 (After Market Close)
After Wednesday’s broad decline, Thursday saw a notable rebound in market breadth across nearly all metrics. Advance/Decline ratios, momentum figures, and medium-term trend metrics all turned constructive.
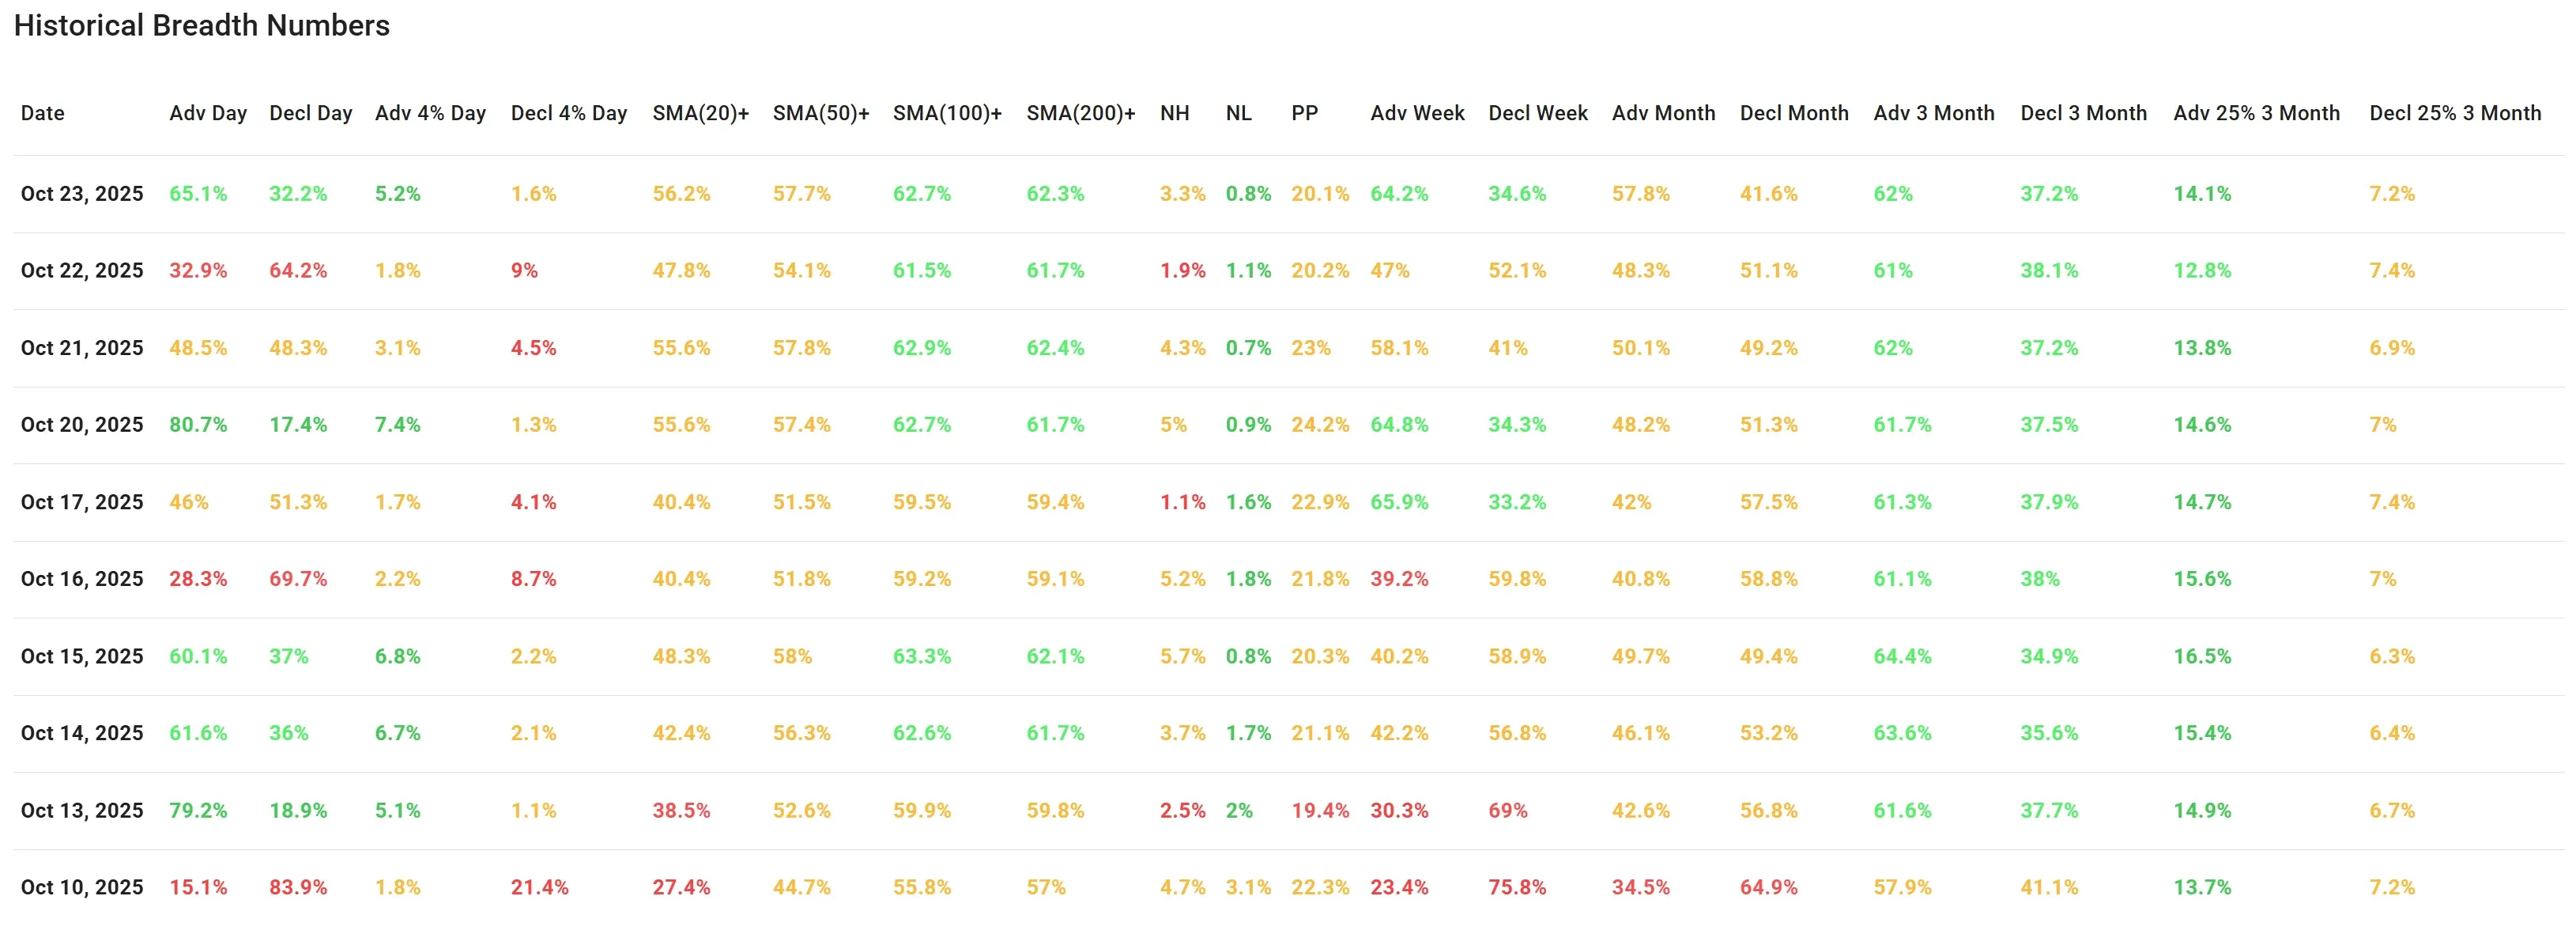
Thursday marked a decisive comeback for market breadth, with 65.1% of stocks advancing compared to only 32.2% declining. This sharp reversal follows Wednesday's weak reading where only 32.9% of stocks advanced, indicating a solid one-day turnaround.
More importantly, 5.2% of stocks rose at least 4% on the day, a significant jump compared to Wednesday’s muted 1.8%. Simultaneously, only 1.6% of stocks declined 4% or more, further highlighting the broad-based strength of the session.
Short-Term Momentum Improves
The percentage of stocks above their 20-day SMA climbed to 56.2%, up from 47.8% the day before, the highest reading since October 13.
Likewise, SMA(50)+ improved to 57.7%, SMA(100)+ to 62.7%, and SMA(200)+ to 62.3%, reflecting a continued strengthening of medium-term trend participation.
These values are now above their short-term averages, signaling a tilt toward improving momentum breadth after several choppy sessions.
New Highs vs. New Lows: Rotation Underway?
The percentage of New Highs (NH) jumped to 3.3% (up from 1.9% on Wednesday), while New Lows (NL) dropped to 0.8%.
Though both values remain low in absolute terms, the direction is notable and confirms an expansion in strength among outperforming names.
Weekly and Monthly A/D Ratios Support the Rebound
-
Advancing stocks on a weekly basis: 64.2%
-
Declining stocks on a weekly basis: 34.6%
These numbers represent the best weekly advance-decline ratio since October 20, showing broad accumulation on a multi-day basis.
The monthly trend also shifted more bullish, with 57.8% of stocks now advancing over the month, compared to 48.3% just one day earlier.
Other Notable Strength Indicators
-
Adv 25% 3 Month rose to 14.1%, showing an increasing number of stocks outperforming on a 3-month basis.
-
The Decl 25% 3 Month metric remains subdued at 7.2%, consistent with a shift away from heavy selling pressure.
Context & Interpretation
Thursday’s session decisively countered Wednesday’s weakness and restored some optimism in market breadth metrics. Several metrics now sit at or above levels from the strong advance seen on October 20, which was also marked by a robust 80% advance day.
However, it’s important to view this bounce in light of the recent volatility. The market has produced sharp swings in both directions, as seen from the alternating strong and weak sessions across the past two weeks (e.g., Oct 20 vs. Oct 22).
While the breadth rebound is promising, the underlying environment still warrants vigilance.
Breadth Trend Rating: Neutral – Positive Bias

The bounce is encouraging and breadth has improved across multiple timeframes, but the overall trend has yet to firmly break into sustained positive territory.
Caution is still warranted, but short-term momentum is improving.
Kristoff - ChartMill
Next to read: Wall Street Rises as Quantum Stocks Shine and Tesla Rebounds Despite Profit Drop