

(All data & visualisations by ChartMill.com)
Daily Market Trend Analysis – October 27, 2025 (After Market Close)
Strong Gap Ups with new ATH's for SPY and QQQ. IWM close to ATH.
Short Term Trend
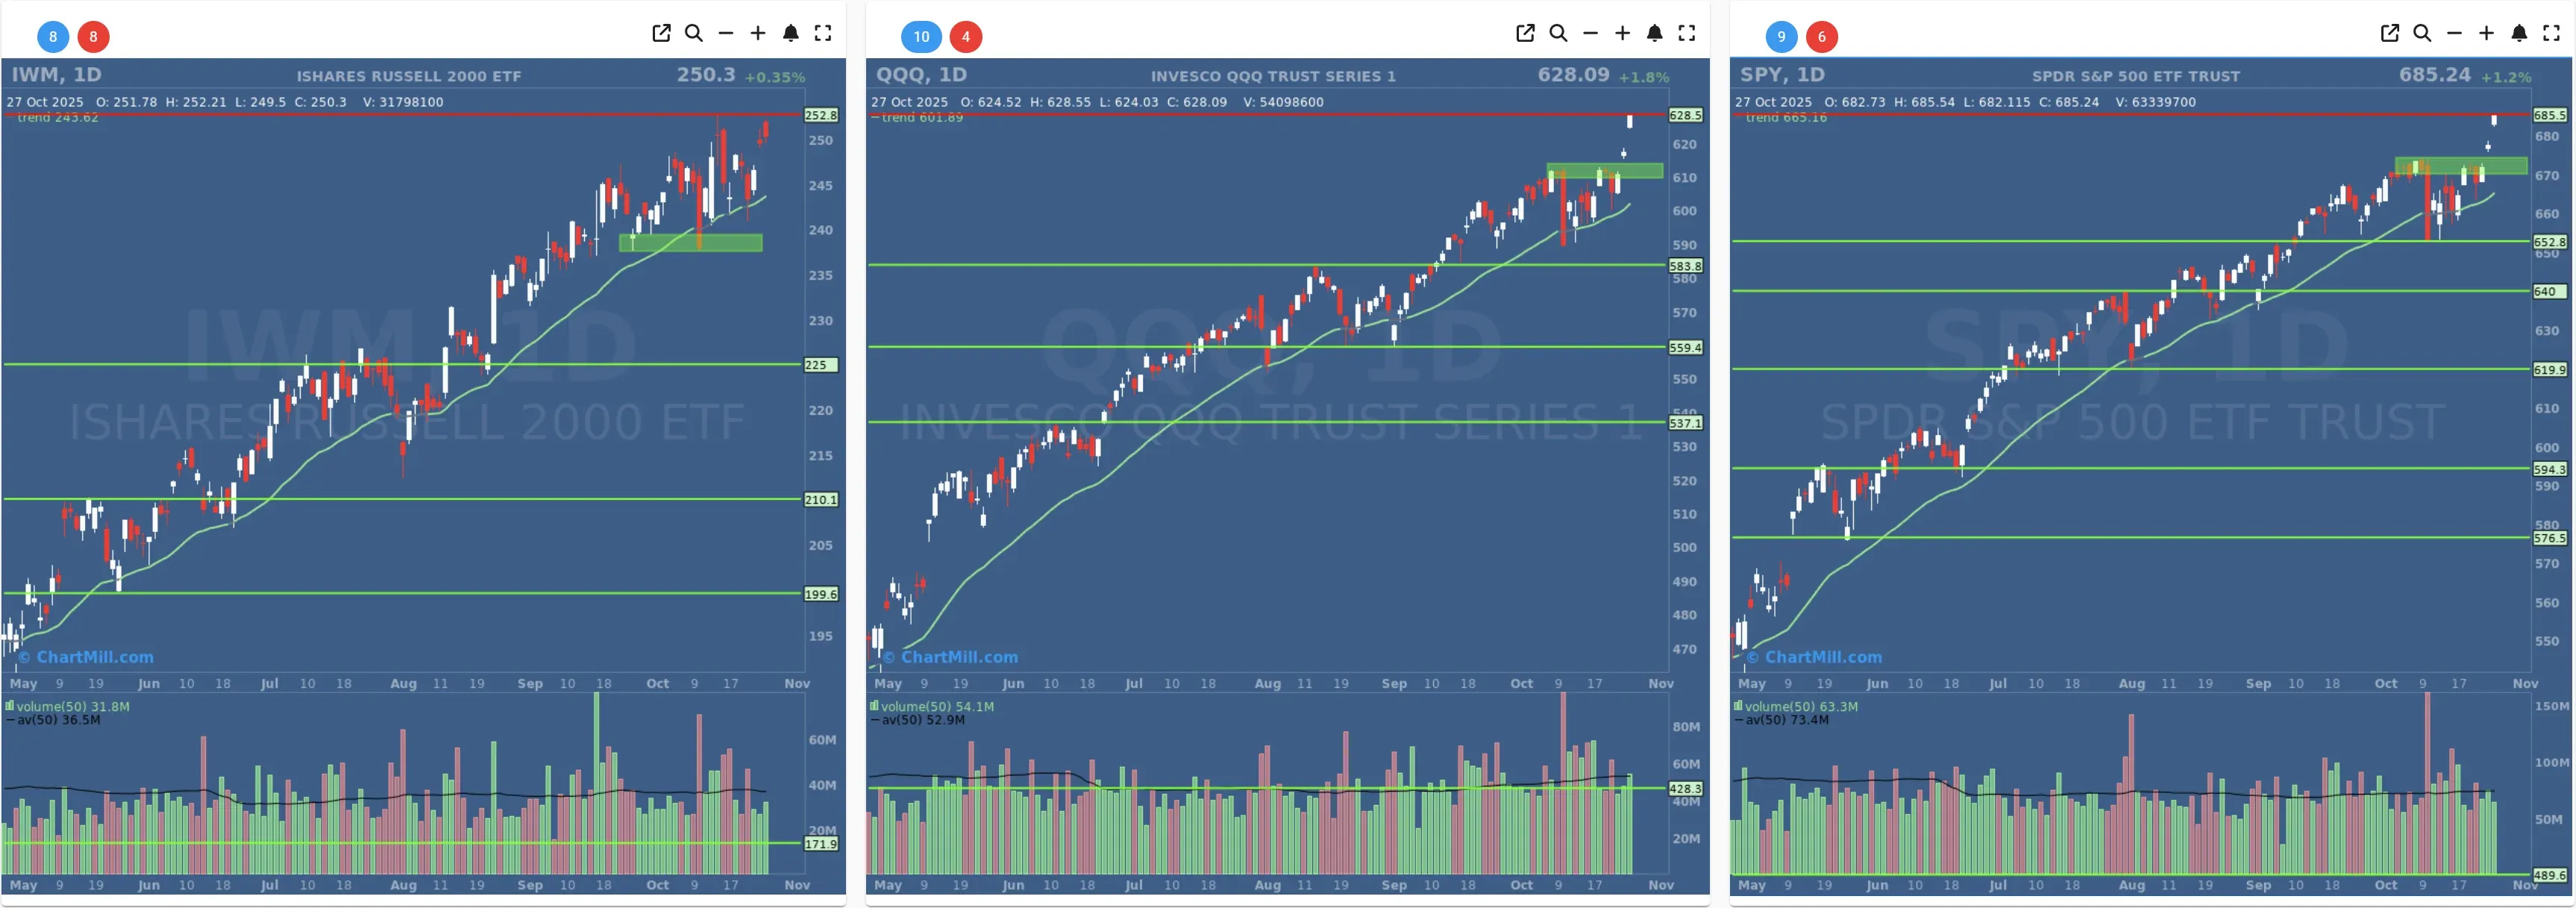
- Short-Term Trend: Positive (No Change)
- Next Support at $673
- Next Resistance /
- Volume: Slightly Below Average (50)
- Pattern: Up Day - Gap Up - New All Time High - Strong Close
- Short-Term Trend: Positive (No Change)
- Next Support at $613
- Next Resistance /
- Volume: At Average (50)
- Pattern: Up Day - Gap Up - New All Time High - Strong Close
- Short-Term Trend: Positive (No Change)
- Next Support at $235
- Next Resistance at $252
- Volume: Slightly Below Average (50)
- Pattern: Down Day - Close to All Time High
Long Term Trend

- Long-Term Trend: Positive (no change)
- Long-Term Trend: Positive (no change)
- Long-Term Trend: Positive (no change)
Daily Market Breadth Analysis – October 27, 2025 (After Market Close)
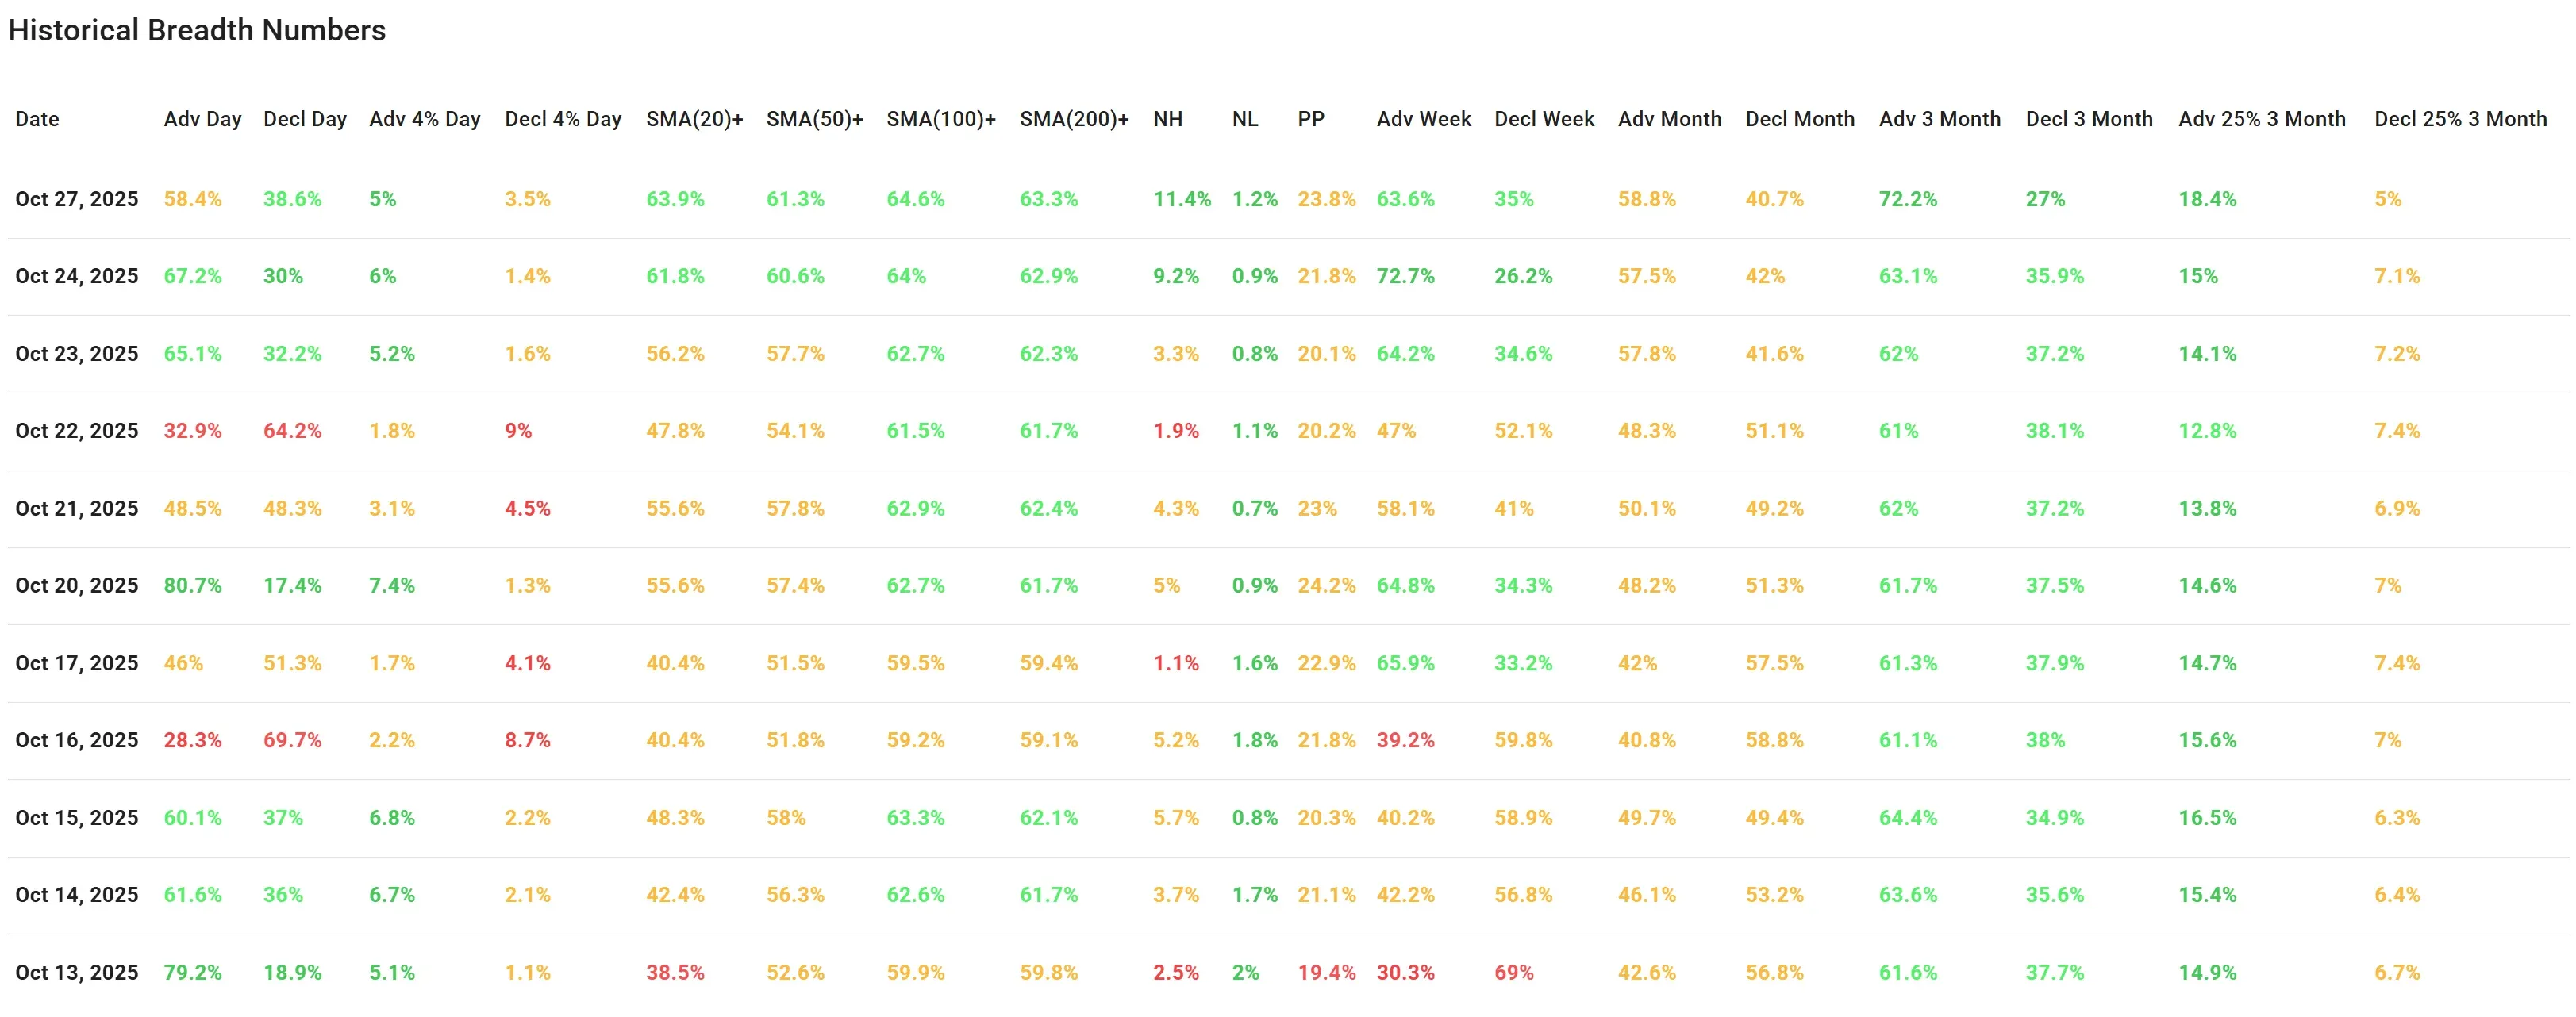
After a strong advance on October 24, the market breadth on Monday moderated significantly. Although the majority of indicators still show a favorable bias, especially when viewed in context of the past 10 trading days, there are clear signs of slowing momentum.
Daily Advancers vs. Decliners
-
Advancing stocks declined from 67.2% to 58.4%.
-
Declining stocks rose from 30% to 38.6%.
Despite the drop, net breadth remains positive, and the number of stocks gaining more than 4% (5%) still outpaced those dropping more than 4% (3.5%).
This pullback in advancing issues comes after three consecutive strong breadth days, hinting at some profit-taking or caution entering the market.
Trend Participation: SMA Metrics
The percentage of stocks trading above short- and long-term moving averages continues to rise:
-
SMA(20)+: 63.9% → up from 61.8%
-
SMA(50)+: 61.3% → up from 60.6%
-
SMA(100)+: 64.6% → up from 64%
-
SMA(200)+: 63.3% → up from 62.9%
These are constructive developments, indicating that more stocks are regaining longer-term technical strength. The gains, however, are modest—consistent with breadth slowing, not accelerating.
Highs and Lows (NH/NL)
-
New Highs (NH) rose to 11.4%—the highest in the last 10 sessions.
-
New Lows (NL) stayed extremely low at 1.2%.
-
The increasing NH/NL spread is a bright spot, showing stronger leadership returning. But again, the magnitude of improvement is limited.
Weekly and Monthly Breadth
-
Advance/Decline on a weekly basis: 63.6% advancers vs. 35% decliners — a continued improvement from Friday.
-
Monthly breadth also remains solid with 58.8% advancers vs. 40.7% decliners.
While strong, this data is backward-looking and mostly reflects the broad advance from October 20–24.
3-Month Breadth
-
Adv 3M: 72.2% — the highest in the dataset.
-
Decl 3M: 27% — lowest in the dataset.
-
Adv 25% 3M: 18.4%
-
Decl 25% 3M: 5%
Longer-term breadth remains strongly supportive of a broader recovery trend, though the gains were largely concentrated in the most recent sessions.
Conclusion
Market breadth remains clearly positive. Although Monday didn’t replicate Friday’s surge, it added confirmation to an already improving trend. More stocks are above key moving averages, new highs are expanding, and the strength is evident across multiple timeframes.
While the rate of change may be slowing, there’s no sign of deterioration, only consolidation. The market appears to be catching its breath after a strong thrust higher, and breadth is behaving accordingly.
Breadth Trend Rating: Positive

The overall setup continues to favor the bulls, with a solid base of participation and expanding technical strength across the board.
Kristoff - ChartMill
Next to read: Wall Street Soars as Qualcomm Ignites the AI Race