

(All data & visualisations by ChartMill.com)
Daily Market Trend Analysis – September 11, 2025 (After Market Close)
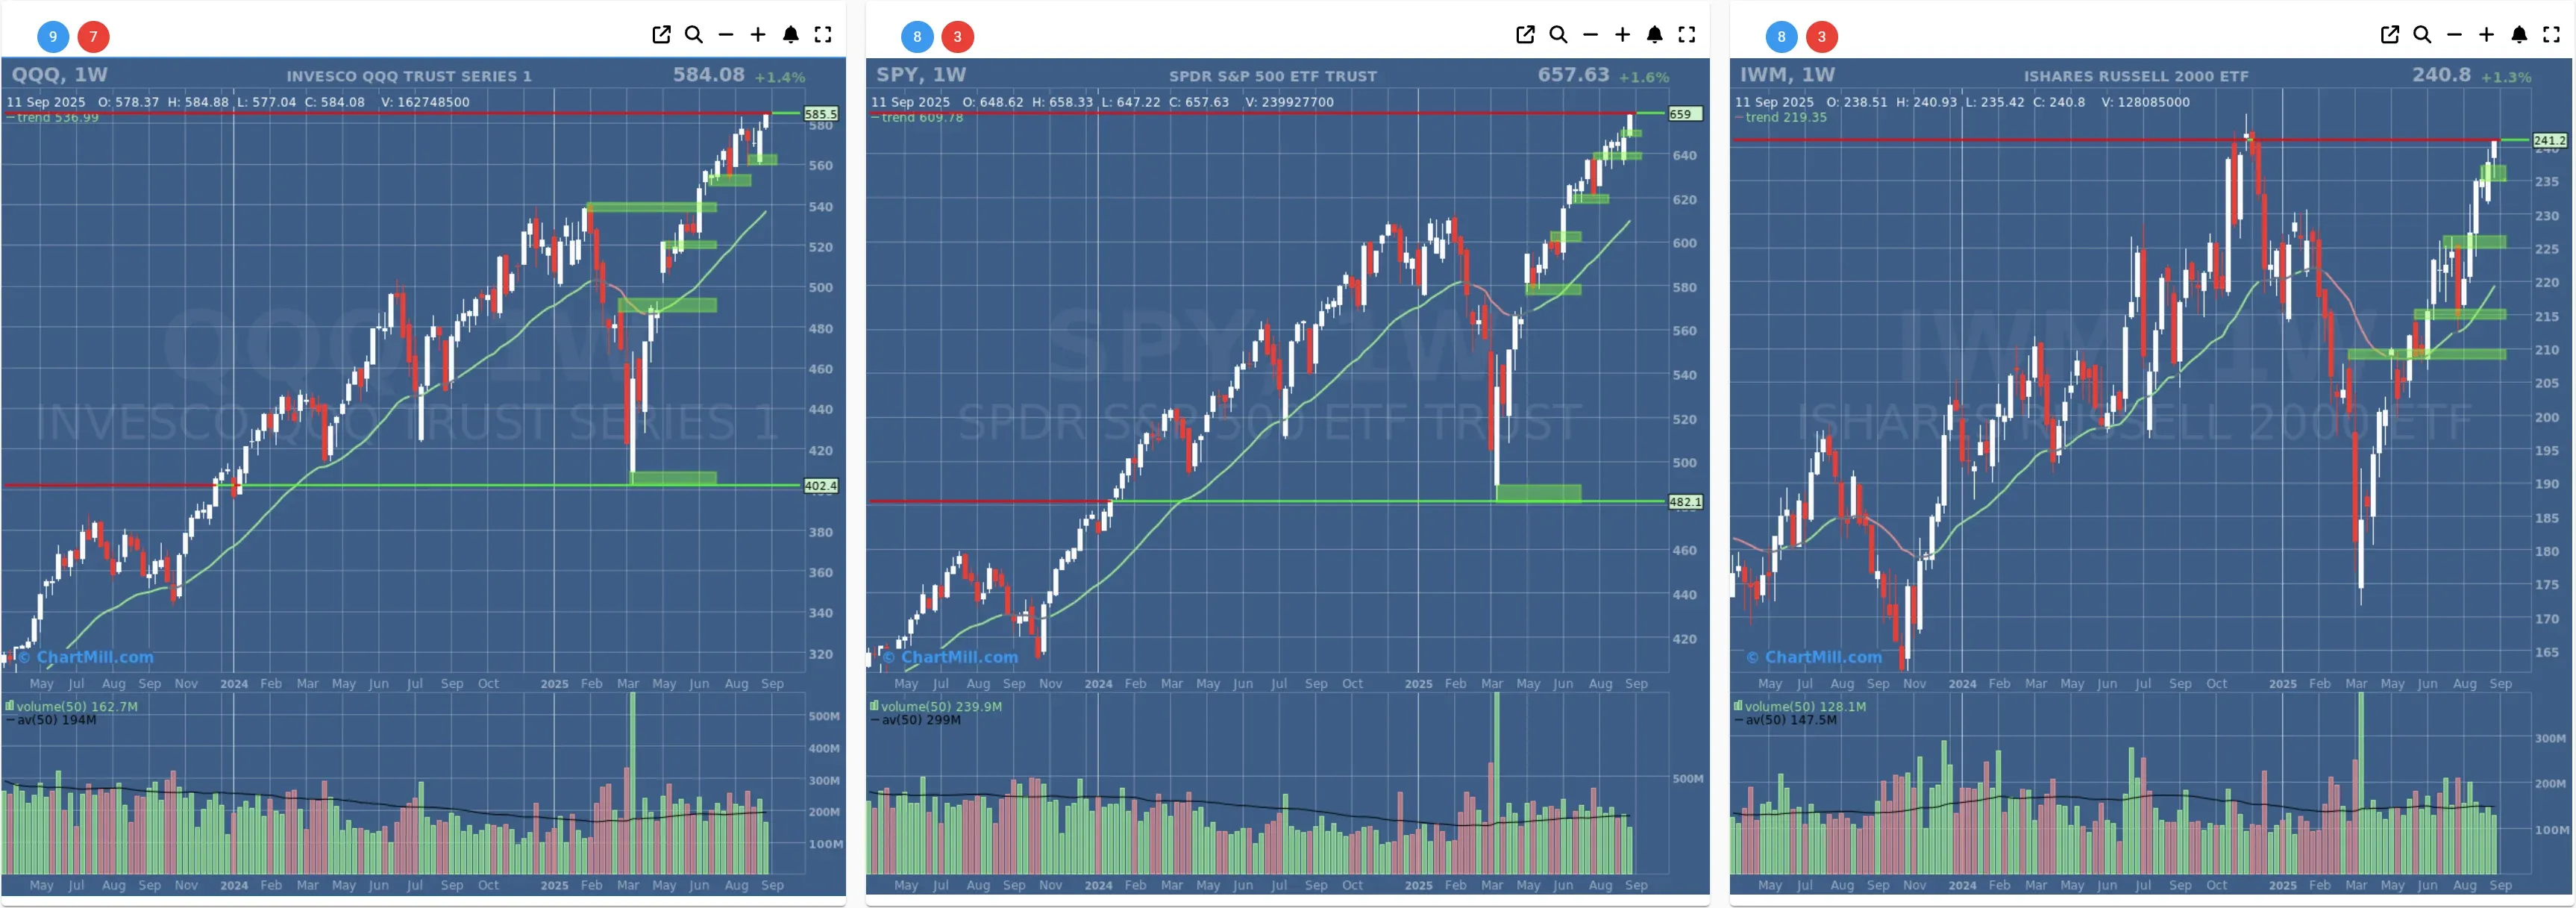
New All Time Highs for SPY and QQQ, IWM getting closer...
Short Term Trend

- Short-Term Trend: Positive (no change)
- Next Support at $650 - $640
- Next Resistance at ?
- Volume: At Average (50)
- Pattern: Up Day - New High - Strong Candle Close
- Short-Term Trend: Positive (no change)
- Next Support at $560
- Next Resistance at ?
- Volume: At Average (50)
- Pattern: Up Day - New High - Doji Candle
- Short-Term Trend: Positive (no change)
- Next Support at $235
- Next Resistance at $245
- Volume: Above Average (50)
- Pattern: Up Day - New High - Close to All Time High
Long Term Trend
- Long-Term Trend: Positive (no change)
- Long-Term Trend: Positive (no change)
- Long-Term Trend: Positive (from neutral)
Daily Market Breadth Analysis – September 11, 2025 (After Market Close)
Market breadth surged across the board on Thursday, with strength not just in advancing stocks but also in momentum and long-term trend participation. Compared to Wednesday’s neutral reading, this marks a decisive shift toward risk-on behavior in equities.

Advancing Stocks Dominate
-
Adv Day surged to 79.6%, the strongest reading in the past 10 trading days and a sharp rebound from Wednesday’s balanced 50/50 split.
-
Decl Day dropped to just 18.2%, showing clear risk appetite and broad participation.
-
Adv 4% Day (7.8%) was the highest since Sept 9, pointing to more stocks making meaningful upward moves, not just small gains.
Comparison to previous day (Sep 10 — Wednesday):
Wednesday’s numbers (Adv Day: 50%, Decl Day: 46.9%) reflected indecision. The sharp move on Thursday confirms a breakout from that stalemate.
Trend Participation Expands
-
Stocks above SMA(20): 74.6% (vs 63.8%)
-
Stocks above SMA(50): 72.2% (vs 68%)
-
Stocks above SMA(100): 74.1% (vs 72.2%)
-
Stocks above SMA(200): 65.1% (vs 62.6%)

This across-the-board rise in moving average participation suggests a healthy, longer-term trend building up behind the scenes. Even the 200-day average - a key benchmark for institutional investors - saw a 2.5 percentage point improvement.
New Highs Accelerate, Lows Minimal
-
New Highs (NH) jumped to 13.6% of stocks — the highest since Aug 28.
-
New Lows (NL) remained subdued at 1.1%, in line with recent levels.
This is a key bullish signal: the market is not just rising, it’s setting new highs more frequently.
Momentum Indicators Confirm Strength
-
PP (Pocket Pivots) improved to 41.4% (from 37.6%), suggesting more stocks had positive momentum setups.
-
Adv Week: 71.7% (vs 64.8%)
-
Decl Week: 27.4% (vs 34.1%)
Weekly breadth momentum also turned convincingly positive, breaking the mixed tone that lingered earlier in the week.
Medium- and Long-Term Metrics Align
-
Adv Month: 70%
-
Adv 3 Month: 74.7%
-
Adv 25% 3 Month: 18.7% (vs 17%)
These longer-term breadth readings are now moving in sync with the short-term bounce, something that hadn’t been the case in previous sessions. A rising percentage of stocks are also outperforming significantly over a 3-month window.
Risks Are Shrinking
Decl 25% 3 Month dropped slightly again to 5.3%. Although a small move, it confirms that fewer stocks are persistently underperforming, another healthy sign for bulls.
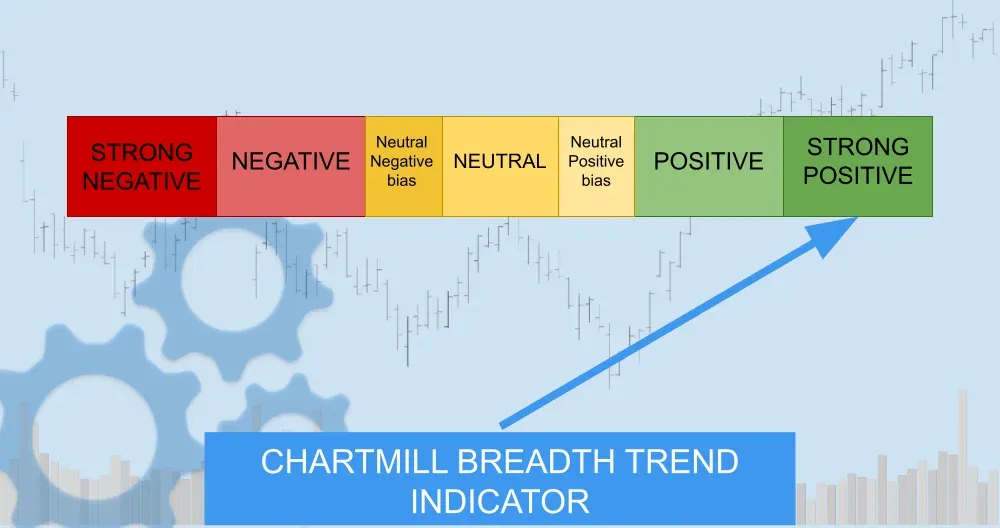
Overall Breadth Trend Rating: 5 – Very Positive
All key components - advancing volume, trend participation, new highs, and momentum - moved in the same direction, and strongly so. This alignment across timeframes gives Thursday’s move more credibility than previous bounces.
Final Thoughts:
Thursday’s breadth rally is not just statistical, it signals real rotation and increased confidence.
With more stocks now trending above their 50- and 200-day moving averages and a renewed wave of new highs, the path of least resistance in the short term appears to be up.
If this strength persists for another session or two, it could mark the beginning of a new intermediate-term trend, rather than a one-off relief rally.
Kristoff - ChartMill
Next to read: Warner Bros. Ignites Wall Street Rally Amid Merger Buzz