
Index overview – SPY, QQQ and IWM
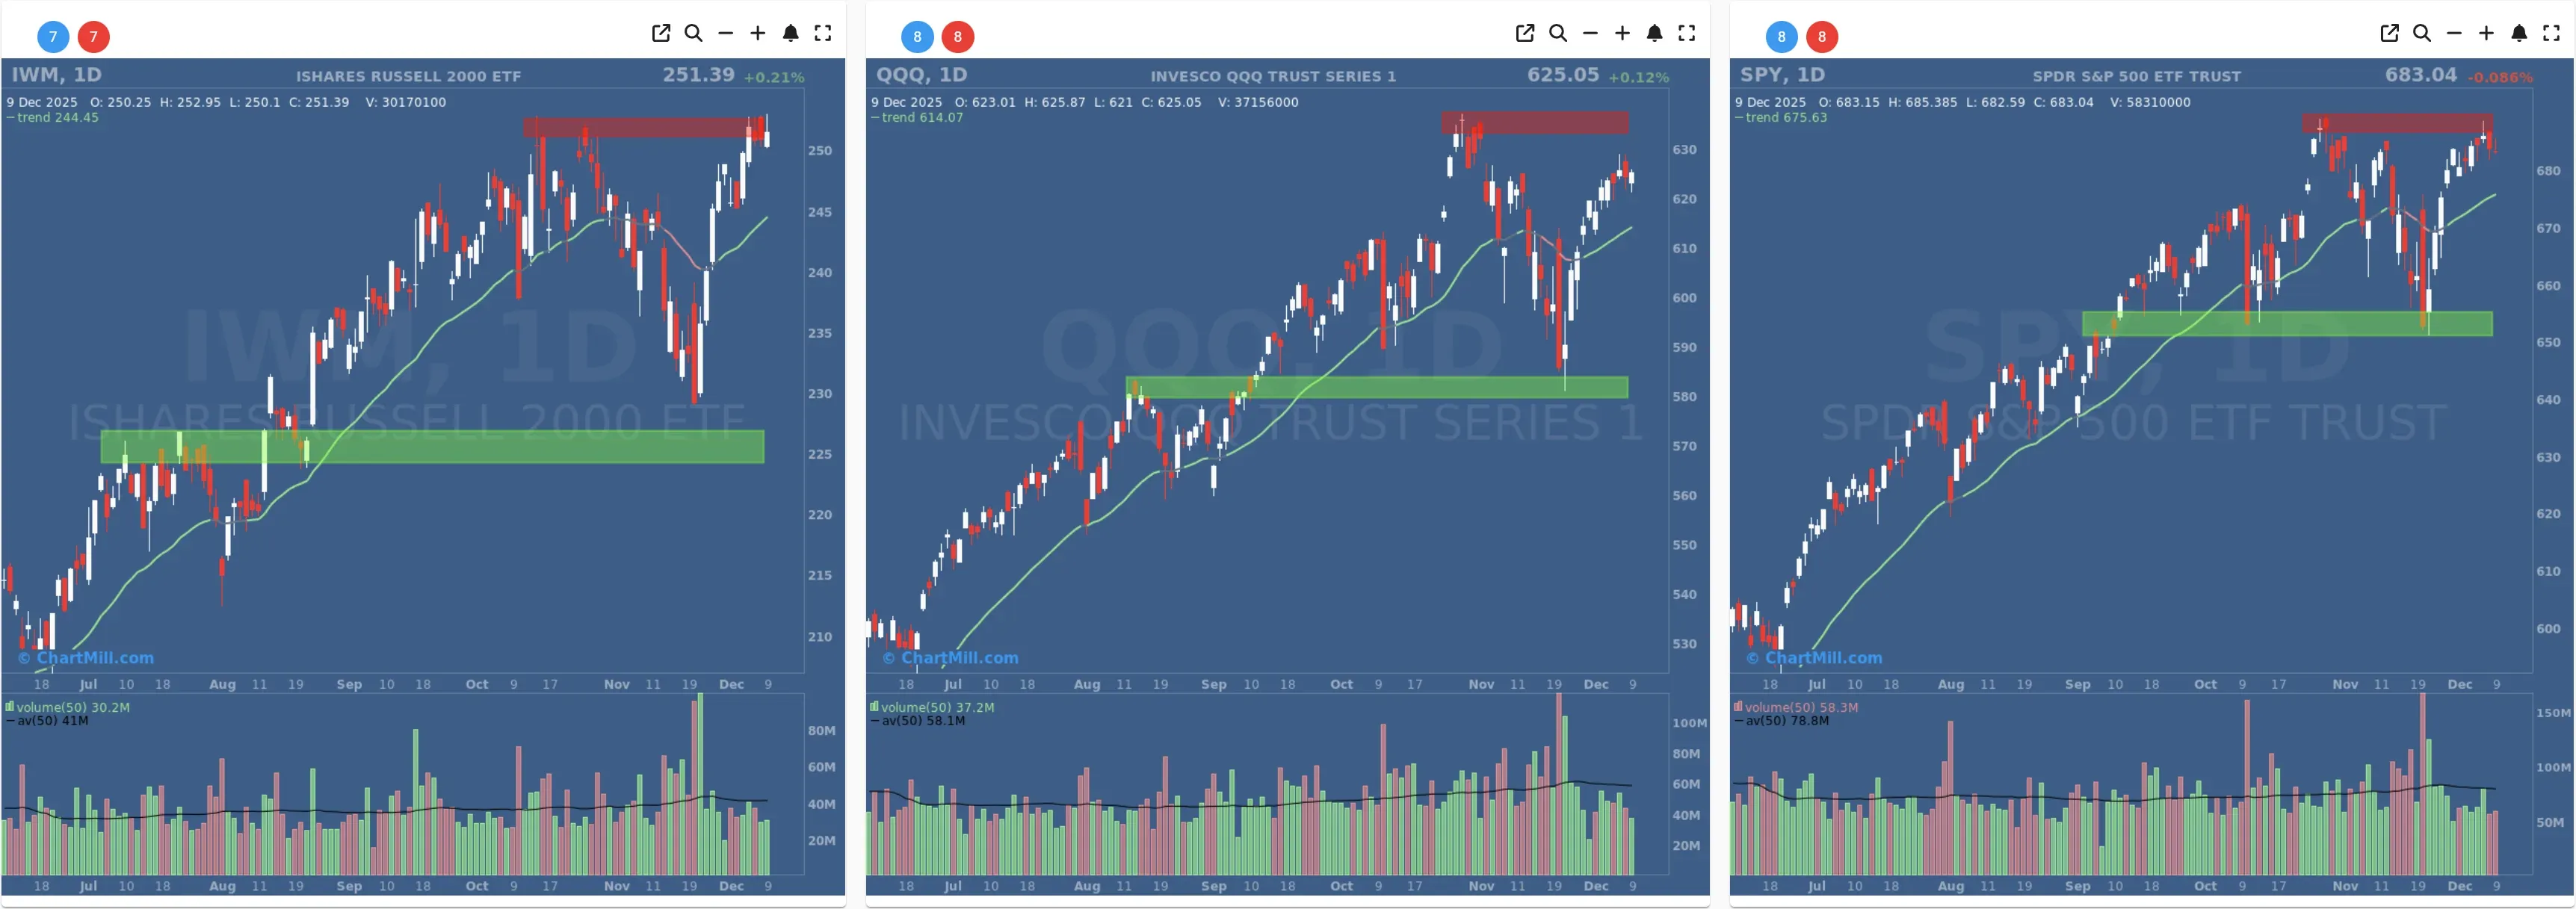
SPY slipped marginally (-0.1%), printing a small red candle but remaining near the upper end of its recent range. The ETF is holding comfortably above the green support zone (650-660) and above a firmly rising ChartMill Trend Indicator.
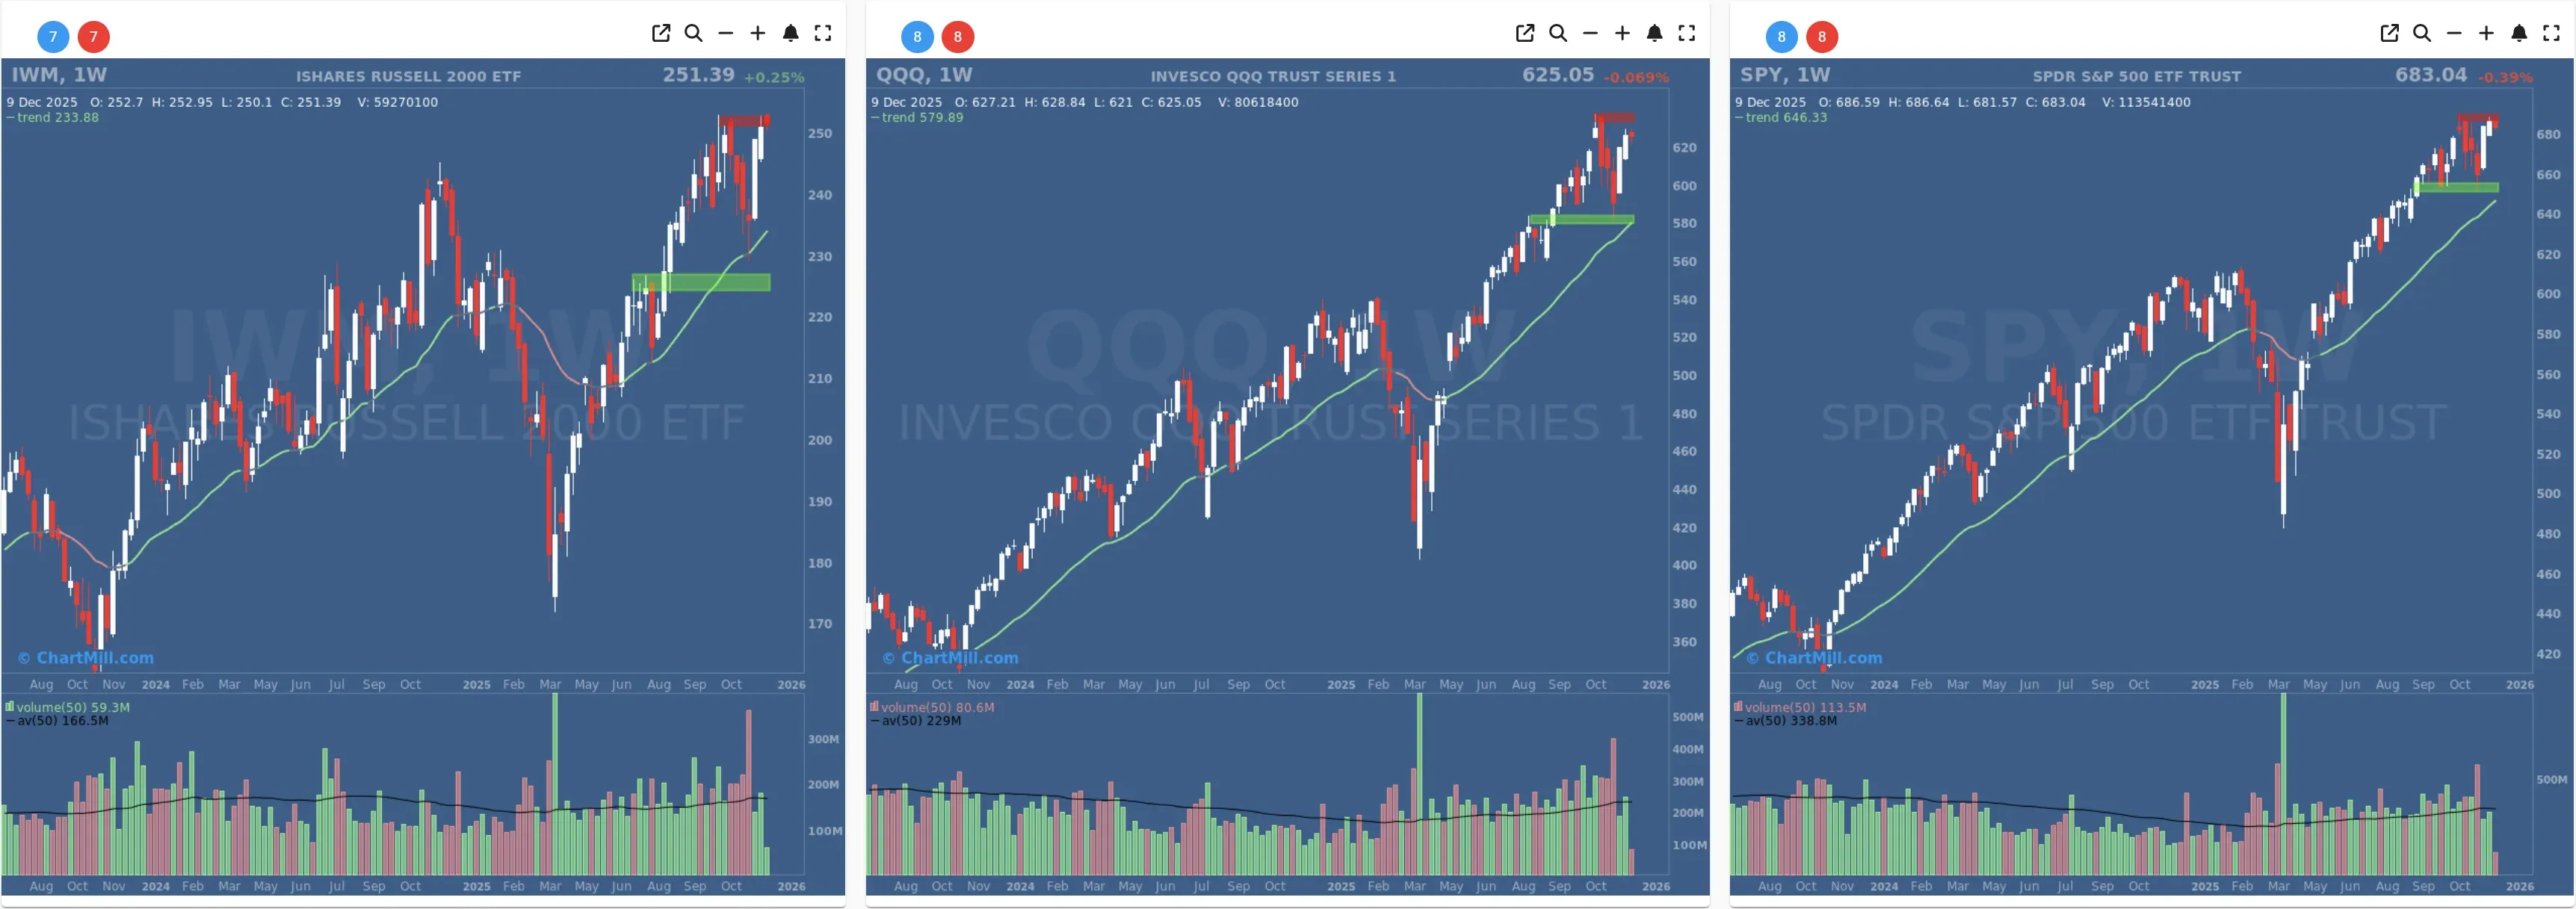
On the weekly chart, SPY is also in a strong uptrend, with no sign yet of a topping pattern. Price is consolidating near the highs rather than being rejected from them, which fits well with the still-constructive breadth picture.
QQQ closed fractionally higher (around +0.1%) and remains just underneath the overhead red resistance zone.
The weekly chart still shows a very clean uptrend with price extended above the rising ChartMill Trend Indicator. From a breadth perspective, this continues to look like a healthy primary trend where pullbacks are bought, even if day-to-day leadership keeps rotating.
The Russell 2000 ETF (IWM) added about 0.2% and is now pressing directly into the red resistance zone defined by the recent swing highs. The uptrend on the daily chart is very steep: price is well above the rising ChartMill Trend Indicator and far removed from the last green support band around the 230 area.
On the weekly timeframe, IWM is breaking into fresh high ground after a strong multi-week run. This confirms what we’ve been seeing in the breadth data for several days: small caps are no longer lagging, they are increasingly participating in the advance. Compared with yesterday’s post-selloff picture, this is a clear confirmation that Monday’s weakness did not derail the small-cap trend.
Overall, the index mix versus yesterday:
-
Monday showed a synchronized down day with SPY, QQQ and IWM all under pressure.
-
Today we see stabilisation: IWM clearly strong, QQQ modestly higher, SPY flat.
That’s consistent with breadth shifting back from a negative daily reading to something closer to balanced.
Short Term (Daily)
Long Term (Weekly)
Short-term breadth – advancers vs decliners
-
Adv Day / Decl Day moved from 35.9% / 61.1% on Monday to 50.7% / 46.1% on Tuesday. Yesterday’s selling pressure has not followed through; today was a modestly positive session for the average stock.
-
Among the bigger movers, 5% of stocks gained more than 4% while only 1.9% lost more than 4%. That’s a decent tilt toward upside volatility, especially right after a weak day.
So, compared to the previous breadth report, the market has recovered from a short, sharp shakeout rather than sliding into a broader deterioration.
Participation vs moving averages
The percentage of stocks above key moving averages remains broadly stable:
-
Above 20-day SMA: 63% (up from 61.8%)
-
Above 50-day SMA: 50.5% (slightly above 50.1%)
-
Above 100-day SMA: 51.4% (fractionally below 51.6%)
-
Above 200-day SMA: 58.7% (up from 58.5%)
Key takeaways:
-
The short-term 20-day breadth bounced back, signalling that Monday’s drop did not break the underlying trend.
-
Mid- and long-term participation (50/100/200-day) remains comfortably above 50%, which is typical for an ongoing bull phase rather than a late-stage topping pattern.
These readings are slightly below the peaks seen around December 3–4, but the pullback so far looks like normal consolidation after a strong thrust.
Highs, lows and stocks near resistance
- New highs vs new lows: 3% vs 1%. New highs still outnumber new lows, and the new-low reading remains extremely subdued.
The Pocket Pivot metric improved from 23.5% to 26.3%, suggesting more stocks are again pressing against resistance or breakout levels.
This combination tells us that:
-
There is no meaningful expansion in new lows, even after a down day like Monday.
-
Breakout candidates are gradually rebuilding, helped by the fresh strength in small caps.
Breadth across timeframes
Looking beyond the single session:
-
Weekly window: 61.4% advancers vs 37.3% decliners – slightly stronger than yesterday’s 59.1% / 39.5%. The short-term trend over the last week is clearly positive.
-
Monthly window: 50.6% advancers vs 48.4% decliners – essentially balanced, reflecting the choppy up-and-down sequence since late November.
-
Three-month window: 48.1% advancers vs 50.8% decliners, again close to neutral.
-
Big 3-month movers (±25%) are almost evenly split (10.2% up / 9.9% down), suggesting some momentum on both sides but no extreme dispersion.
Compared with previous updates, the message is consistent:
-
Short-term breadth is positive, helped by the impulsive up days on December 3–4 and now today’s recovery.
-
Intermediate breadth is neutral, telling us the market is still digesting the prior strong rally rather than starting a new runaway leg.
Conclusion & breadth rating
Putting the pieces together:
-
Index trends (especially on the weekly charts) remain clearly bullish.
-
Monday’s negative breadth reading looks, at this point, more like a single-day shakeout than the start of a broader deterioration.
-
Small caps breaking to new highs strengthens the idea of a broadening rally, not just a mega-cap story.
-
Participation above key moving averages is stable and comfortably constructive, while new lows stay very muted.
Based on today’s data and the recent sequence of breadth readings, the current breadth trend is best described as:
Rating: positive.
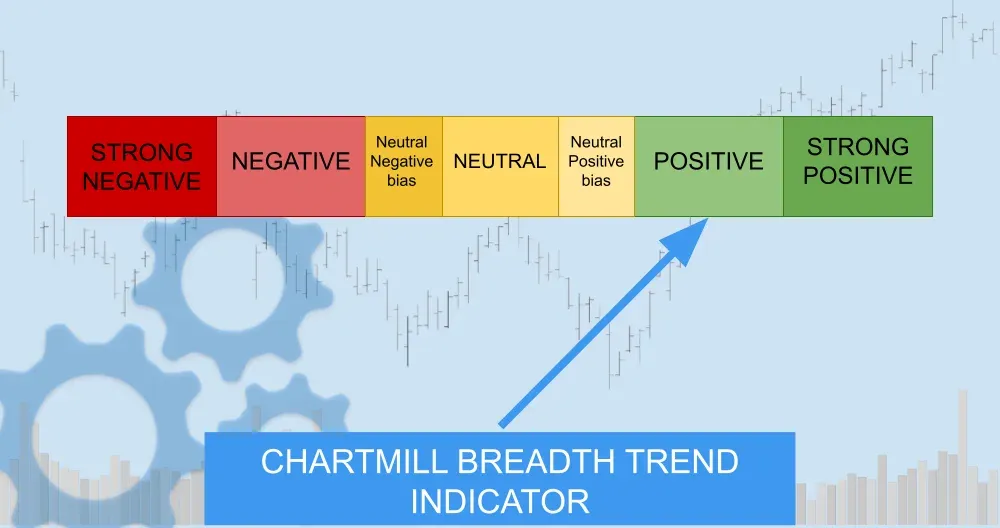
The market is not in an exuberant “very positive” state, but the underlying participation and index structure continue to support the ongoing uptrend, with rotation and short-term volatility offering opportunities rather than signalling a major trend change.
Kristoff - ChartMill
Next to read: JPMorgan’s Cost Shock and Silver’s Moonshot: Wall Street Freezes Before the Fed