

Index overview (SPY, QQQ, IWM)
Short Term (Daily)
Long Term (Weekly)
SPY
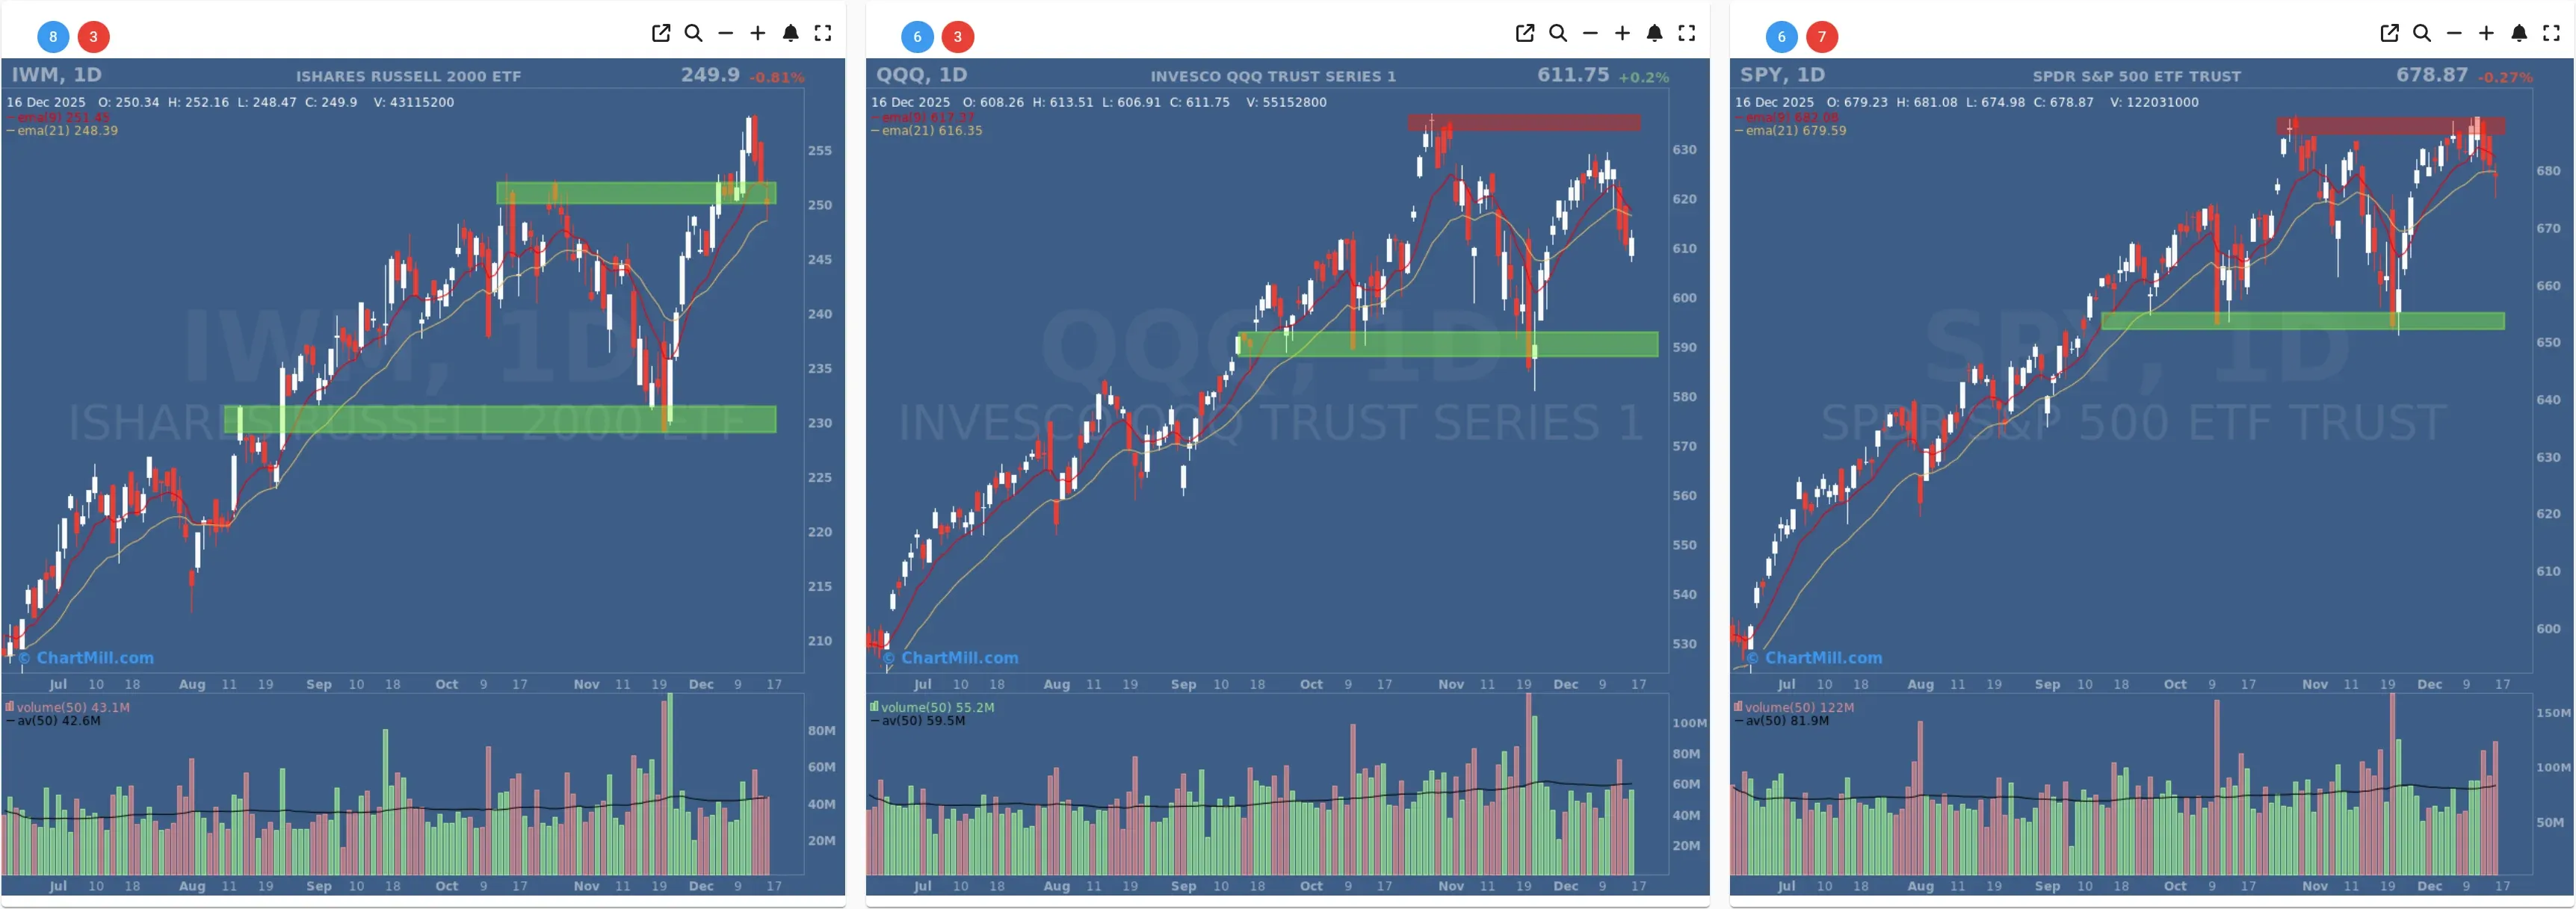
Daily: SPY closed at 678.87 (-0.27%), and remains below both EMA9 (~682.9) and EMA21 (~679.6). That keeps the near-term tone defensive: rallies are being sold into, rather than extended.
Structure: Price is still holding well above the green support zone around the mid-650s, but repeated friction at the red resistance band near the highs signals a market that’s consolidating rather than trending cleanly.
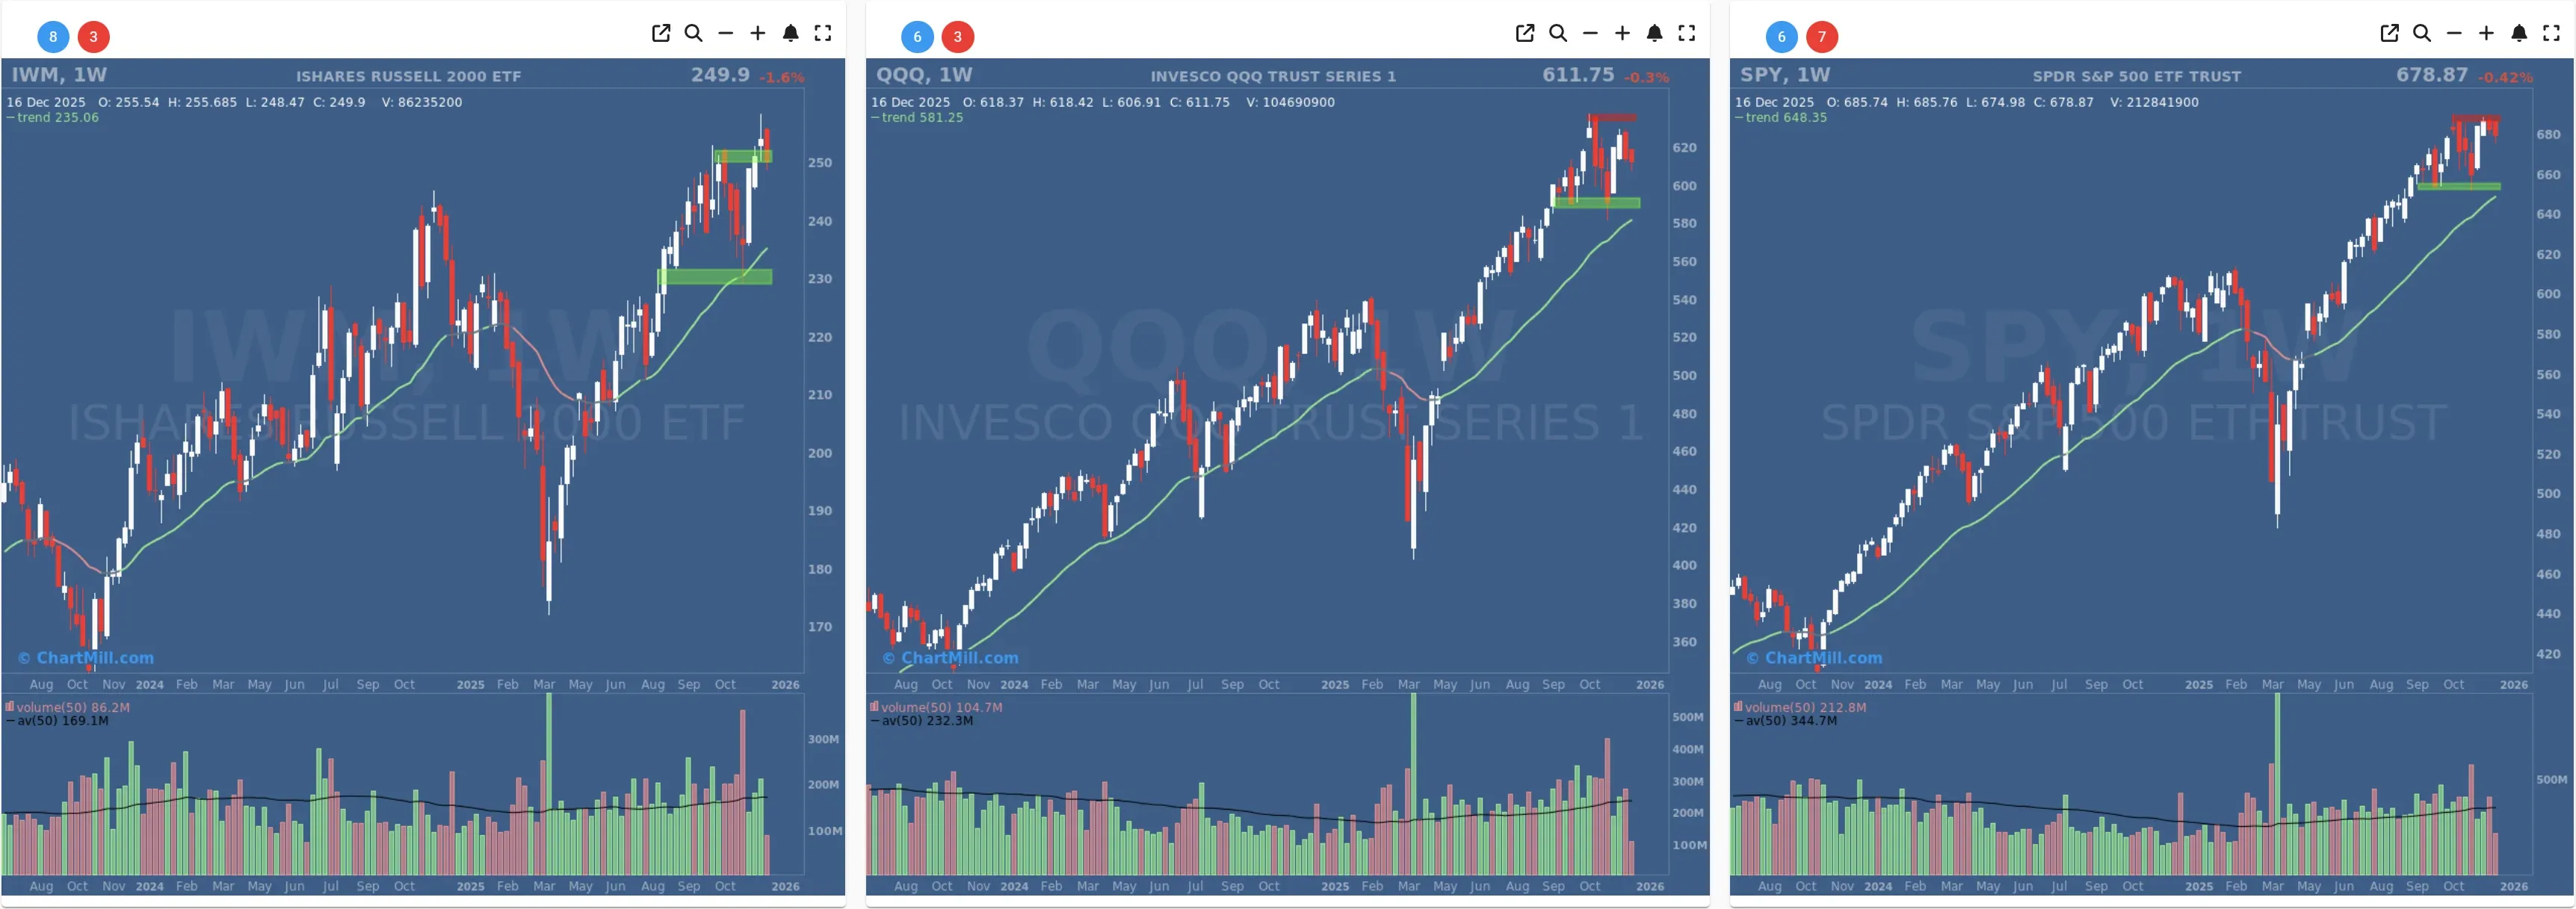
Weekly: Down modestly on the week (-0.42%) while still clearly above the 30-week trend (~648.35) — so this is still best described as pullback/consolidation within an uptrend, not a trend break.
QQQ
Daily: QQQ closed 611.75 (+0.2%), but it’s also below EMA9 (~618.4) and EMA21 (~616.4) — a similar message to SPY: short-term momentum is fading even if the tape isn’t collapsing.
Key levels: The ~590 area (green zone) remains the most obvious “must-hold” demand region from the chart. The upper red zone near the highs is still acting like a ceiling.
Weekly: Slightly negative week-to-date (-0.3%) and still above the 30-week trend (~581.25). Long-term trend remains intact, but leadership is not accelerating right now.
IWM
Daily: IWM closed at 249.9 (-0.81%), right on the edge of the recent breakout/retest region around ~250. This is important: holding that area keeps the breakout thesis alive; losing it increases odds of a deeper mean reversion.
Moving averages: Unlike SPY/QQQ, IWM’s daily chart is more about retesting a level than simply drifting under short EMAs.
Weekly: The week is down more noticeably (-1.6%) but still above the 30-week trend (~235.06) — again suggesting damage is currently tactical, not strategic.
Index takeaway: All three indexes are behaving like a market that’s absorbing supply near resistance. That’s not automatically bearish, but it does tend to coincide with breadth cooling and fewer stocks “doing the heavy lifting.”
Market breadth dashboard (10-day window)
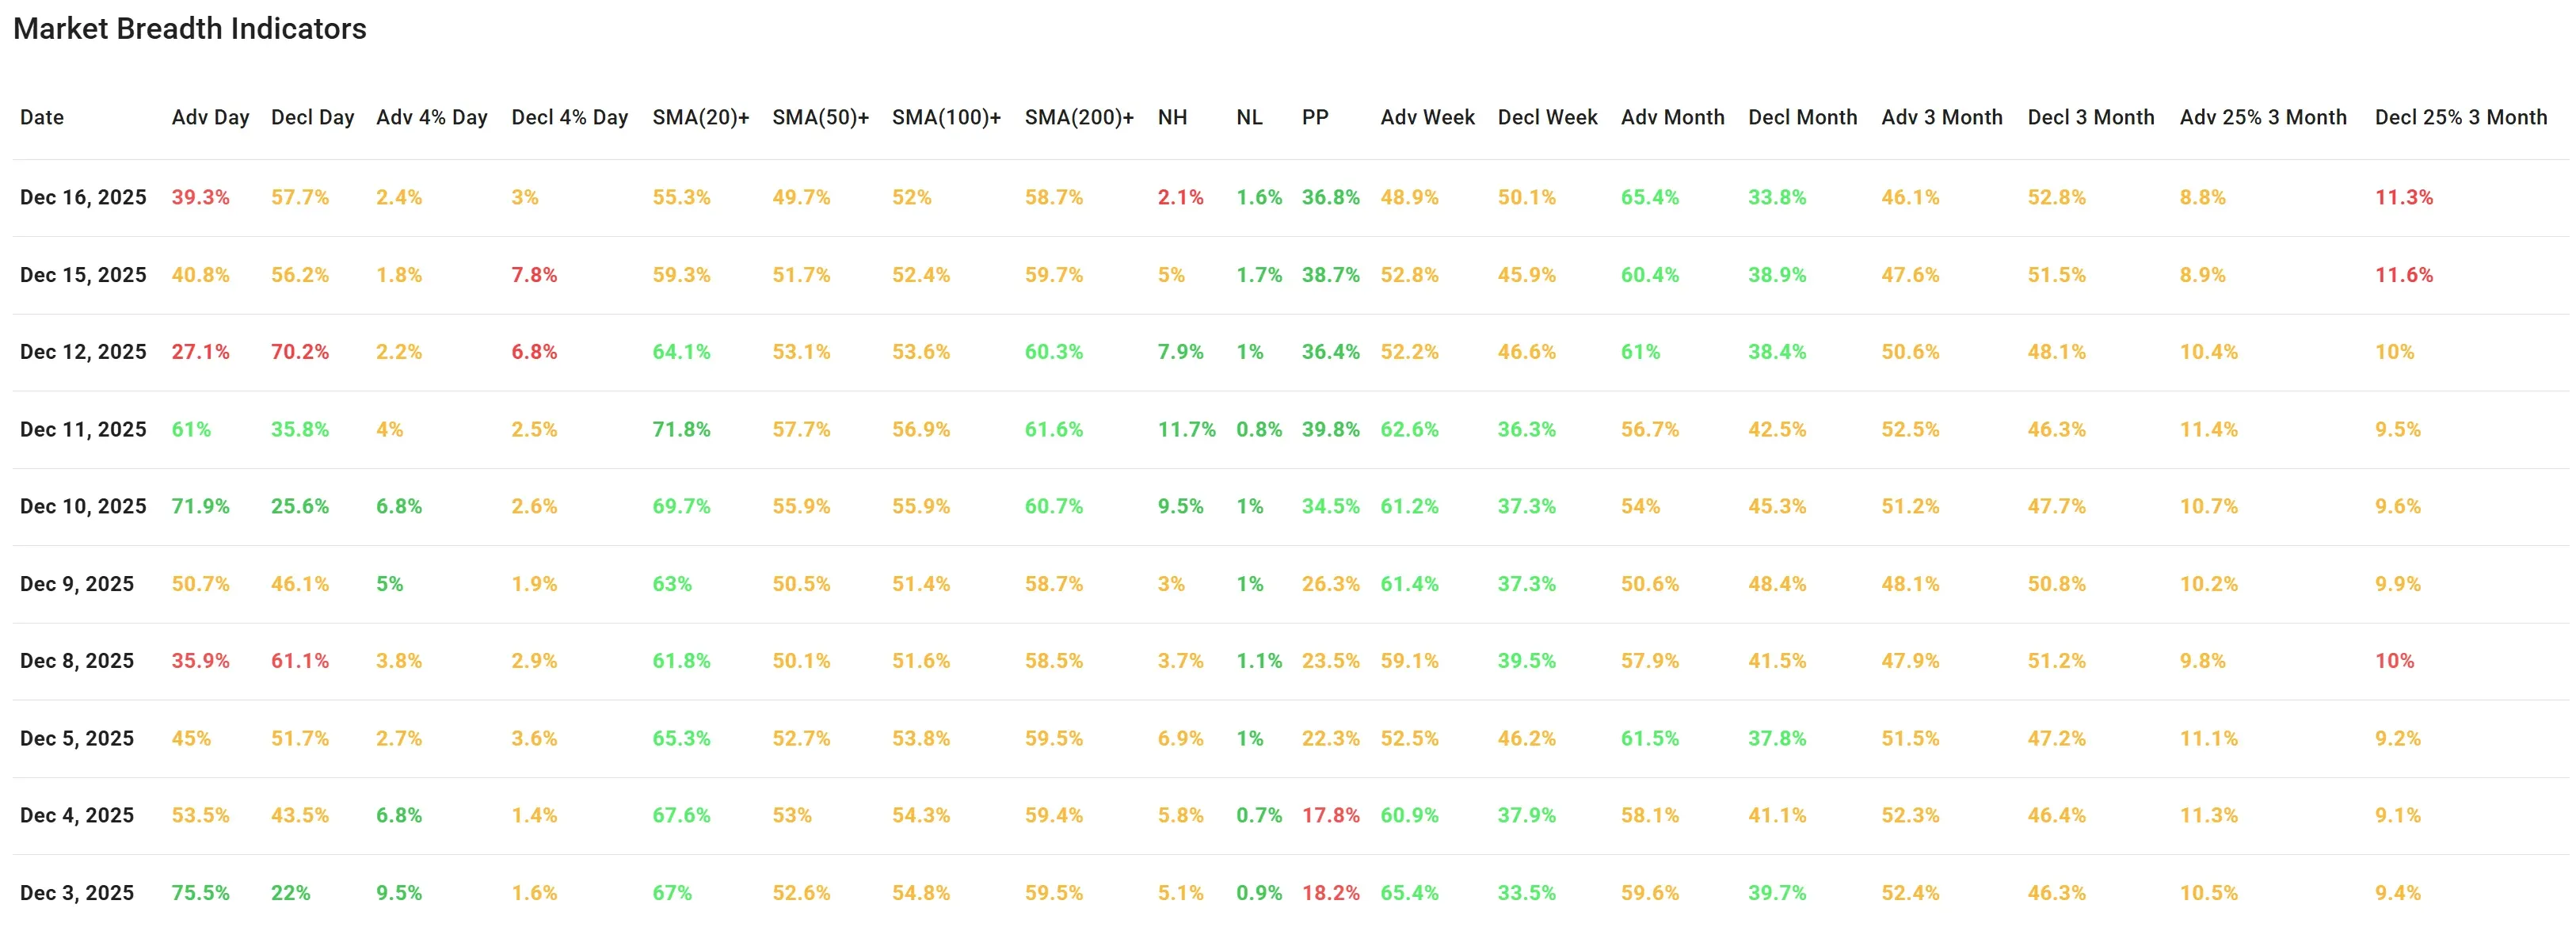
Daily participation remains weak
- Advancers: 39.3% vs Decliners: 57.7%
This is a second consecutive day where decliners lead, reinforcing the idea that upside participation is thinning. At the same time, the extreme downside cooled compared to Monday:
- Decliners >4%: 3.0% (down sharply from 7.8% prior day)
So while breadth is weak, it wasn’t the same kind of heavy “distribution day” intensity as Monday’s read implied.
Fewer stocks are holding short- and medium-term trend levels
-
Above SMA(20): 55.3% (down from 59.3%)
-
Above SMA(50): 49.7% (down from 51.7%, now below 50%)
That SMA(50)+ slipping under 50% is a notable deterioration point: it suggests the average stock is no longer in a stable intermediate uptrend, even though the large indexes still look relatively controlled.
Longer-term participation is holding up better:
- Above SMA(200): 58.7% (still healthy, but easing from 59.7%)
Breakout pressure is fading
- New Highs: 2.1% vs New Lows: 1.6%
Still not alarming (NH > NL), but new highs fell hard from 5.0% the day before. That aligns with what we see on SPY/QQQ: price is near highs, but fewer stocks are expanding into fresh breakouts.
Higher timeframe tone is mixed (short-term soft, monthly still constructive)
-
Adv Week: 48.9% vs Decl Week: 50.1% (basically flat, slight negative lean)
-
Adv Month: 65.4% vs Decl Month: 33.8% (still clearly positive)
So the market is sending a split message:
-
Short-term: cooling/fragile
-
1-month: still constructive, suggesting the pullback may remain range-bound unless selling pressure returns.
What changed vs the previous breadth update (Monday, Dec 15)?
The “headline” weakness persisted (decliners still lead), confirming that Monday’s softer tone wasn’t a one-off.
But the worst-case follow-through didn’t show up: extreme decliners (>4%) dropped from 7.8% to 3.0%, suggesting selling became less forceful even if participation stayed negative.
The more important shift is under the hood: the slide in SMA(20)+ and SMA(50)+ tells us the market is losing trend participation — which often happens before indexes make a more meaningful move (up or down).
Breadth trend rating
Rating: Neutral, with a negative bias.

Long-term trends (weekly + 200-day participation) remain supportive, but short- to intermediate-term participation is weakening, new highs are fading, and the major indexes are below short EMAs while pressing into resistance. That combination argues for more selectivity and tighter risk control until participation improves again.
Next to read: Jobs Data Trips the Dow While AI Legislation Keeps Nasdaq Awake