
Index overview – SPY, QQQ and IWM
-
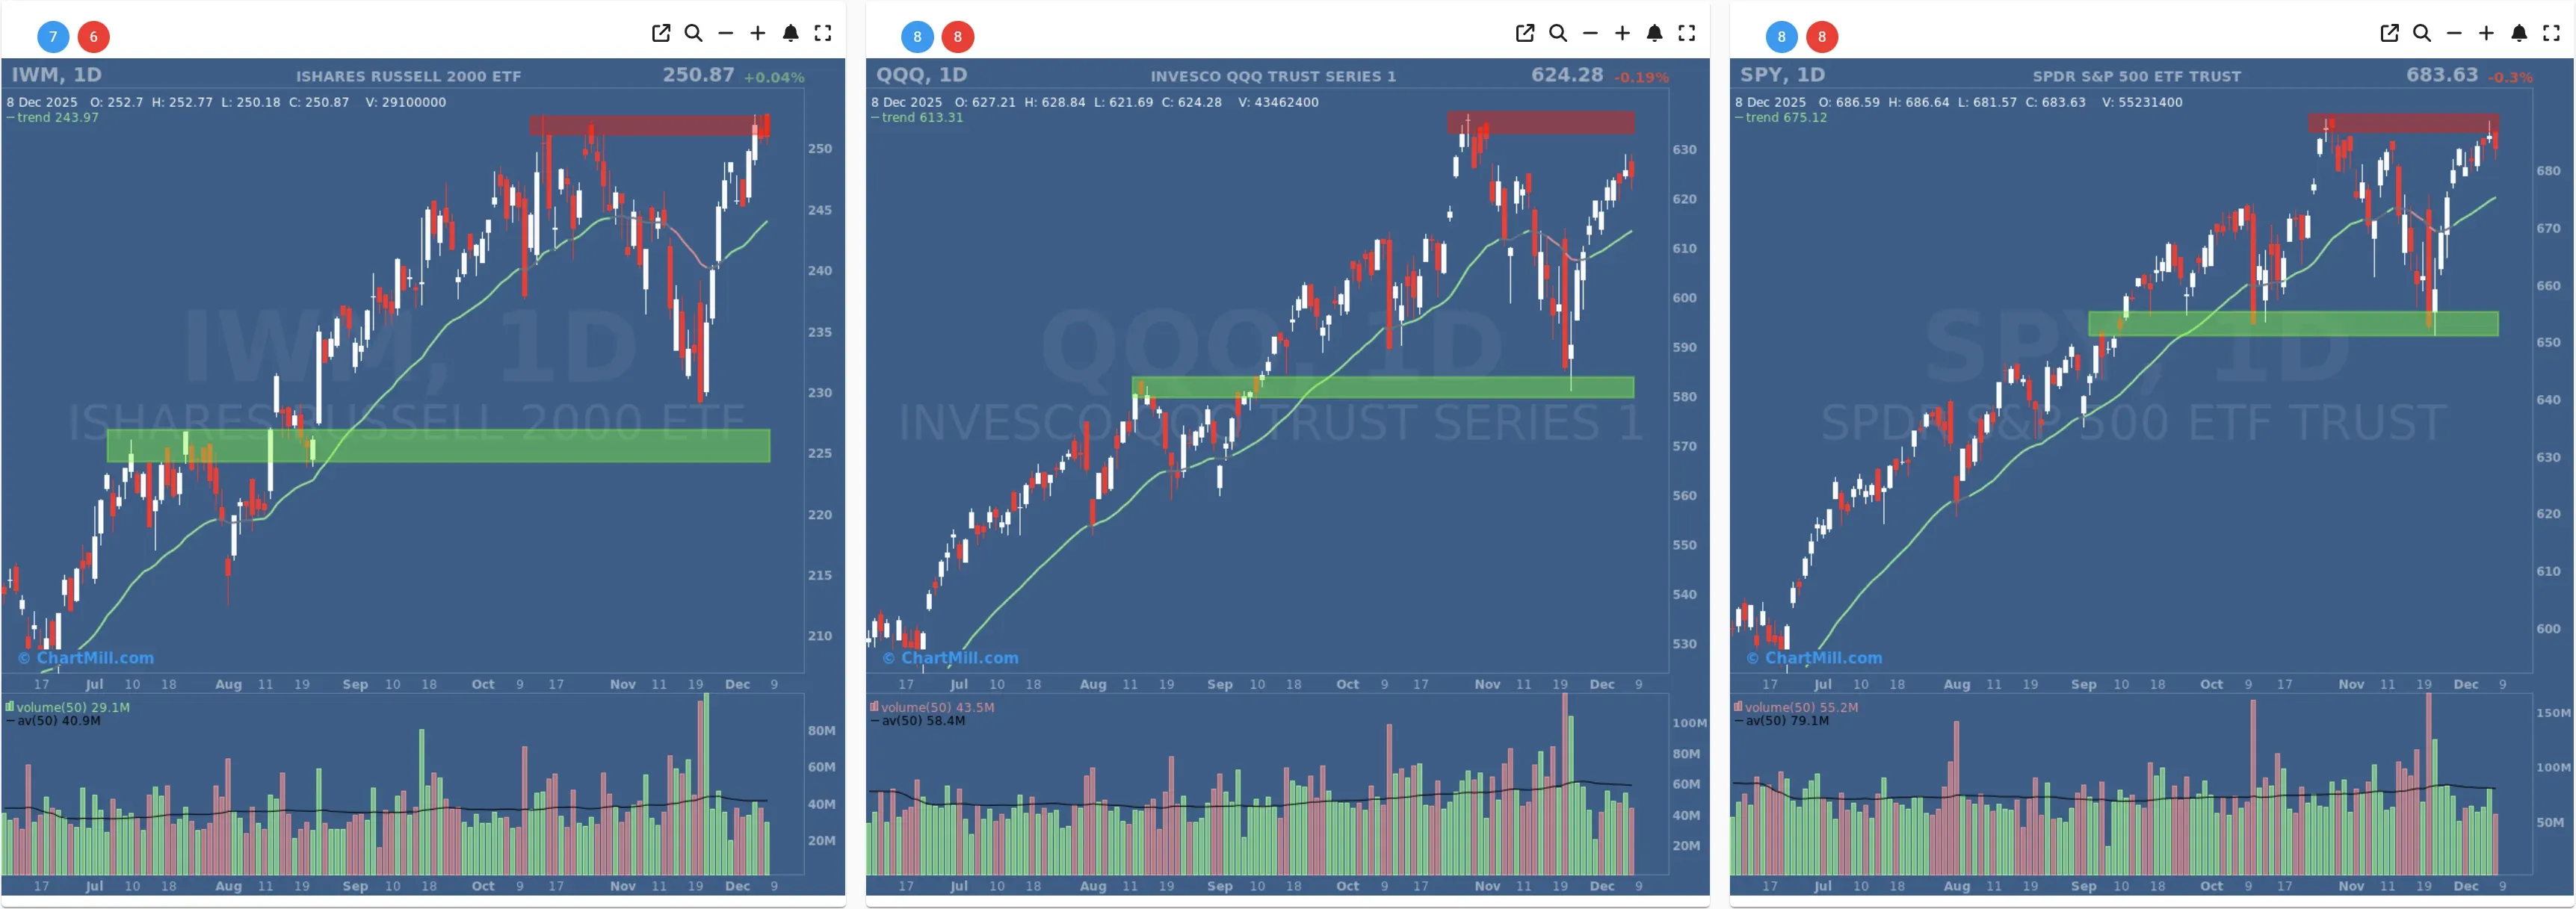
SPY slipped about 0.3% and continues to chop sideways just below its recent highs on the daily chart. The ETF is still clearly in an uptrend on both the daily and weekly time frames, riding above the ChartMill Trend Indicator.
-
Price action confirms what we saw in the data on Friday: momentum has slowed, but there’s no technical breakdown. SPY is consolidating in a tight band under resistance.
-
QQQ dipped roughly 0.2%, also stuck in a short consolidation below the recent highs marked by the red resistance box on the chart.
-
Tech leadership is intact, but the pattern of small red candles at resistance and today’s weaker breadth (more decliners than advancers) shows buyers are less aggressive than earlier in the rally.
-
IWM finished marginally higher (+0.04%) and is again pressing into a major resistance area on the daily and weekly chart.
-
This keeps the idea of a potential small-cap catch-up alive, something we already highlighted in earlier updates. However, the broader market breadth today was negative, so this small-cap strength is not yet a broad risk-on stamp of approval.
In short, the price indices are still bullish but pausing: SPY and QQQ are moving sideways at the top of their ranges, while IWM is challenging resistance but hasn’t broken out decisively.
Short Term (Daily)
Long Term (Weekly)

Market Breadth Daily participation – clearly negative

On Friday we noted that breadth was already cooling, with only 45% of stocks advancing and more than half declining. Today that deterioration continued:
-
Advancing stocks: 35.9%
-
Declining stocks: 61.1%
So Monday delivered another distribution-type session, even though the headline indices barely moved. Under the surface, more stocks slipped than gained.
The picture is slightly less negative if we look only at the bigger movers:
-
Advancers +4%: 3.8% (up from 2.7% on Friday)
-
Decliners −4%: 2.9% (down from 3.6%)
So while the number of losers increased, the share of stocks suffering large declines actually fell, and big winners improved slightly. This is still a soft session, but not a “panic” day.
This fits well with Friday’s conclusion: bears are nibbling, not biting.
Medium-term trend: still constructive, but slowly eroding
The percentage of stocks trading above key moving averages continues to slip from the late-November / early-December highs:
-
Above 20-day SMA: 61.8% (down from 65.3% Friday and from the mid-60s/ high-60s earlier last week)
-
Above 50-day SMA: 50.1% (down from 52.7%)
-
Above 100-day SMA: 51.6% (down from 53.8%)
-
Above 200-day SMA: 58.5% (down from 59.5%)
Key takeaways:
-
Structural picture remains positive: More than half of the market is still above the 50-, 100- and 200-day averages. That’s typical of a bull phase, not a bear.
-
Momentum is fading: All four moving-average metrics have edged lower again, confirming that the broad thrust we saw in late November has peaked and is now being digested.
This is very much in line with what we’ve been seeing over the last several updates: from broad, powerful rally → to slower, more selective advance.
New highs vs. new lows – leadership still intact, but cooling
-
New highs (NH): 3.7% of stocks
-
New lows (NL): 1.1% of stocks
New highs are down from 6.9% on Friday, while new lows remain very low and almost unchanged. The NH–NL spread is still clearly positive, but not as impressive as earlier in the move.
This tells us:
-
Market leadership is still on the upside, but fewer stocks are pushing to fresh highs.
-
We’re seeing more sideways to slightly lower action rather than aggressive breakouts.
Again, this confirms the narrative from Friday: no rotation into outright risk-off, but the “easy money” phase of the rally is behind us for now.
Weekly and monthly breadth – still supportive
The weekly and monthly panels smooth out the day-to-day noise and are therefore crucial for trend validation.
Weekly window (last 5 trading days):
-
Advancing week: 59.1%
-
Declining week: 39.5%
Interestingly, the weekly advance share has rebounded from 52.5% on Friday. That’s because the rolling 5-day window has dropped an earlier weaker session while adding today, which—despite poor daily breadth—still sits inside a strong overall 5-day stretch (helped by the very strong Dec 3–4 sessions).
So from a weekly point of view, the market is still clearly in “up week” territory.
Monthly and 3-month windows
-
Advancing month: 57.9% (down from 61.5%)
-
Declining month: 41.5% (up from 37.8%)
Short-term, that’s just mild cooling of a still-solid uptrend.
More interesting is the 3-month perspective:
-
Advancing 3-month: 47.9%
-
Declining 3-month: 51.2%
For the first time in a while, the 3-month window has flipped slightly negative, more stocks are down than up over the last three months. The share of big 3-month winners (up more than 25%) has also faded from 11.1% to 9.8%, while the big losers (−25% or worse) ticked up to 10%.
This tells us that:
-
The rally of the last few weeks is still too young to fully repair the damage of earlier in the quarter for many stocks.
-
From a swing-to-position trader’s perspective, stock selection matters a lot: a shrinking minority of names are still delivering outsized returns.
How does this compare to the previous update?
In Friday’s breadth report we highlighted three points:
-
Indices at or near resistance, especially SPY and QQQ.
-
Short-term breadth cooling, with fewer advancing stocks and a modest drop in the percentage above key moving averages.
-
Intermediate-term trend still constructive, with the majority of stocks above their 50- and 200-day averages and a large positive weekly advance/decline balance.
Monday’s data confirms and extends that message rather than contradicting it:
-
Resistance on SPY and QQQ continues to cap upside; IWM is testing, but not yet breaking, its own ceiling.
-
Daily breadth has weakened further (35.9% advancers vs 45% on Friday), adding another day of quiet distribution beneath the surface.
-
New highs are fewer, and the 3-month breadth has slipped back into slightly negative territory.
-
Nevertheless, the weekly and monthly breadth measures are still supportive of the prevailing uptrend.
In other words: the market is still bullish, but the wind at the bulls’ back is less strong than it was in late November.
Breadth trend rating
Based on today’s data:
-
The majority of stocks remain above the 50- and 200-day SMAs.
-
New lows are still very low and well below new highs.
-
Weekly breadth is clearly positive.
-
But daily participation is weak, moving-average breadth is drifting lower, and 3-month breadth has slipped slightly negative.
Current breadth rating: Neutral with a positive bias, downgraded in tone from the “clearly positive” backdrop we enjoyed in late November and early December.

Bulls still have the structural advantage, but the margin of safety is narrowing. A clear breakout in SPY/QQQ and a renewed pick-up in daily breadth would be needed to move this back toward a solid “positive” reading; more days like today, in contrast, would push the rating down toward neutral.
Kristoff - ChartMill
Next to read: Streaming Wars Go Hostile Just as Wall Street Braces for the Fed