

Index overview (SPY, QQQ, IWM)
Short Term (Daily)
Long Term (Weekly)

SPY
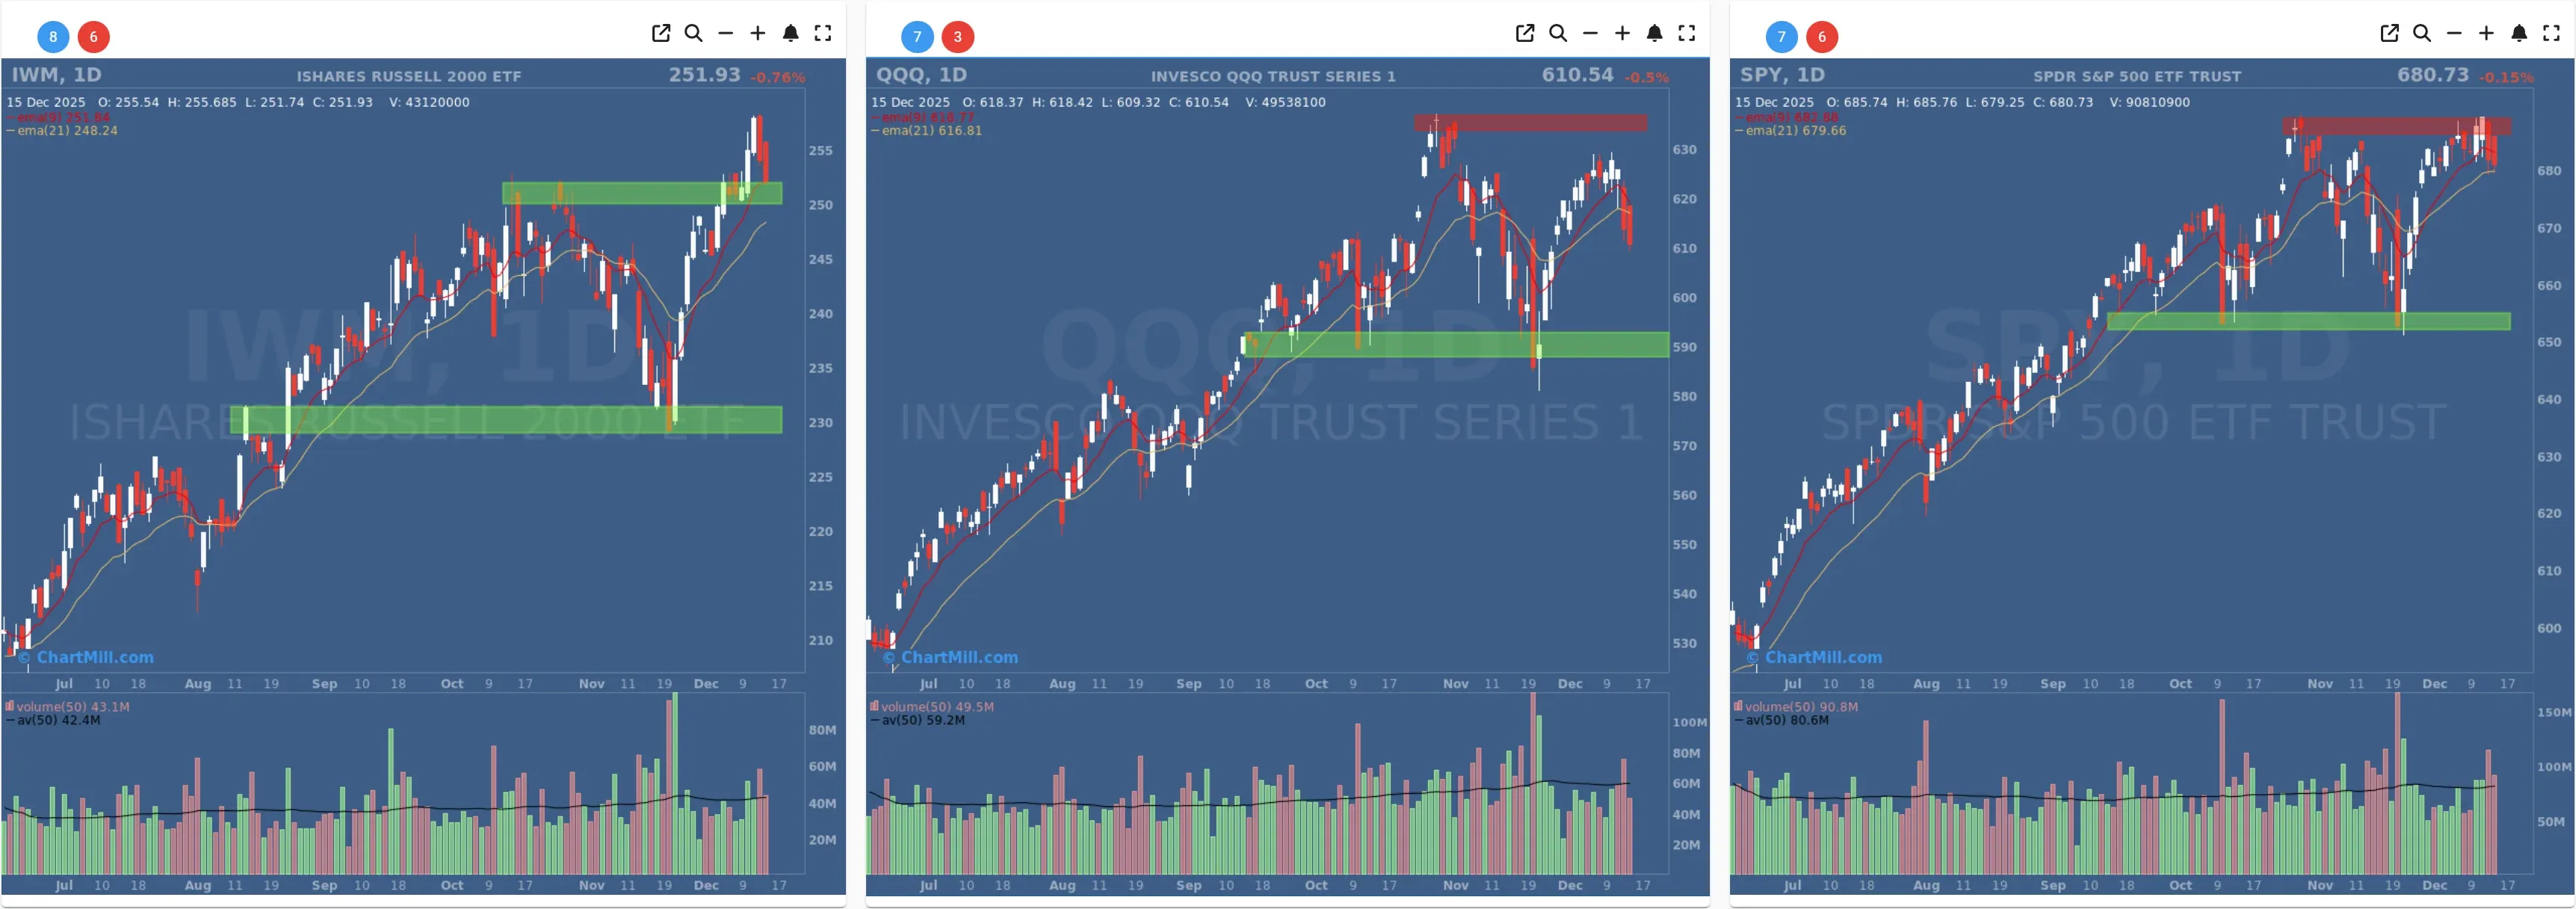
Daily: SPY continues to stall near a clearly defined resistance zone near the recent highs. Monday finished only slightly lower, and price is still hovering around the short-term trend area (very close to the EMA21), which keeps the daily picture “tight but vulnerable” rather than outright bearish.
Weekly: The longer-term picture remains constructive: SPY is well above the 30-week trend line (ChartMill Trend Indicator ~648), and the dominant weekly trend is still up. As long as pullbacks remain contained above the broader support band (mid-650s area on the chart), this looks more like consolidation than breakdown.
QQQ
Daily: QQQ showed the most visible weakness of the three. Monday’s decline pushed it below its EMA21 (≈616.8), shifting the short-term tone from “buy-the-dip” to “prove it again.” The chart highlights a logical next support zone around the ~590 area if weakness persists.
Weekly: Still in a long-term uptrend (Trend Indicator ~581), but price is pressing into/under a resistance area near the highs. In other words: weekly uptrend intact, but momentum has cooled and the top is getting “heavy.”
IWM
Daily: Small caps pulled back and finished around 252, right on top of the nearby support zone (~250) highlighted on the chart. Importantly, IWM is still above its EMA9(≈251.8) & EMA21 (≈248.2), so this is currently a test, not a failure.
Weekly: The longer-term trend remains positive (Trend Indicator ~235). IWM has been acting stronger than it did earlier in the year, but it’s still the most “decision-point” chart right now: hold 250 and rotate higher, or lose it and the pullback likely deepens.
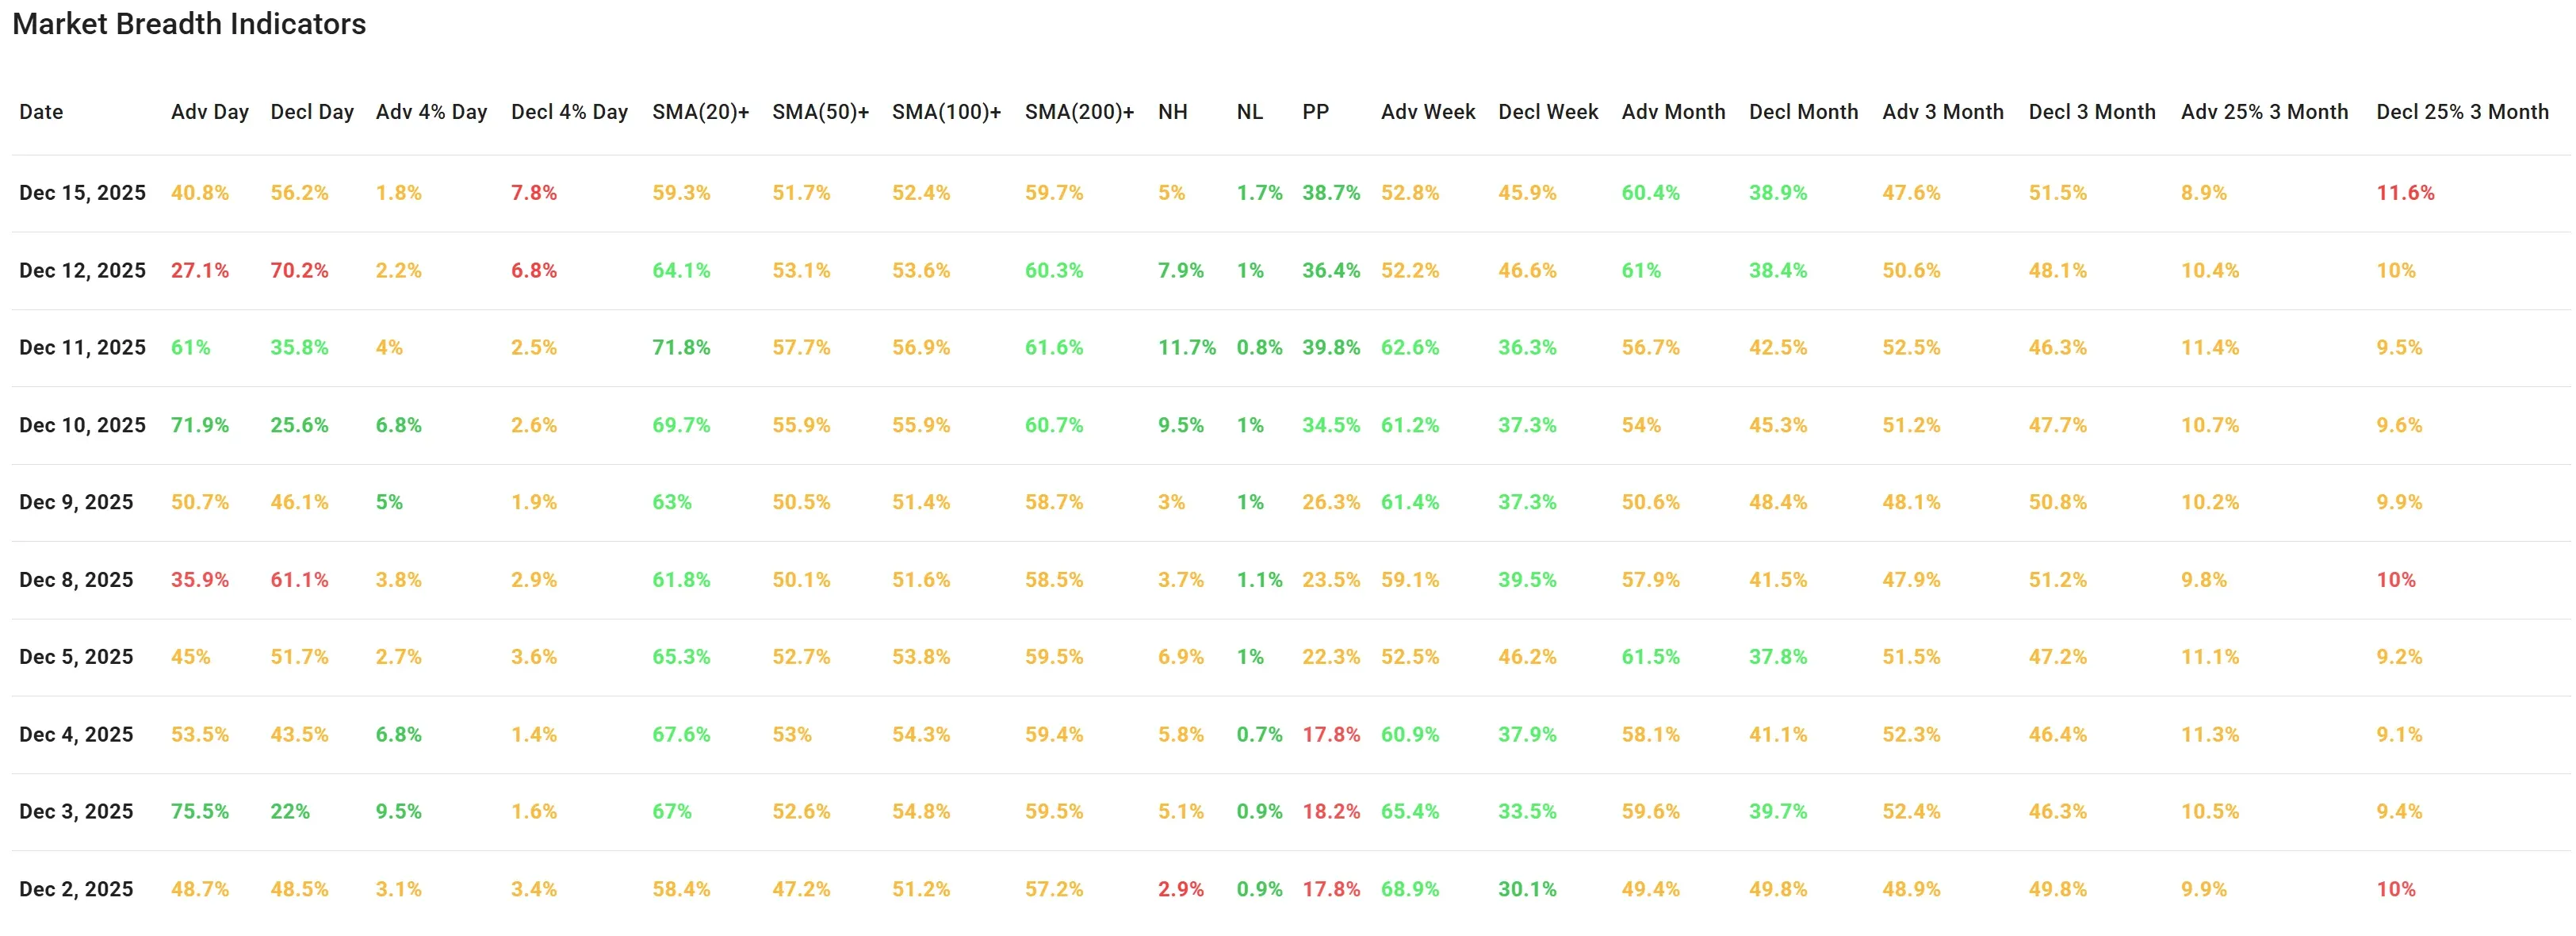
Market breadth dashboard (Dec 15) — what changed vs. Friday (Dec 12)
1) The day improved… but stayed net negative
- Advancers/Decliners: 40.8% / 56.2% (still bearish, though better than 27.1% / 70.2% on Dec 12).
This fits the index behavior: no crash, but not enough broad strength to regain momentum.
2) The “damage” metric worsened
-
Decliners >4%: 7.8% (up from 6.8% on Dec 12)
-
Advancers >4%: just 1.8%
This is one of the more important messages in today’s data: even with a less-extreme A/D split than Friday, the downside tail got heavier. That often shows up during distribution/rotation phases.
3) Participation keeps fading
-
% above SMA(20): 59.3% (down from 64.1% Friday; way down from 71.8% on Dec 11)
-
% above SMA(50): 51.7% (slipping)
-
% above SMA(200): 59.7% (still okay, but drifting lower)
The market still has a long-term base, but short-term breadth is leaking, which makes rallies more selective and pullbacks more “sticky.”
4) New highs cooled, new lows ticked up (still contained)
-
New highs: 5.0% (down from 7.9%)
-
New lows: 1.7% (up from 1.0%)
New lows are not exploding (good), but this combination supports the idea that leadership is narrowing.
5) Multi-week trend: still okay… but rolling over
-
Weekly A/D: 52.8% / 45.9% (still slightly positive)
-
Monthly A/D: 60.4% / 38.9% (still constructive)
-
3-month A/D: 47.6% / 51.5% (now slightly negative)
-
Deep movers (3-month): Adv +25%: 8.9% vs Decl -25%: 11.6%
That last line matters: over a multi-month window, more stocks are now in meaningful drawdowns than in strong upside extensions.
Bottom line
The weekly trend remains bullish across SPY/QQQ/IWM, but the breadth engine is losing horsepower. Monday didn’t confirm a breakdown, yet it did confirm a pattern we’ve been seeing in the last couple of updates: participation is shrinking and downside outliers are increasing.
-
What would improve the picture quickly: a drop in Decliners >4%, and a turn back up in % above SMA(20) (participation returning).
-
What would worsen it: QQQ failing to reclaim its EMA21 soon, or IWM losing the ~250 support zone, that would likely pull more breadth metrics down with it.
Breadth trend rating: Neutral, with a negative bias.
(Uptrends still intact on the weekly charts, but the breadth data is deteriorating enough to warrant caution.)

Next to read: Oracle’s AI Spending Hangover Meets a Cathie Wood Turbo-Boost