

Index overview (SPY, QQQ, IWM)
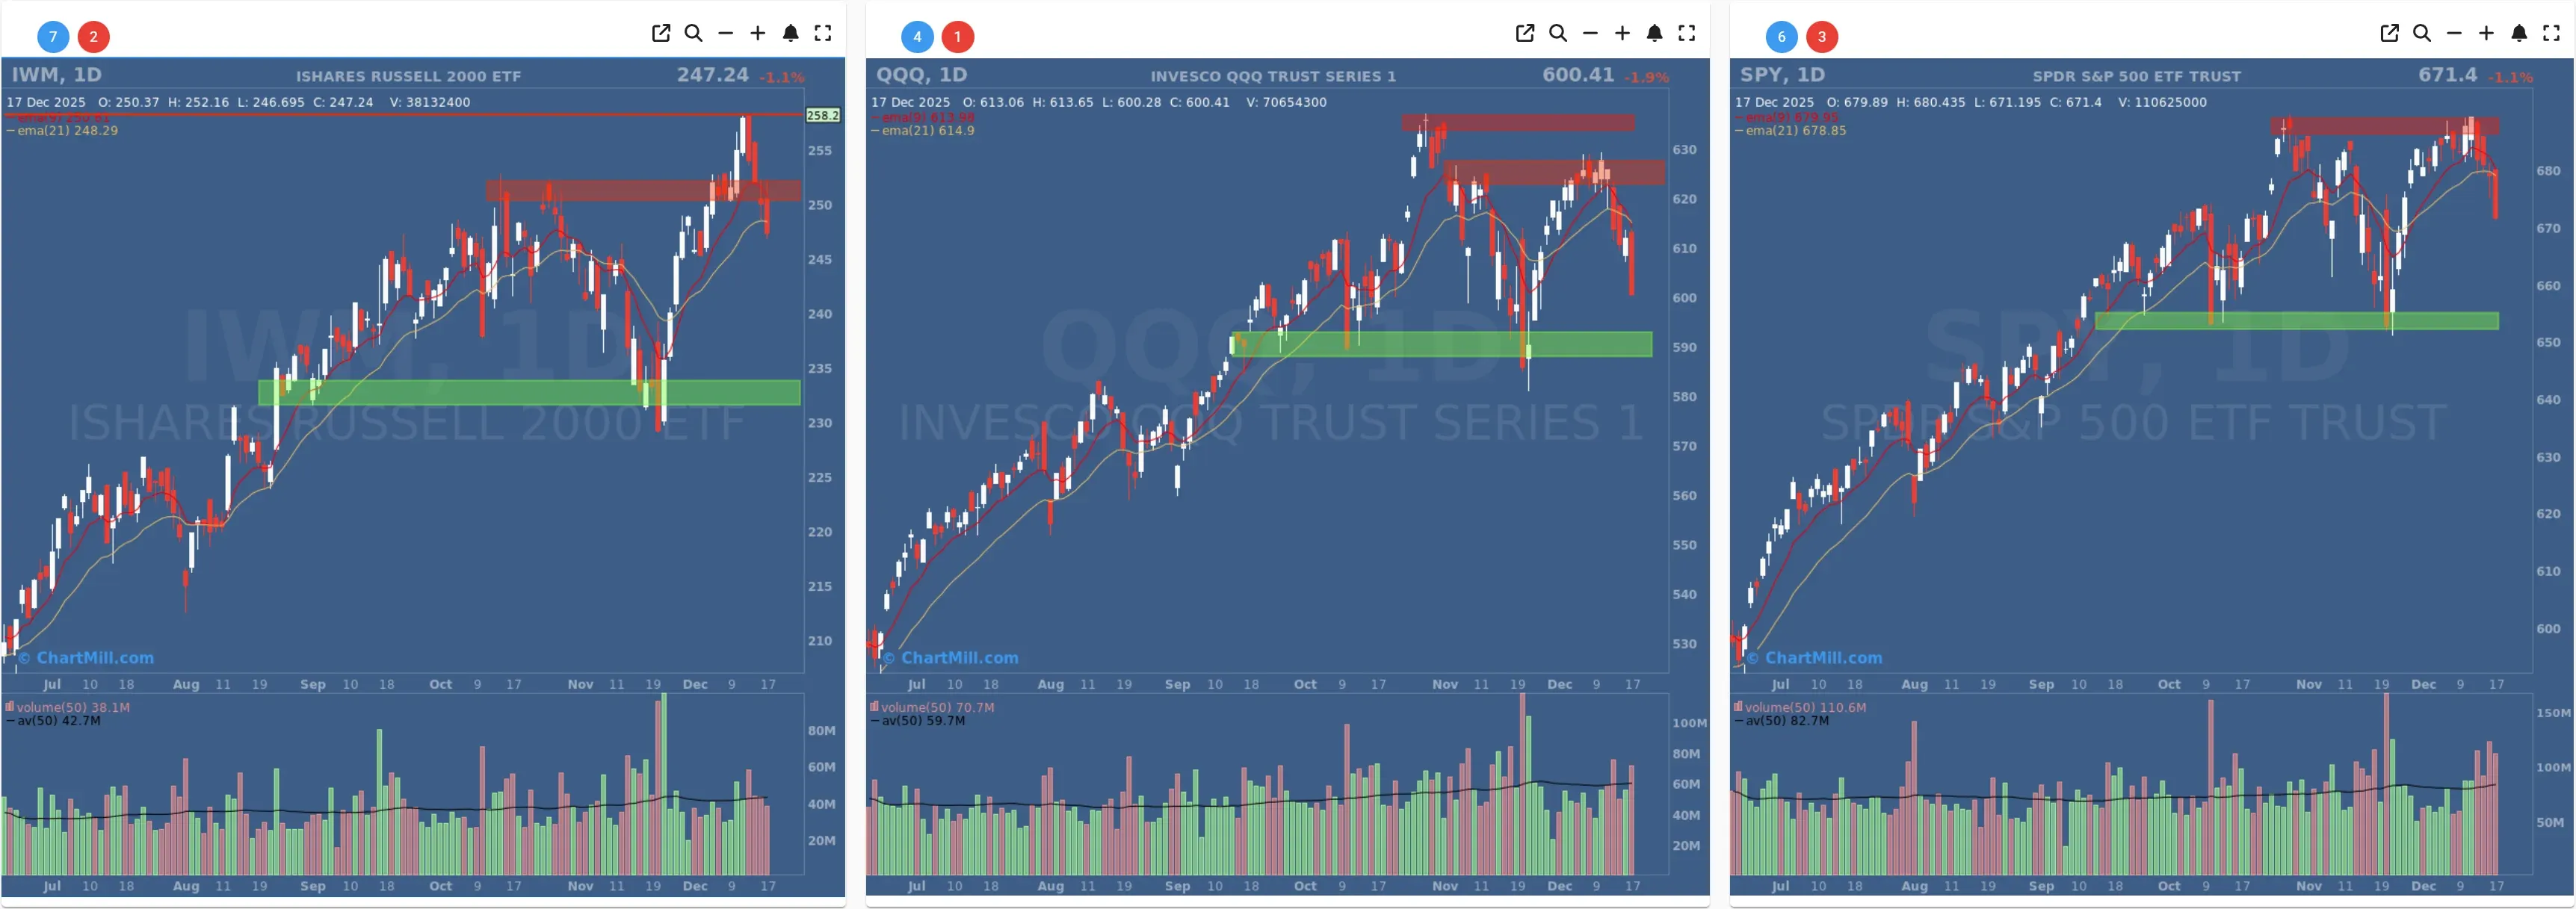
Short Term (Daily)
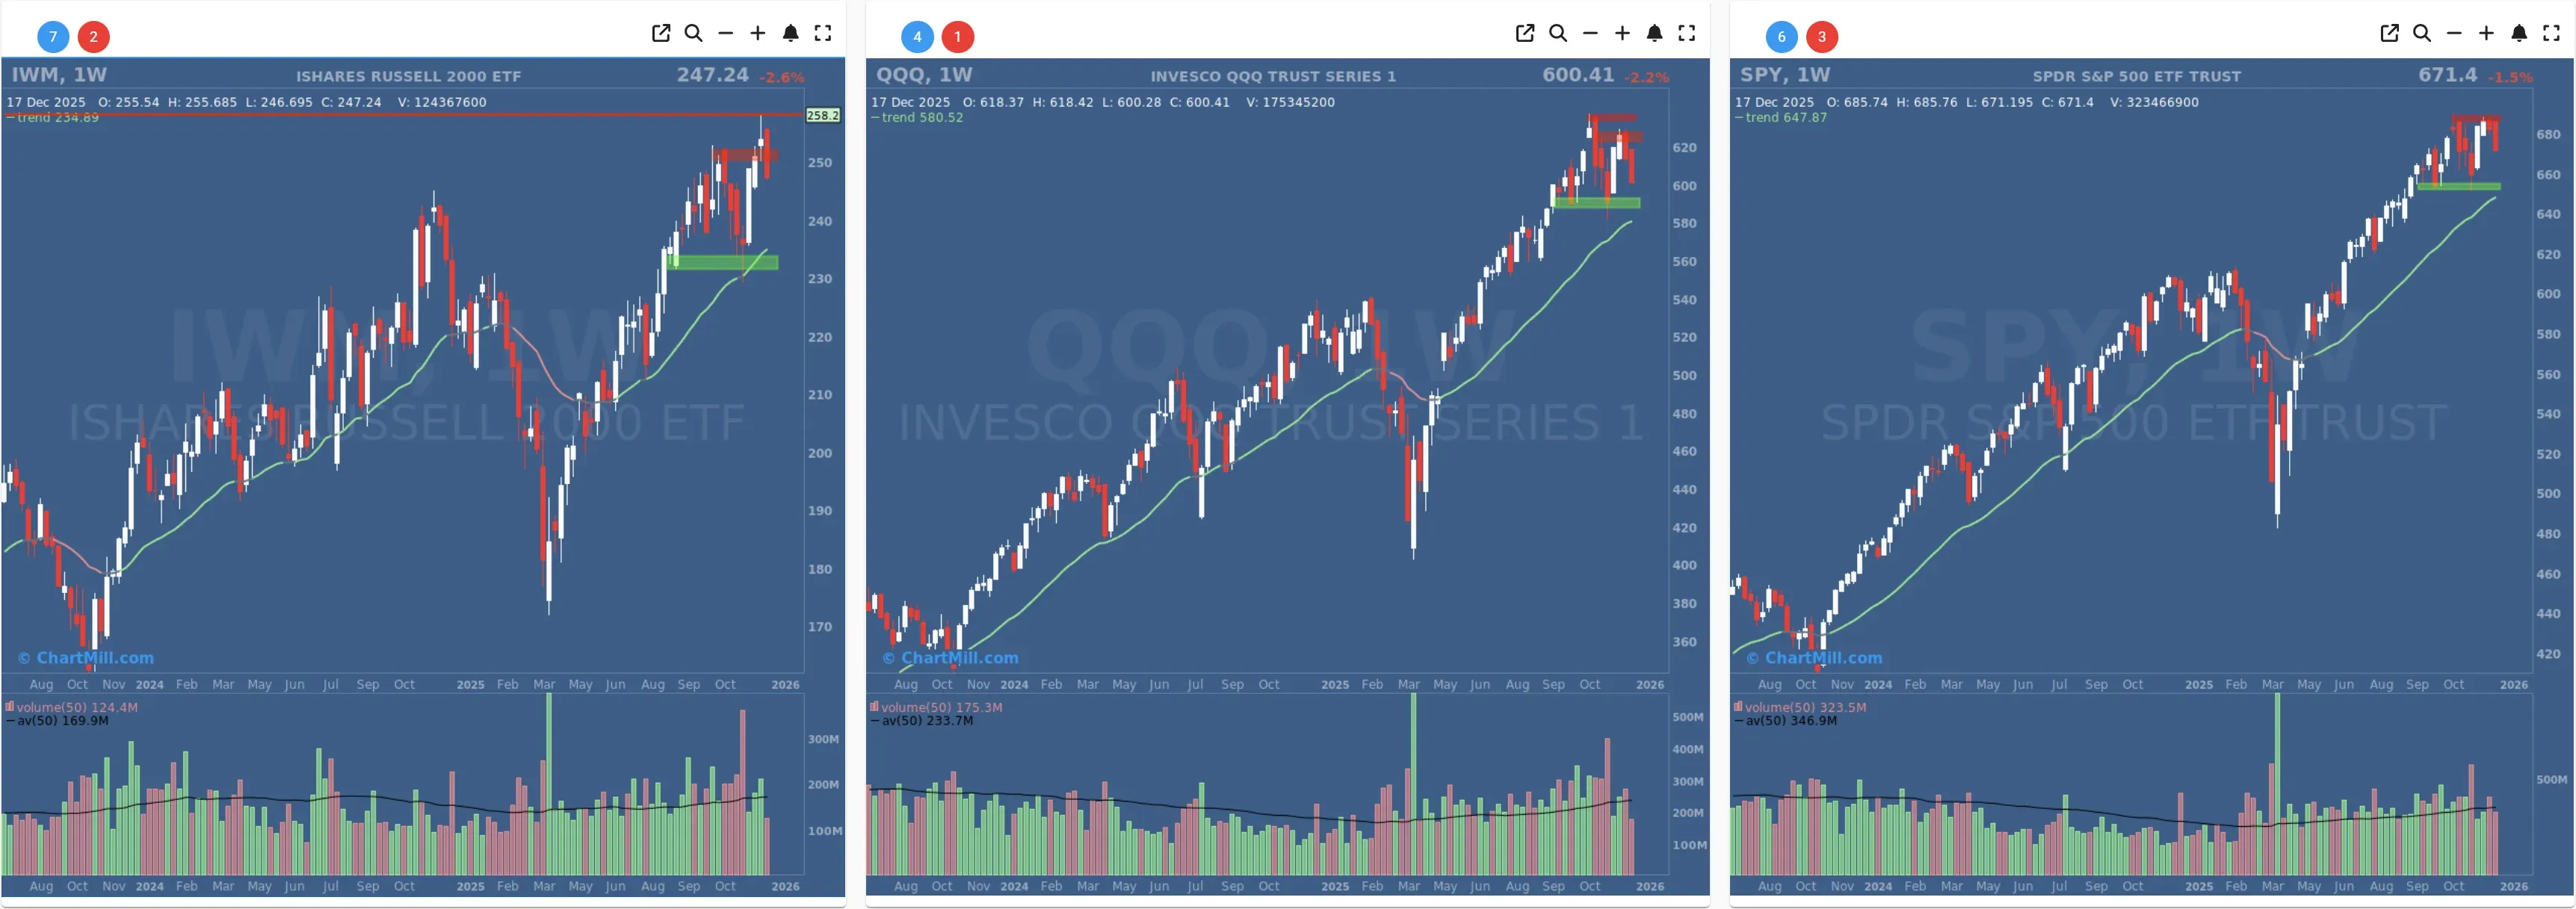
Long Term (Weekly)
SPY - short-term trend breaks, support still below
SPY closed at 671.4 (-1.1%), finishing near the day’s low and back under both EMA9 (~679.96) and EMA21 (~678.85). That’s a notable momentum shift: over the past sessions the market was wobbling, but still acting like dip-buyers had control. Today, price action says sellers are taking the wheel, at least short-term.
Key takeaway: short-term trend damage, with overhead supply now clearly defined near the recent highs (red zone).
Nearest structural support: the green zone lower (mid-650s area) remains untested, so we’re not in “panic” territory yet, but the market is leaning on fewer pillars.
QQQ - the weak link today
QQQ was the standout on the downside, closing 600.41 (-1.9%) after opening above 613 and sliding almost straight down. It also finished below EMA9 (~611.98) and EMA21 (~614.9), which usually goes hand-in-hand with breadth deterioration (and today’s breadth confirms it).
QQQ adds a bearish momentum confirmation: beyond closing below both EMA’s, the EMA9 has now crossed beneath the EMA21, which is a classic short-term trend reversal signal. It doesn’t guarantee a prolonged downswing on its own, but it does raise the odds that rebounds get capped earlier and that overhead supply becomes more active, especially if breadth (adv/decl, SMA20+) keeps weakening alongside it.
Watch level: the ~590 support zone (green) is the next obvious “must-hold” area if sellers stay active.
IWM - down, but relatively steadier
IWM closed 247.24 (-1.1%), also dropping under EMA21 (~248.29) (and under EMA9 as well). Small caps didn’t lead today’s selloff (QQQ did), but they still joined the move, which matters, because it reduces the chance this is just a narrow sector wobble.
Key takeaway: relative resilience vs QQQ, but still short-term trend break.
Support: the lower green zone (low-230s area) remains the bigger structural “line in the sand.”
Big picture from the charts
All three indexes ended the day below their short-term trend rails (EMA9/21), while weekly charts still look constructive overall (price remains above the rising 30-week trend line). That’s the classic setup for a market that’s still in a longer-term uptrend, but losing short-term internal traction.
Breadth dashboard (10-day window): the internals confirmed the warning

Yesterday’s report already showed participation thinning (sub-40% advancers, fewer stocks above key averages). Today’s data turns that from “early caution” into “confirmed deterioration.”
Daily breadth: decisively bearish
-
Advancers: 33.4% vs Decliners: 63.2%
-
Big downside days dominated: Decliners -4%: 7.5% vs Advancers +4%: 1.9%
This is not a benign pause. When the -4% decliners meaningfully outnumber +4% advancers, the market is telling you distribution is spreading beyond a handful of names.
Trend participation: slipping below key thresholds
-
% above SMA20: 47.5% (back below 50%)
-
% above SMA50: 46.4%
-
% above SMA200: 58.5% (still healthy-ish)
This is an important mix: longer-term structure still okay (SMA200+ remains elevated), but the short- and medium-term layers are eroding. That typically translates into choppy price action, failed breakouts, and fewer clean trend setups.
Breakouts are drying up fast
-
New highs (NH): 2.2% (down sharply from the 9–12% burst earlier in the window)
-
New lows (NL): 1.5% (still not extreme, but creeping higher)
This is one of the most telling shifts of the week: the market isn’t “crashing,” but it’s stopping rewarding strength. That’s how rallies lose momentum — first, fewer leaders push to new highs; then, more stocks start slipping under moving averages; then, the indexes finally follow.
Weekly breadth flipped hard lower
- Adv Week: 33.1% vs Decl Week: 65.8%
That’s the big escalation versus the prior session. A weak day is one thing; when the weekly breadth rolls over this far, it raises the odds the market is transitioning from “dip-and-rip” into “sell-the-rally.”
Medium-term backdrop: not broken, but no longer supportive
-
Adv Month: 62.1% / Decl Month: 37.1% (still positive)
-
Adv 3 Month: 44.6% / Decl 3 Month: 54.4% (still negative bias)
-
Adv 25% (3M): 8.6% / Decl 25% (3M): 12.3% (more deep losers than deep winners)
So we’re not in a market with broad upside thrust. It’s more consistent with a tape where strength is concentrated and fragile, and weakness is slowly spreading.
What this likely means for traders (human context)
Today has the feel of a market where confidence is thinning and participants are less willing to “buy first, ask questions later.” Even without pinning the move to any single headline, the data reads like a risk-reduction day: fewer advancers, more hard down moves, and collapsing new highs.
In practice, that usually shows up as:
-
More failed breakouts and “pop-and-drop” action.
-
More mean reversion (chop) instead of smooth trends.
-
A higher premium on risk management and selectivity.
Breadth trend rating (1–7)
Rating: neutral, negative bias.

The long-term trend (weekly structure / rising 30-week line) still argues against calling this outright “bearish.” But the short-term breadth damage is now too clear to ignore: daily/weekly internals deteriorated, participation under key moving averages is slipping below 50%, and new highs have collapsed.
Tactical levels to watch next
-
SPY: can it reclaim the EMA21 quickly, or does it drift toward the mid-650s support zone?
-
QQQ: biggest tell, if it can’t stabilize, breadth usually continues to weaken. Watch the ~590 support area.
-
IWM: relative steadiness helps sentiment, but only if small caps stop joining the selloffs.
If we see another session where decliners dominate and SMA20+/SMA50+ keep sliding, the probability rises that this is more than a one-day shakeout.
Kristoff
Next to read: Blue Owl Blinks, and the AI Trade Finally Flinches