
Index overview (SPY, QQQ, IWM)
Short Term (Daily)
Long Term (Weekly)
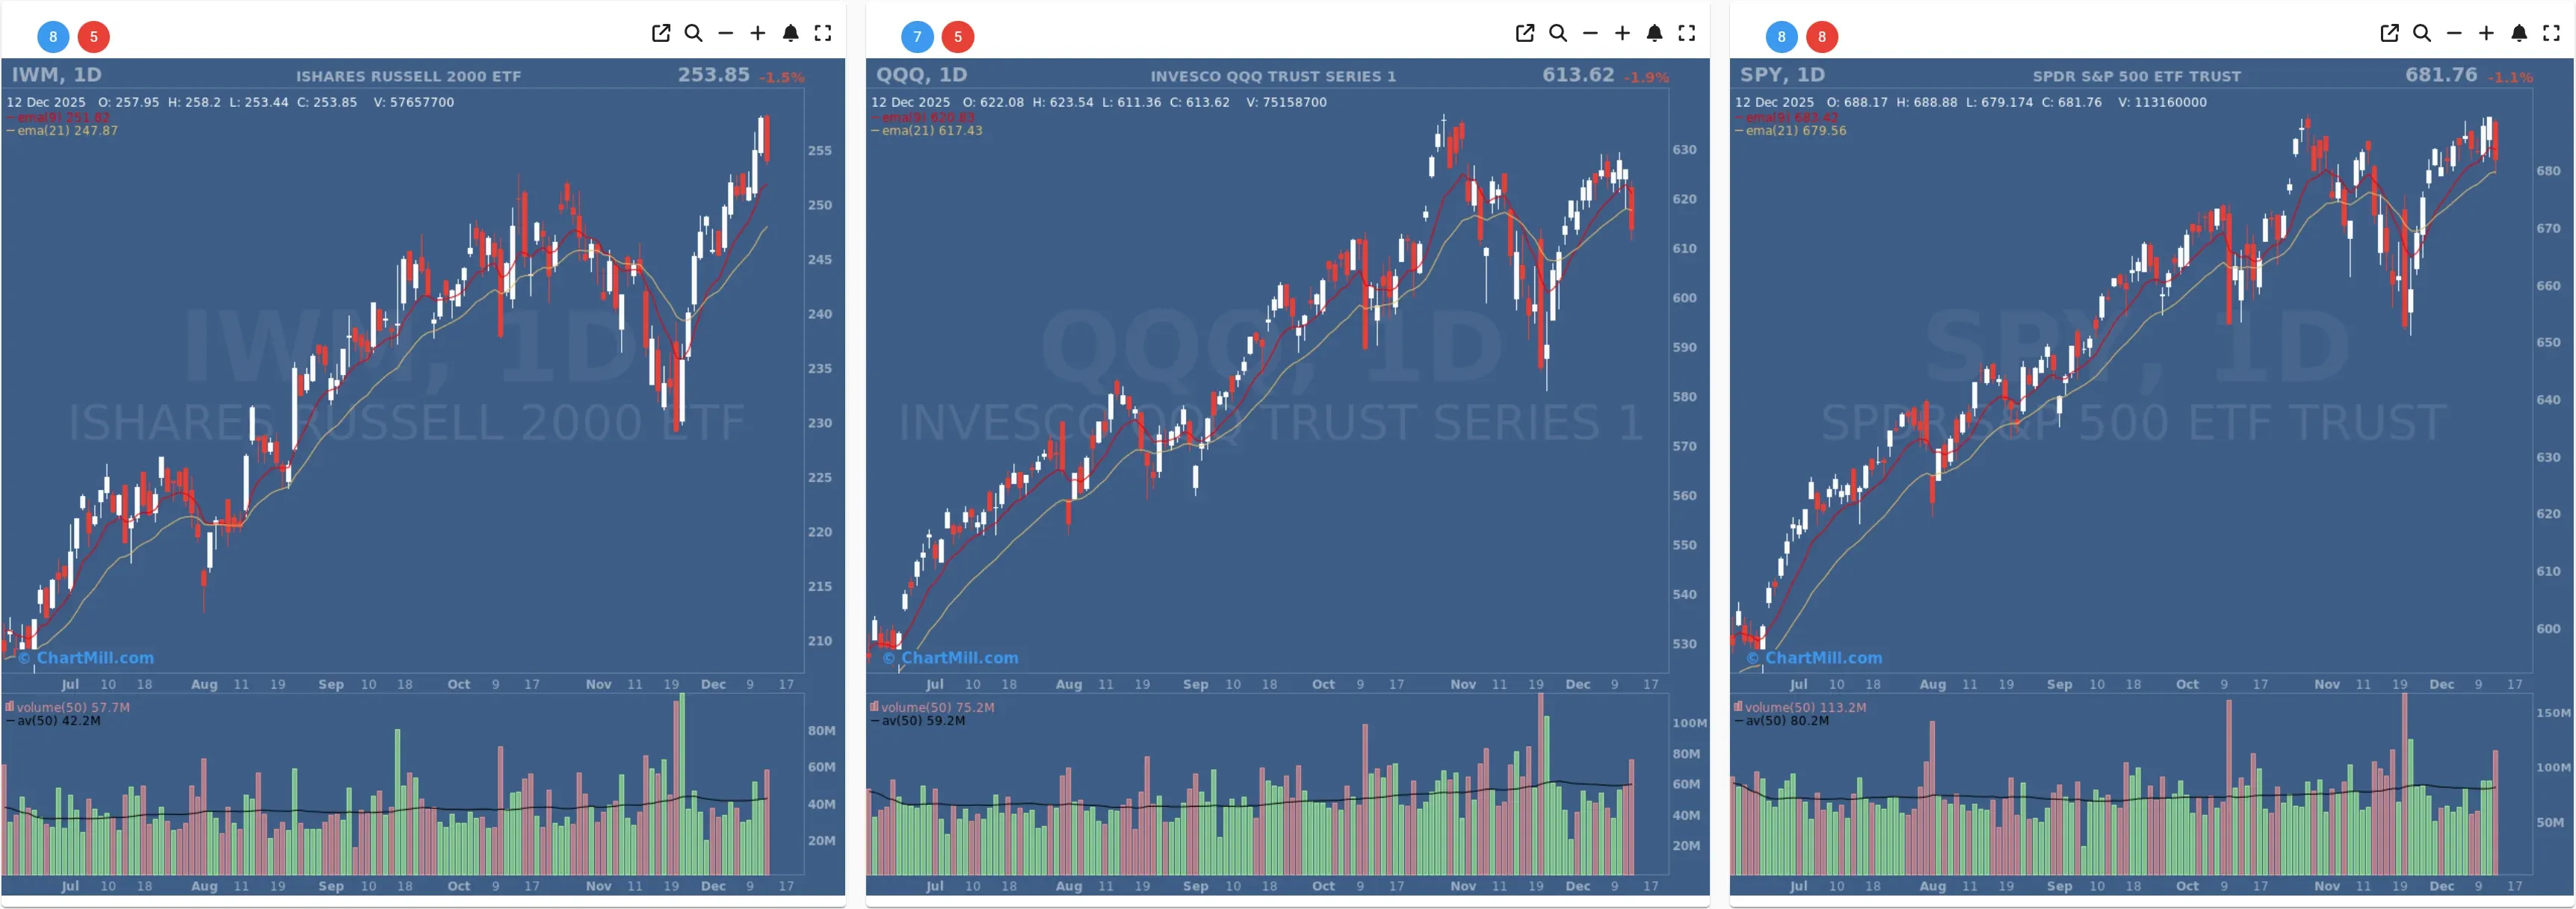
SPY
SPY slipped -1.1% to 681.76, and the candle closed below the EMA9 (≈683.4) but still above the EMA21 (≈679.6). That’s classic “pullback within an uptrend” behavior: short-term momentum cools, but the intermediate trend hasn’t cracked. Importantly, the drop came on elevated volume vs the 50-day average, which adds a distribution-day flavor and makes the move harder to dismiss.
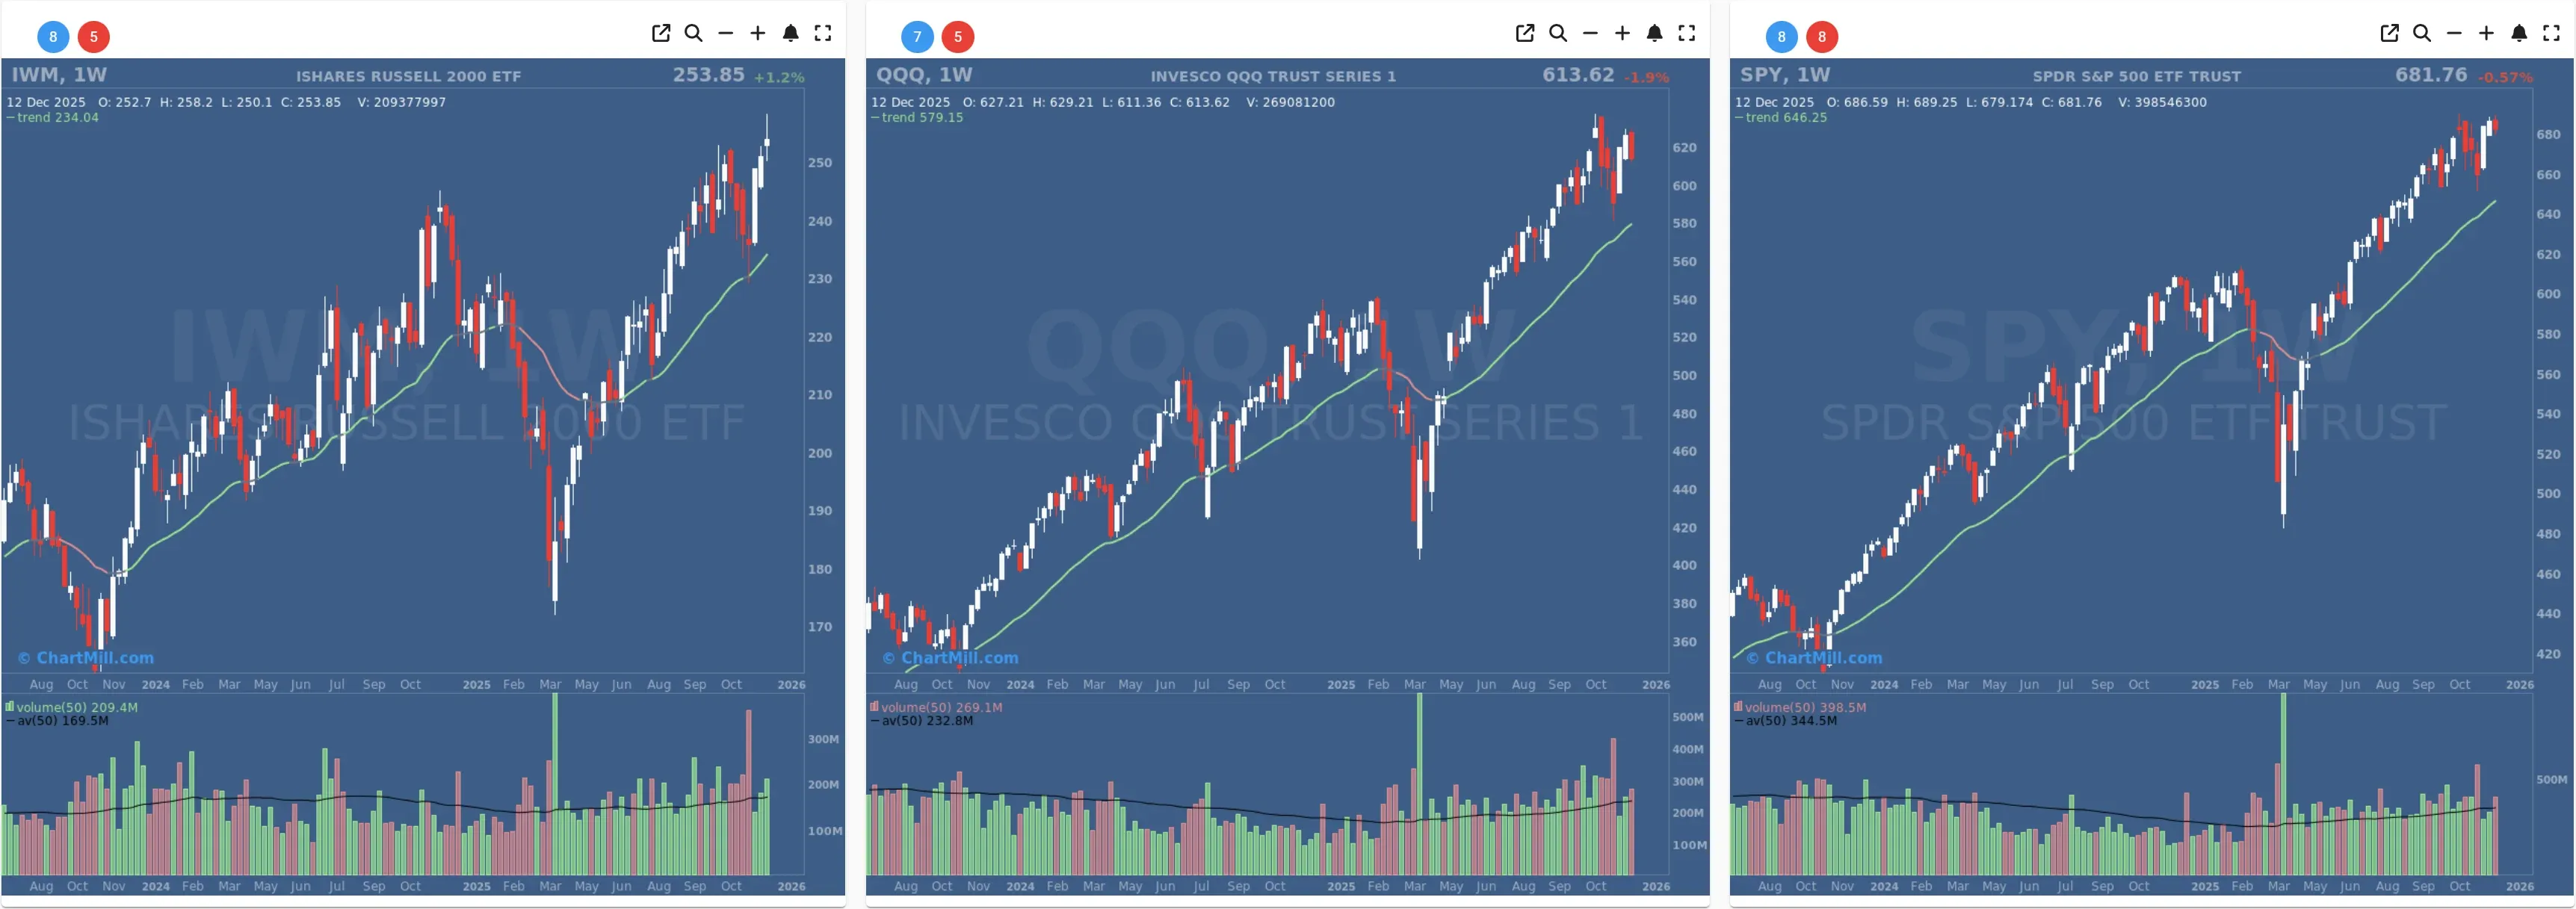
On the weekly chart, SPY remains firmly above the 30-week trend line (green / positive long-term trend), though the week finished modestly negative (~ -0.6%). Long-term trend: still intact.
QQQ
QQQ was the weak spot: -1.9% to 613.62, closing below both EMA9 (~617.8) and EMA21 (~617.4). That’s a meaningful change versus the “hold-the-dips” tone seen earlier in the week, and it hints that leadership is temporarily rotating away from growth/mega-cap tech.
Like SPY, QQQ also traded on higher-than-average volume, reinforcing that this wasn’t just a quiet drift lower.
Weekly trend is still green, with price above the 30-week trend line—but the short-term damage is more pronounced here than in SPY or IWM.
IWM
IWM fell -1.5% to 253.85, still comfortably above the EMA21 (~247.9) & EMA9 (~251.8). Despite the down day, IWM continues to look like the “relative strength” index of this trio on a multi-week basis.
On the weekly chart, IWM actually finished up on the week (~+1.2%) and remains well above its green 30-week trend line. That’s a notable rotation signal: small caps are holding up better even while Nasdaq breadth softens.
Market breadth dashboard (10-day lens)

Thursday’s picture looked like breadth was re-accelerating. Friday reversed that tone sharply:
Daily participation flipped hard risk-off
- Advancers: 27.1% (down sharply from 61% the prior day)
- Decliners: 70.2% (up from 35.8%)
This is a broad “sell” day internally, far more decisive than the index declines alone might suggest.
Downside intensity increased
- Advancing >4%: 2.2%
- Declining >4%: 6.8% (up materially vs 2.5% prior day)
That jump in >4% decliners is the clearest “stress” signature in the table: more stocks weren’t just down, they were down hard.
Trend participation remains surprisingly sturdy
Even after Friday’s hit, the backbone measures remain healthy:
- Above SMA(20): 64.1% (still strong, but down from 71.8%)
- Above SMA(50): 53.1%
- Above SMA(100): 53.6%
- Above SMA(200): 60.3%
So yes, momentum cooled, but the market is not in a “breadth breakdown” regime where these figures are collapsing below 50% across the board.
New highs still outpace new lows
- New Highs: 7.9% (lower than 11.7%, but still constructive)
- New Lows: 1.0% (still contained)
That’s an important stabilizer: Friday looked like a broad pullback, not a market that’s suddenly spawning a wave of breakdowns.
Weekly/monthly breadth: still positive
- Week: 52.2% adv / 46.6% decl (cooling from Thursday’s very strong 62.6/36.3)
- Month: 61% adv / 38.4% decl (still clearly positive)
The monthly line matters most here: the broader participation trend is still leaning bullish despite the one-day shock.
What changed vs Thursday’s “breadth recovery” signal?
Thursday’s internals suggested buyers were regaining control. Friday didn’t erase the bigger picture, but it did send a warning: The market can still rally on decent participation, but leadership is more fragile than it looked 24 hours ago.
The fact that QQQ lost both EMA9 and EMA21 while IWM held up better fits a rotation narrative rather than a uniform breakdown.
The surge in >4% decliners is the main yellow flag: that tends to show up when sellers become more urgent (even if temporarily).
Bottom line
Friday was a high-importance pullback day internally: broad decliners, more extreme downside, and heavier volume. However, the medium-term participation structure (stocks above key SMAs, contained new lows, positive monthly breadth) still argues this is more likely a reset/pause than the start of an outright bearish breadth trend.
If weakness continues, watch whether:
SMA(50)+ and SMA(100)+ slip back below 50% decisively, and new lows start expanding meaningfully above ~1–2%, that’s usually when “pause” becomes “damage.”
Breadth trend rating: Neutral, with a positive bias.

Short-term breadth took a hit, but the longer-horizon participation and trend structure remain constructive—so the tape looks like it’s cooling, not breaking.
Kristoff - ChartMill
Next to read: AI Hangover Hits the Tape: Broadcom’s Face-Plant Spooks the Whole Complex