
Index overview – SPY, QQQ and IWM
Short Term (Daily)
Long Term (Weekly)

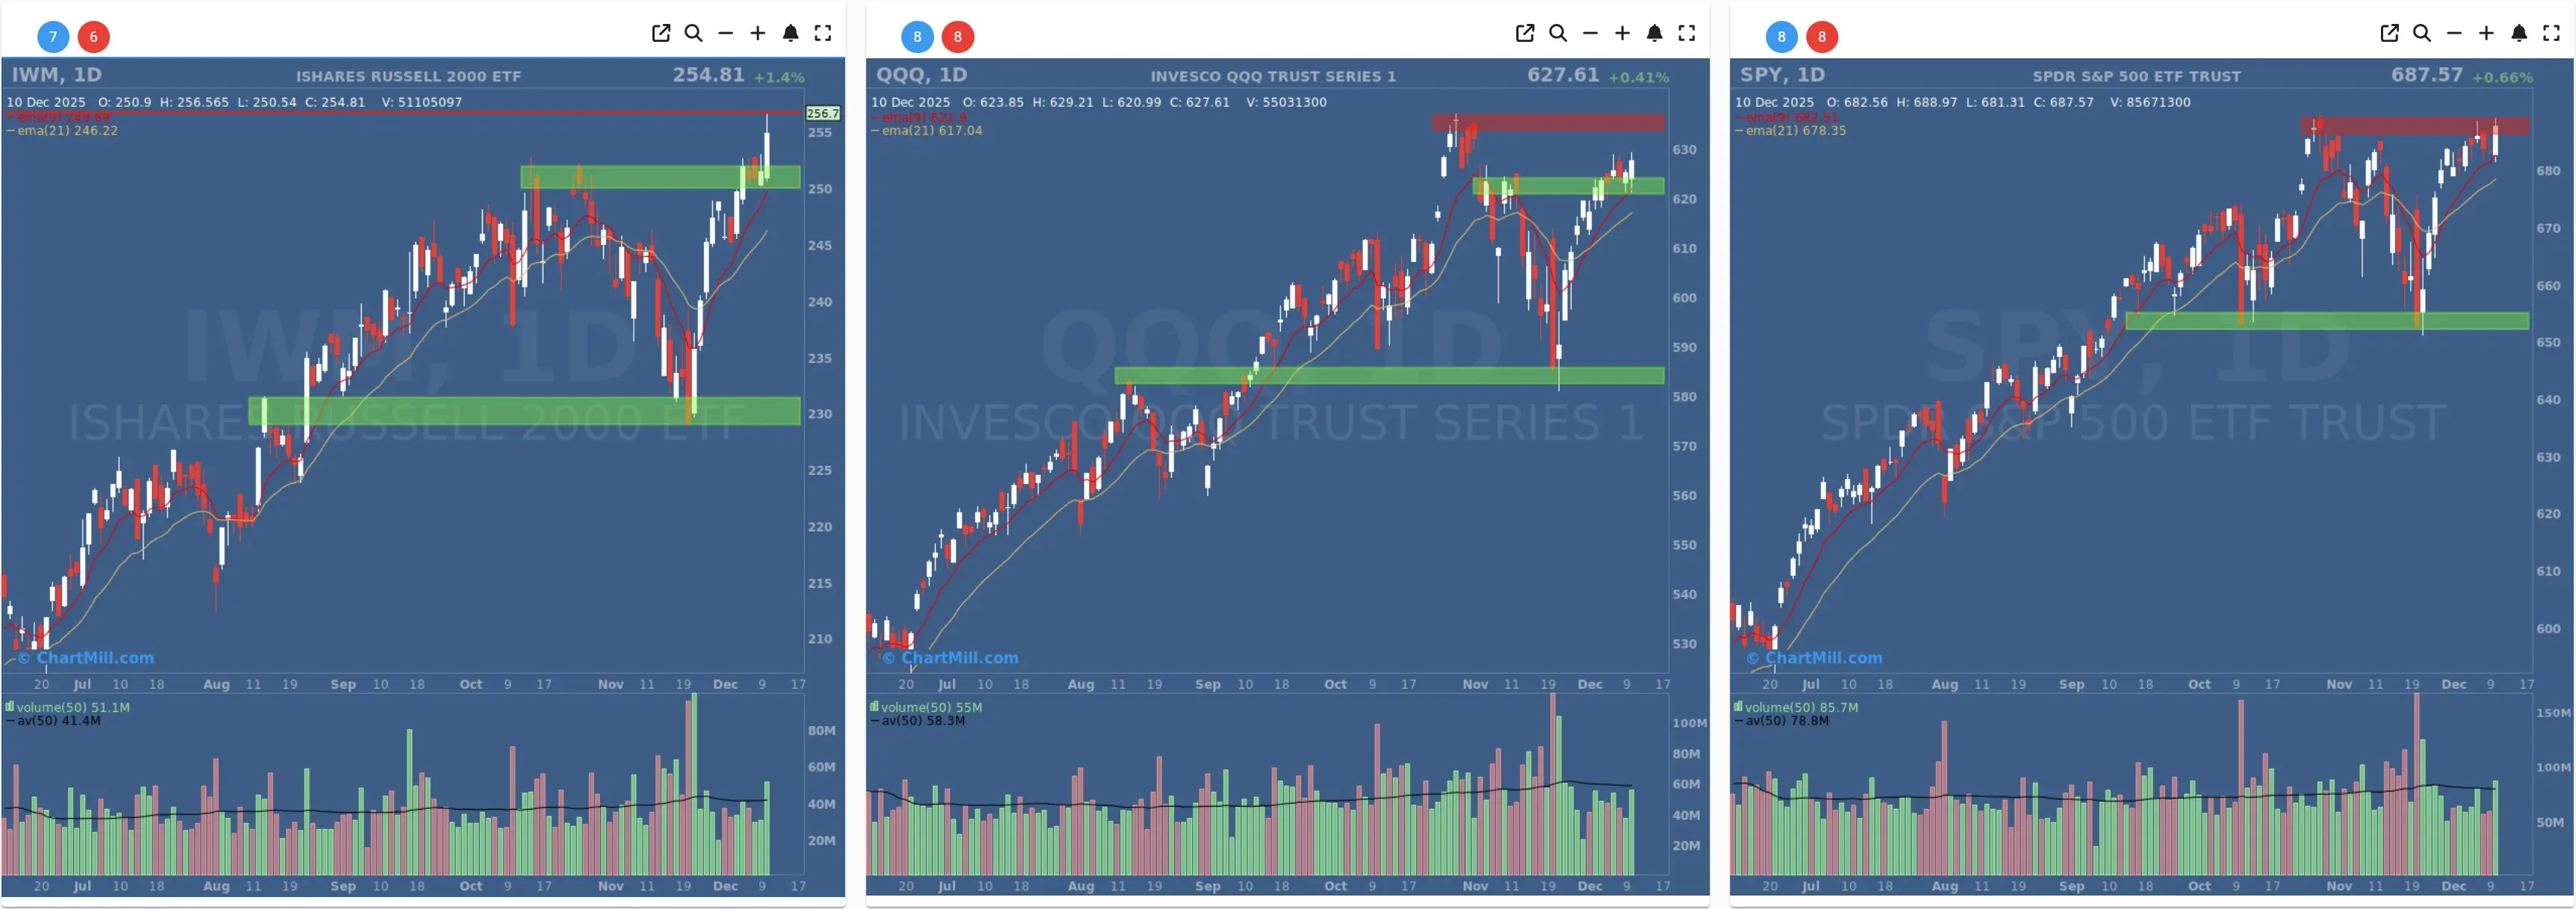
IWM was the clear outperformer on Wednesday, closing around +1.4% at new highs near the 255 area.
On the daily chart, price pushed into fresh high ground above the recent consolidation band around 246–252. It is well above both the EMA9 and EMA21, which are rising and fanned out – classic strong-trend behavior.
On the weekly chart, the ChartMill Trend Indicator (30-week EMA) is firmly green, and price is extended above it after breaking out from the summer range. Small caps continue to confirm a positive long-term trend and are now acting as leadership.
QQQ added about 0.41%, staying just below its short-term resistance zone around 630.
Daily: QQQ is trading above its EMA9 and EMA21, with a tight consolidation just under overhead resistance. Tuesday’s rebound off the 620 support band has seen mild follow-through rather than immediate rejection, which fits with improving breadth.
Weekly: The long-term trend remains strongly green, with the 30-week EMA steeply rising and price holding near all-time highs in a multi-week sideways range.
SPY gained roughly 0.66%, also hovering just under its recent high zone around 685–690.
Daily: SPY continues to oscillate in a relatively narrow band beneath resistance, supported by a well-defined demand zone in the mid-650s. Price remains above both EMA9 and EMA21, which are still rising, suggesting a bullish consolidation rather than a topping pattern at this stage.
Weekly: As with QQQ, the ChartMill Trend Indicator is solidly green, highlighting a mature but intact long-term uptrend.
Compared with Tuesday (Dec 9):
The index picture is mostly a continuation: SPY and QQQ are still digesting prior gains just below resistance, while IWM has shifted from “attempting a breakout” to “pushing away from it.”
There is no sign yet that Monday’s sell-off (Dec 8) has morphed into a larger top. Instead, the last two sessions support the “shakeout within an ongoing uptrend” interpretation we discussed yesterday.
Short-term breadth – strong follow-through
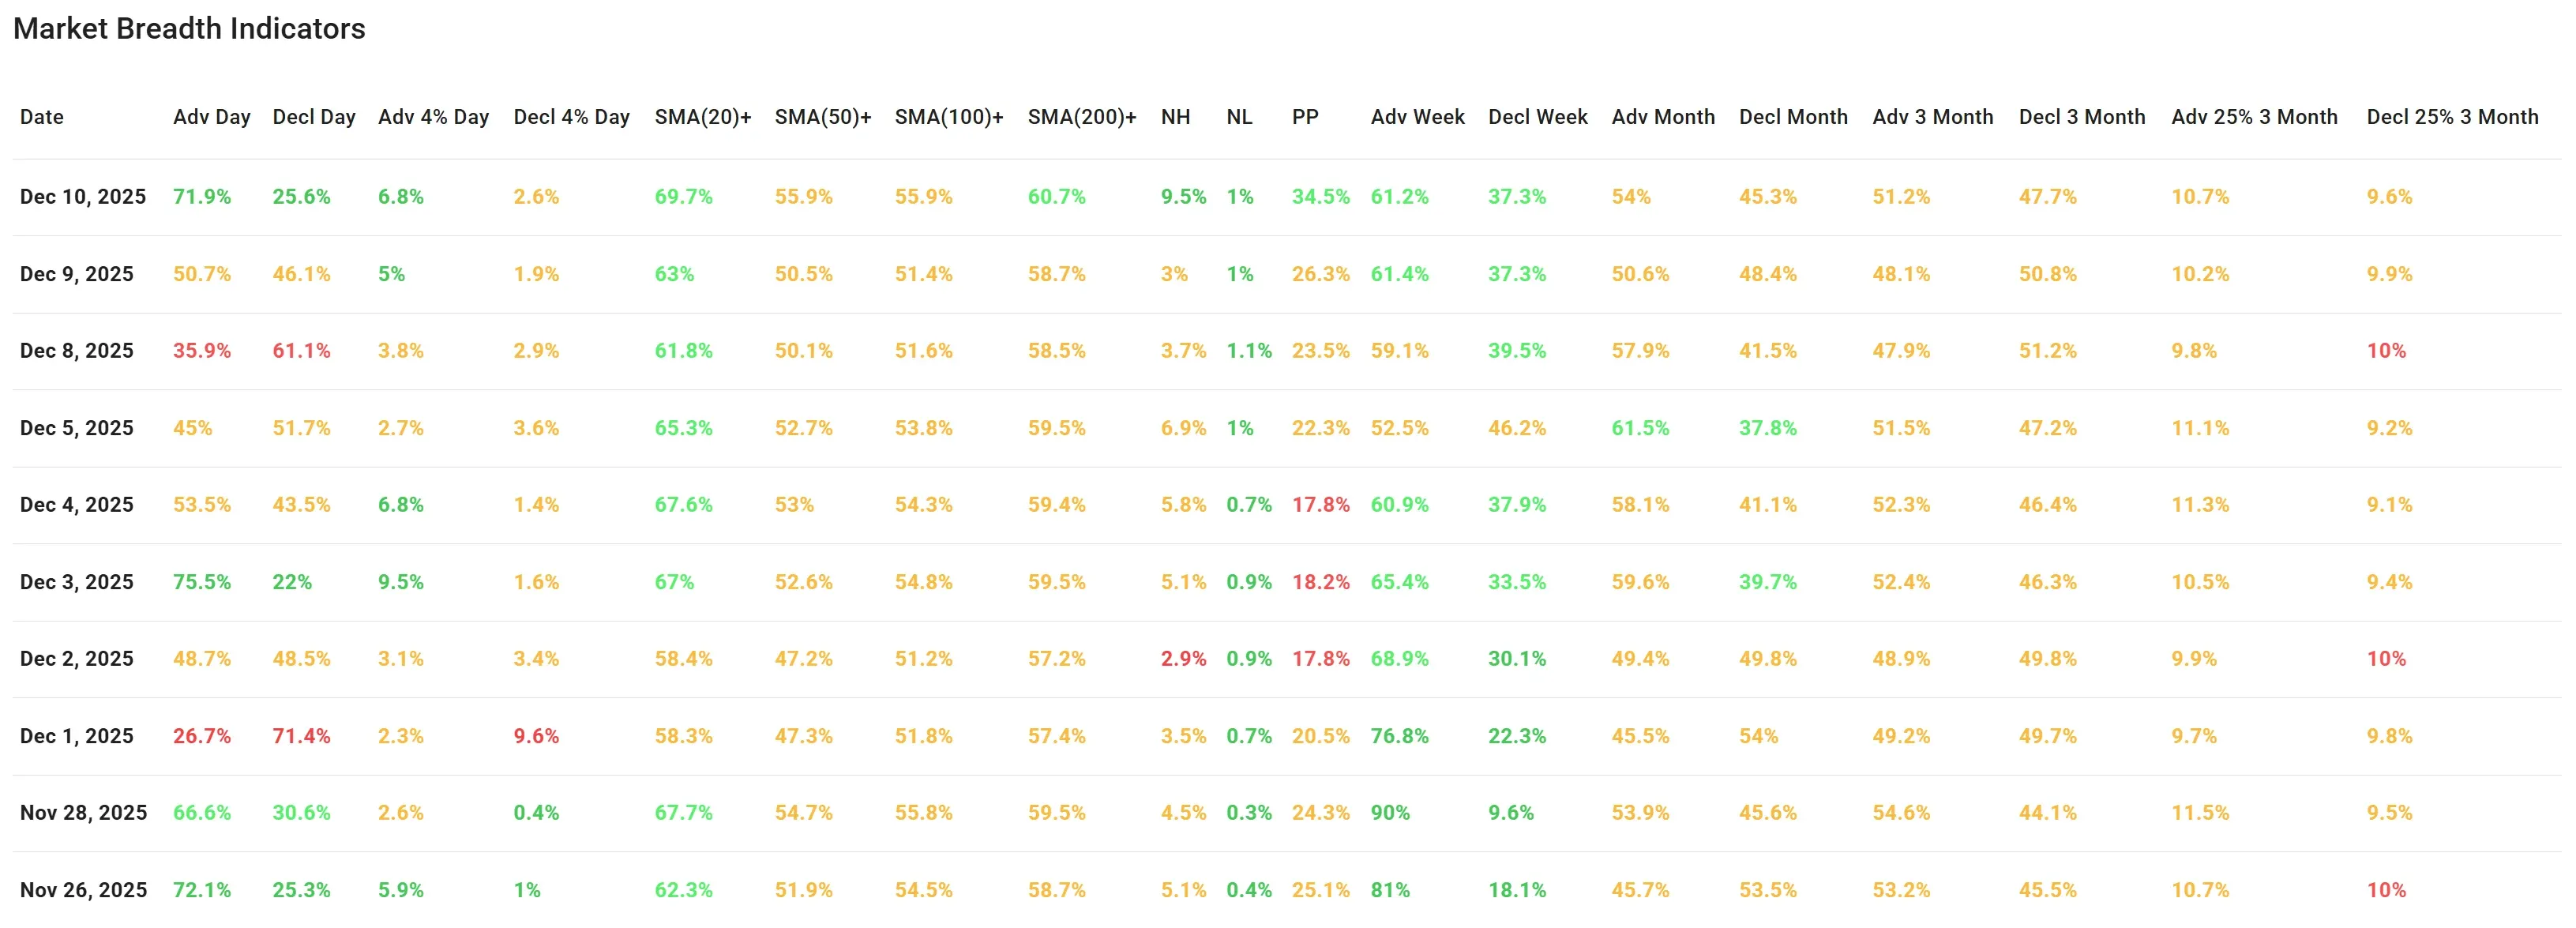
The daily advancers/decliners data show a clear broadening of the rebound:
-
Adv Day: jumps from 50.7% (Dec 9) to 71.9% (Dec 10).
-
Decl Day: drops from 46.1% to 25.6%.
So Wednesday wasn’t just a marginal win for the bulls; it was a genuinely broad up day.
Among the more extreme movers:
-
Adv 4% Day: rises from 5.0% to 6.8%.
-
Decl 4% Day: edges up slightly from 1.9% to 2.6%, but remains modest.
This mix is healthy: we see more strong winners but not yet the kind of blow-off spike in 4% movers that often accompanies short-term exhaustion. It reads as a solid, orderly up session.
The new highs/new lows picture improves notably:
-
New Highs (NH): surge from 3.0% to 9.5%.
-
New Lows (NL): stay at 1.0%.
On Monday we saw breadth get hit hard; by Tuesday the pressure eased, and by Wednesday new highs have decisively reasserted themselves while new lows remain subdued. That’s a classic sign that the pullback failed to do lasting damage to the uptrend’s leadership.
Medium-term participation – 20/50/100/200-day SMAs
The percentage of stocks trading above key moving averages improves across the board:
-
SMA(20)+: 69.7% (up from 63.0%).
-
SMA(50)+: 55.9% (up from 50.5%).
-
SMA(100)+: 55.9% (up from 51.4%).
-
SMA(200)+: 60.7% (up from 58.7%).
Two points stand out:
-
Short-term repair is now visible in the 20-day numbers. After Monday’s dip this gauge briefly threatened to roll over; yesterday it stabilized, and today it has pushed back toward the high-60s.
-
The 50-, 100- and 200-day readings never really broke down – they’ve been sitting in the low- to mid-50s for days and are now nudging higher again. That’s consistent with an ongoing cyclical bull phase where pullbacks are, so far, being bought.
The Pocket Pivot column climbs from 26.3% to 34.5%, reinforcing the message that more names are back in constructive short-term setups after Monday’s shakeout.
Weekly & monthly context – steady to improving
Because we’re mid-week, the weekly numbers move more slowly, but they remain clearly supportive:
-
Adv Week: essentially unchanged at 61.2% vs 61.4% yesterday.
-
Decl Week: flat at 37.3%.
That means that despite Monday’s weak session, the week as a whole is still firmly positive. The last two days have offset most of that earlier pressure.
On the monthly horizon, participation ticks higher:
-
Adv Month: up from 50.6% to 54.0%.
-
Decl Month: down from 48.4% to 45.3%.
So over the last 20 trading days, more than half of stocks are now higher, and the edge is widening again in favor of the bulls – another sign that Monday’s action did not fundamentally alter the prevailing trend.
3-month lens & 25% movers – leadership reasserts itself
The 3-month metrics show the most meaningful improvement today:
-
Adv 3 Month: climbs from 48.1% back above parity to 51.2%.
-
Decl 3 Month: falls from 50.8% to 47.7%.
We’re back to a slight positive skew over the last quarter, reversing the mild negative bias that appeared after Monday.
The “25% over 3 months” buckets, which capture big winners and losers, move in a constructive direction:
-
Adv 25% 3 Month: edges up from 10.2% to 10.7%.
-
Decl 25% 3 Month: dips from 9.9% to 9.6%.
The gap is not huge, but it matters: big winners again slightly outnumber big losers, consistent with what we see on the charts (strong leadership in growth and small caps, with relatively few names suffering deep, persistent drawdowns).
Overall assessment & breadth trend rating
Putting it all together:
Monday’s sharp setback still shows up in the 10-day window, but two consecutive broad up days have largely repaired the damage.
-
Small caps (IWM) are now clearly in breakout mode, while SPY and QQQ continue to consolidate just below resistance with price above rising EMA9 and EMA21, a bullish technical posture.
-
Participation across 20- to 200-day horizons is firmly above 50% and improving, and new highs have re-accelerated while new lows stay muted.
-
Over the 3-month horizon, the tape has shifted back from “roughly balanced” to a modest pro-bullish tilt, with more stocks up than down and a slight edge in the 25%-plus winners bucket.
There are still a few reasons for restraint, notably that SPY and QQQ haven’t yet broken decisively above their short-term ranges, and some indicators are coming from already elevated levels. But the weight of the evidence compared with yesterday points to strengthening, not weakening, breadth.
Breadth Trend Rating: Positive
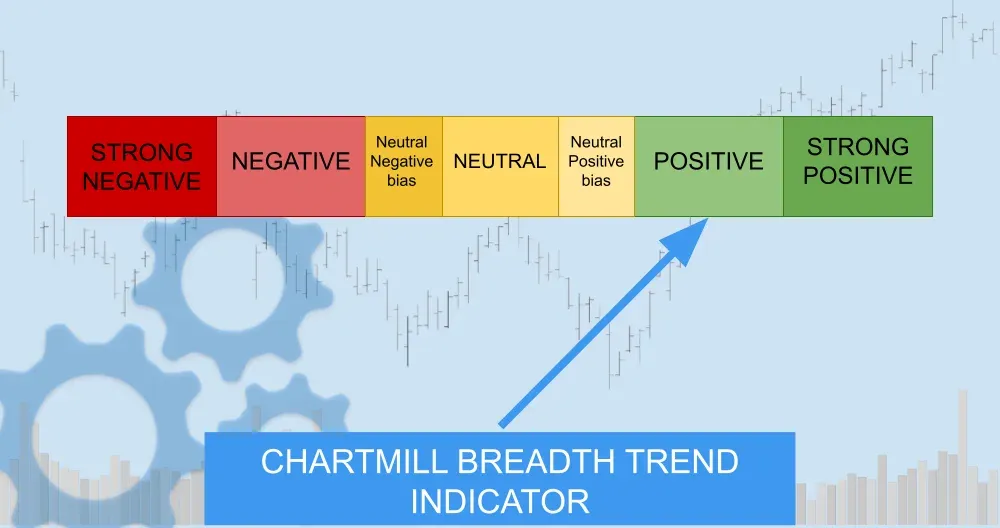
The market’s internal tone is again clearly supportive of the ongoing uptrend, with small caps leading and participation broadening across time frames.
Kristoff - ChartMill
Next to read: Fed Cut Ignites AI Power Trade While Oracle Trips the After-Hours Party