

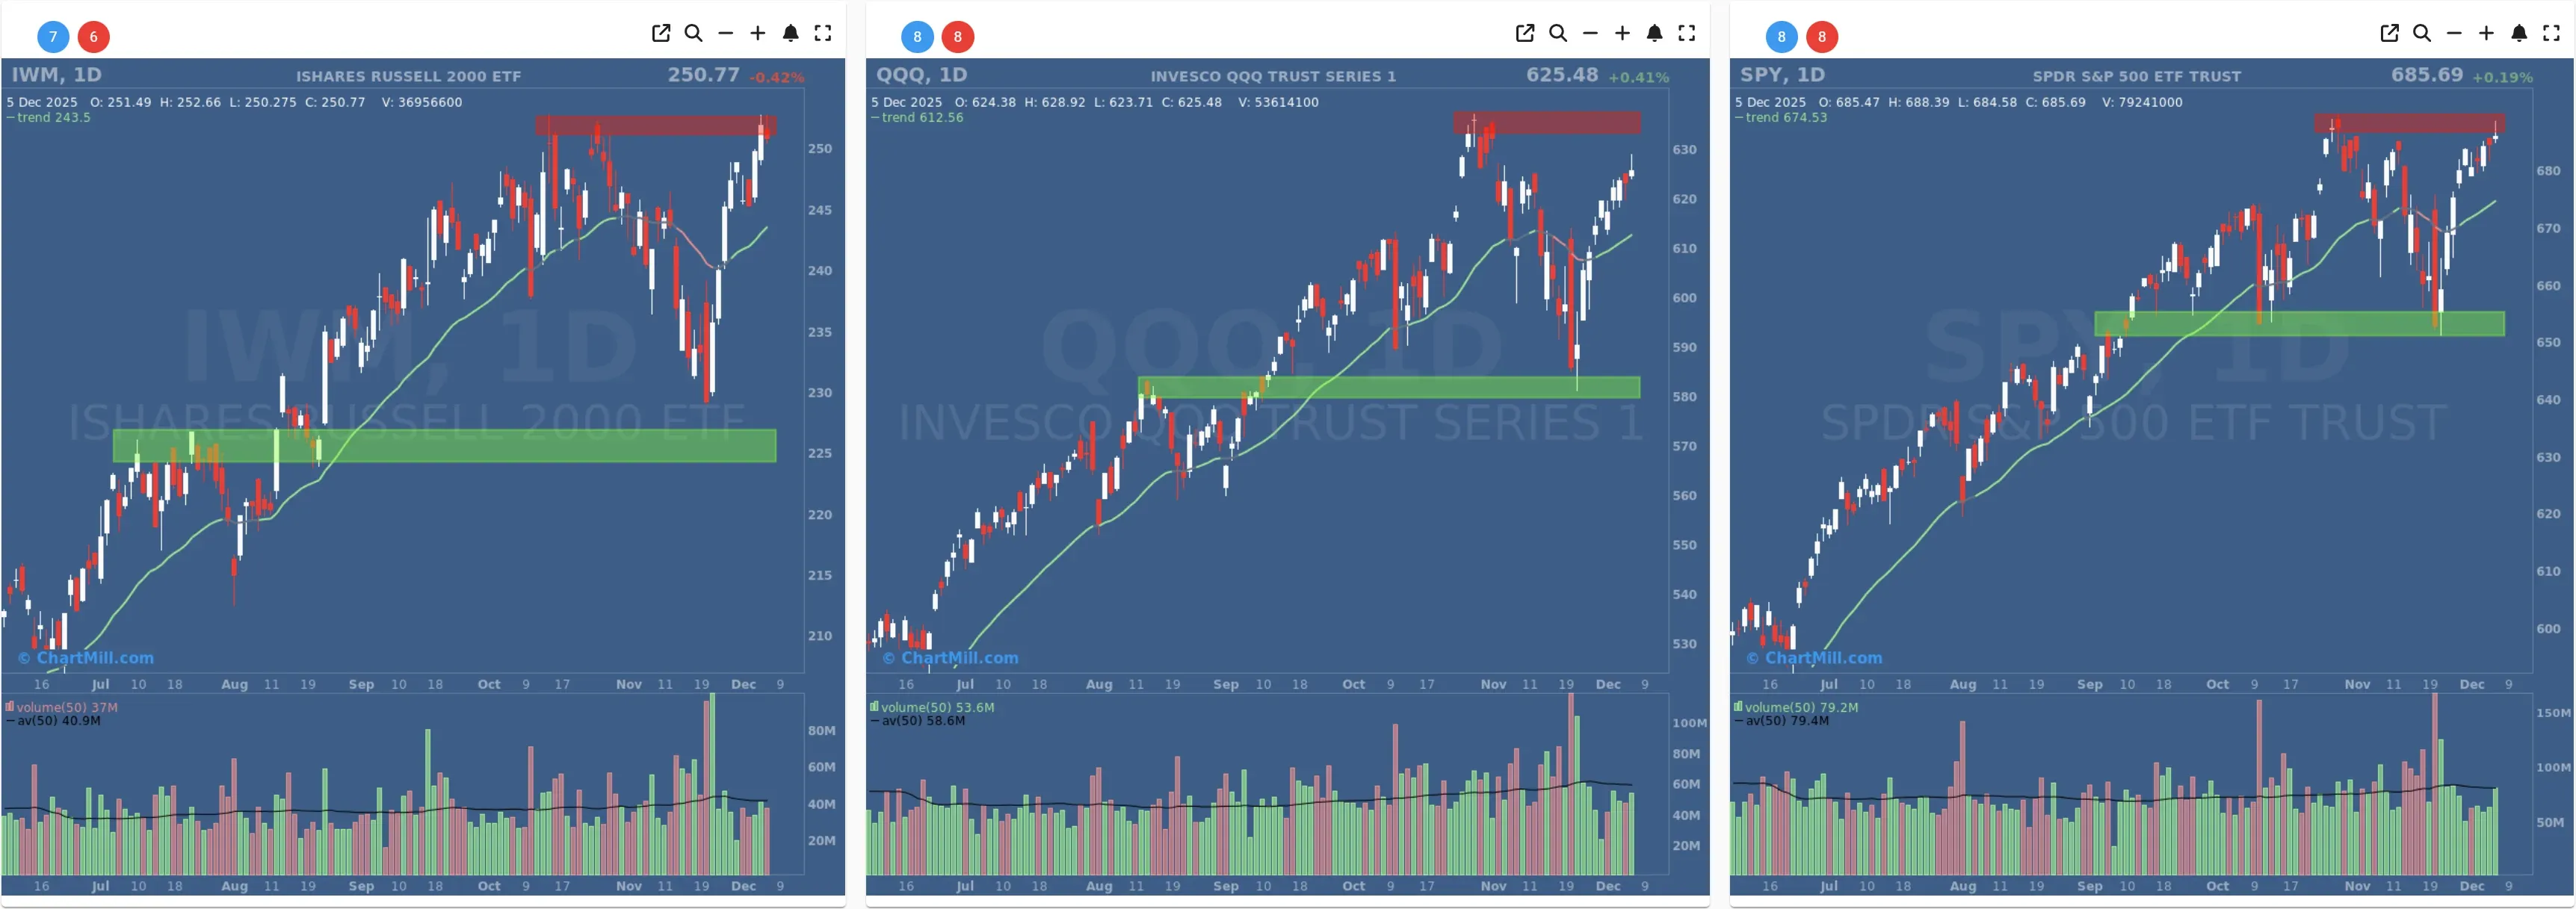
Index overview – SPY, QQQ and IWM
-
SPY added another +0.19% on Friday to close near 685.7, printing a doji candle directly against the red resistance band that has capped prices for several weeks.
-
Price remains well above the ChartMill Trend Indicator and the most recent support zone around 655–660.
-
On the weekly chart, SPY advanced about +0.34%, extending the multi-month uptrend and finishing the week at new or marginal highs after fully repairing last week’s shakeout.
Takeaway: The large-cap benchmark continues to grind higher, but the candles are getting smaller at resistance – classic signs of short-term fatigue rather than immediate breakdown.
QQQ gained about +0.41% on Friday to 625.5, also pressing into its overhead resistance band.
-
The ETF is comfortably above the ChartMill Trend Indicator and the former breakout zone around 590, which now acts as solid support.
-
On the weekly timeframe, QQQ was the relative leader with roughly +1% for the week, closing near new highs. Volatility remains contained after Monday’s shakeout, confirming that buyers quickly reasserted control.
Takeaway: Mega-cap growth and tech remain the engine of this advance. The trend is firmly up, but current levels leave little near-term margin for error.
-
IWM was the only index of the three to close lower on Friday, slipping about -0.42% to 250.8.
-
Price is still pressing against its resistance band after a sharp rebound off the 230–235 support area earlier.
-
On the weekly chart, IWM actually logged a respectable +0.81% gain for the week, confirmation that small caps participated in the rebound, even if they wobbled a bit into Friday’s close.
Takeaway: Small caps are no longer the clear laggard they were earlier in the autumn, but they’re also not breaking out ahead of the pack. Friday’s dip looks more like digestion right under resistance than a meaningful rejection so far.
Short Term (Daily)
Long Term (Weekly)

How this compares with Thursday’s picture
In Thursday’s breadth update (Dec 4), we highlighted:
-
A broad rebound from Monday’s heavy selling, with SPY and QQQ pushing back into resistance and IWM reclaiming support.
-
Improving short-term breadth (over 53% advancing issues) and an uptick in strong movers (>4% advances) signaling “risk-on” behavior again.
Friday largely continued this narrative, but with a different tone:
-
Indices held their gains and finished the week on strength, yet the intraday thrust faded, especially in small caps.
-
The breadth dashboard cooled from “broad advance” to “mild consolidation under the surface.”
So far this fits the typical pattern after a shakeout: a powerful rebound (Dec 2–3), a follow-through day (Dec 4), and then a quieter session where traders start to take profits and rotate rather than chase.
Market Breadth Dashboard – Dec 5, 2025
Daily advance/decline data
Advancing vs. declining issues:
-
Adv Day: 45%
-
Decl Day: 51.7%
This is a mildly negative breadth day, especially when compared to Thursday’s 53.5% advancers. Selling was present, but not aggressive – more of a “fade at the highs” than a broad risk-off move.
Big movers (>4%):
-
Adv 4% Day: 2.7%
-
Decl 4% Day: 3.6%
Strong upside moves dropped back sharply from Thursday’s 6.8% reading, while downside volatility ticked higher. This confirms less chasing to the upside and a bit more selective profit taking.
Context vs earlier in the week:
-
Monday’s flush (Dec 1) saw only 26.7% advancers and 9.6% of stocks falling more than 4% – a clear distribution day.
-
By Wednesday (Dec 3), advancers peaked at 75.5%, illustrating how quickly dip buyers stepped in.
-
Friday’s 45% is mid-range, consistent with consolidation after that sharp rebound.
Trend participation (MAs)
Percentage of stocks above key moving averages:
-
SMA(20)+: 65.3% (vs 67.6% Thu)
-
SMA(50)+: 52.7% (vs 53% Thu)
-
SMA(100)+: 53.8% (vs 54.3% Thu)
-
SMA(200)+: 59.5% (vs 59.4% Thu)
Short-term momentum cooled slightly (small downtick in 20-day participation), but medium- and long-term trend breadth remains remarkably stable and elevated, well over half of the universe sits above its 100- and 200-day MAs.
Even after Monday’s pullback and Friday’s softer session, no structural damage shows up in these trend gauges.
This is what a healthy uptrend usually looks like near the highs: price indices wobble at resistance while underlying participation remains solid rather than collapsing.
New highs, new lows & pivot participation
-
New Highs (NH): 6.9%
-
New Lows (NL): 1%
New highs continued to rise through the week (from 2.9% on Dec 2 → 5.1% on Dec 3 → 5.8% on Dec 4 → 6.9% on Dec 5), even as daily breadth cooled. New lows remain extremely low, hovering around 1%.
Message: Leadership is broadening slowly, not narrowing – a constructive sign.
Weekly, monthly and 3-month perspective
-
Adv Week: 52.5%
-
Decl Week: 46.2%
For the week ending Dec 5, breadth was modestly positive, lining up with the small weekly gains in SPY, QQQ and IWM.
-
Adv Month: 61.5%
-
Decl Month: 37.8%
Roughly three out of five stocks are higher than a month ago, reflecting the strong November–early December rebound.
-
Adv 3 Month: 51.5%
-
Decl 3 Month: 47.2%
On a three-month horizon, the market is balanced to slightly positive, showing that the advance is not limited to just a handful of mega caps.
Extreme movers over 3 months (±25%):
-
Adv 25% 3 Month: 11.1%
-
Decl 25% 3 Month: 9.2%
There are slightly more big winners than big losers, but the gap isn’t extreme. This supports the idea of a sustainable, trending market rather than a blow-off phase.
Putting it all together
-
Indices are extended but intact.
-
After the dramatic breadth swing from Monday’s selloff to Wednesday’s broad rally, Friday’s 45% advancers tell us the market is catching its breath.
-
Strong movers on the upside have thinned out, which often precedes a short period of range-bound trade or shallow pullback.
-
More than half of stocks remain above their 50-, 100- and 200-day MAs.
-
New highs continue to edge higher, with new lows pinned near 1%.
-
Weekly and monthly metrics confirm that the advance is still broad enough to be trusted, even if near-term reward-to-risk is less favorable at these elevated index levels.
Risk-reward at the index level vs. individual setups.
-
For index investors, this environment argues for staying aligned with the prevailing uptrend but being mentally prepared for short-term noise around these highs.
-
For active stock-pickers, the continued rise in new highs indicates there are still selective breakout and trend-following opportunities, though entries should be chosen carefully given how far indices have come since the October lows.
Breadth trend rating
Current breadth trend score: Positive.
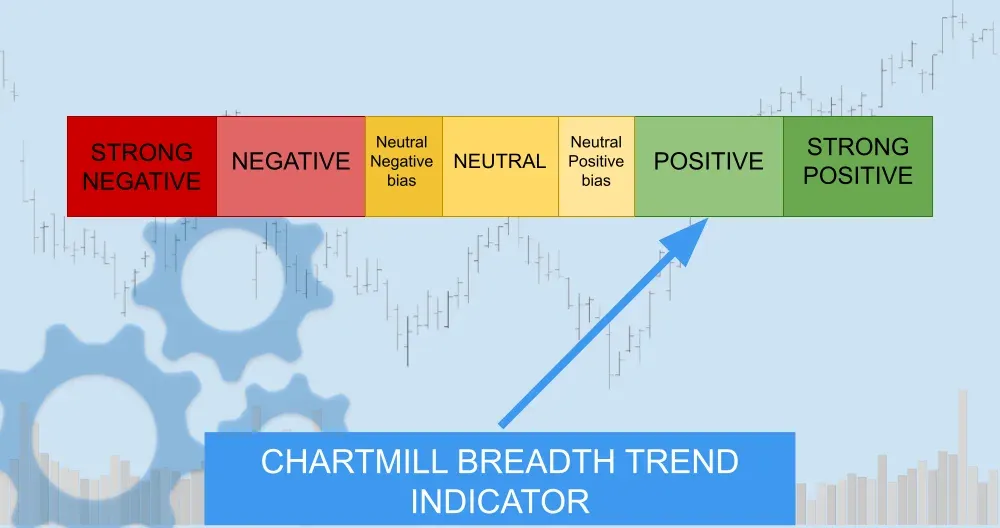
Why not “very positive”?
-
Friday’s softer daily breadth and the drop-off in strong upside movers show that the immediate momentum from earlier in the week is cooling.
-
Indices are at resistance, and small caps in particular are hesitating, which raises the odds of short-term consolidation or a shallow pullback.
Why still “positive” rather than neutral?
-
Trend participation remains strong across all key moving averages.
-
New highs are increasing, new lows are minimal, and weekly/monthly breadth is clearly tilted in favor of the bulls.
In short, the market enters the new week with healthy but somewhat extended breadth: the bigger trend remains up, but the easy, broad-based thrust phase looks to be giving way to a more selective and choppy phase at the highs.
Kristoff - ChartMill
Next to read: Netflix’s $83 Billion Plot Twist Leaves Wall Street Calm but Cautious