
Index overview (SPY, QQQ, IWM)
Short Term (Daily)
Long Term (Weekly)
SPY
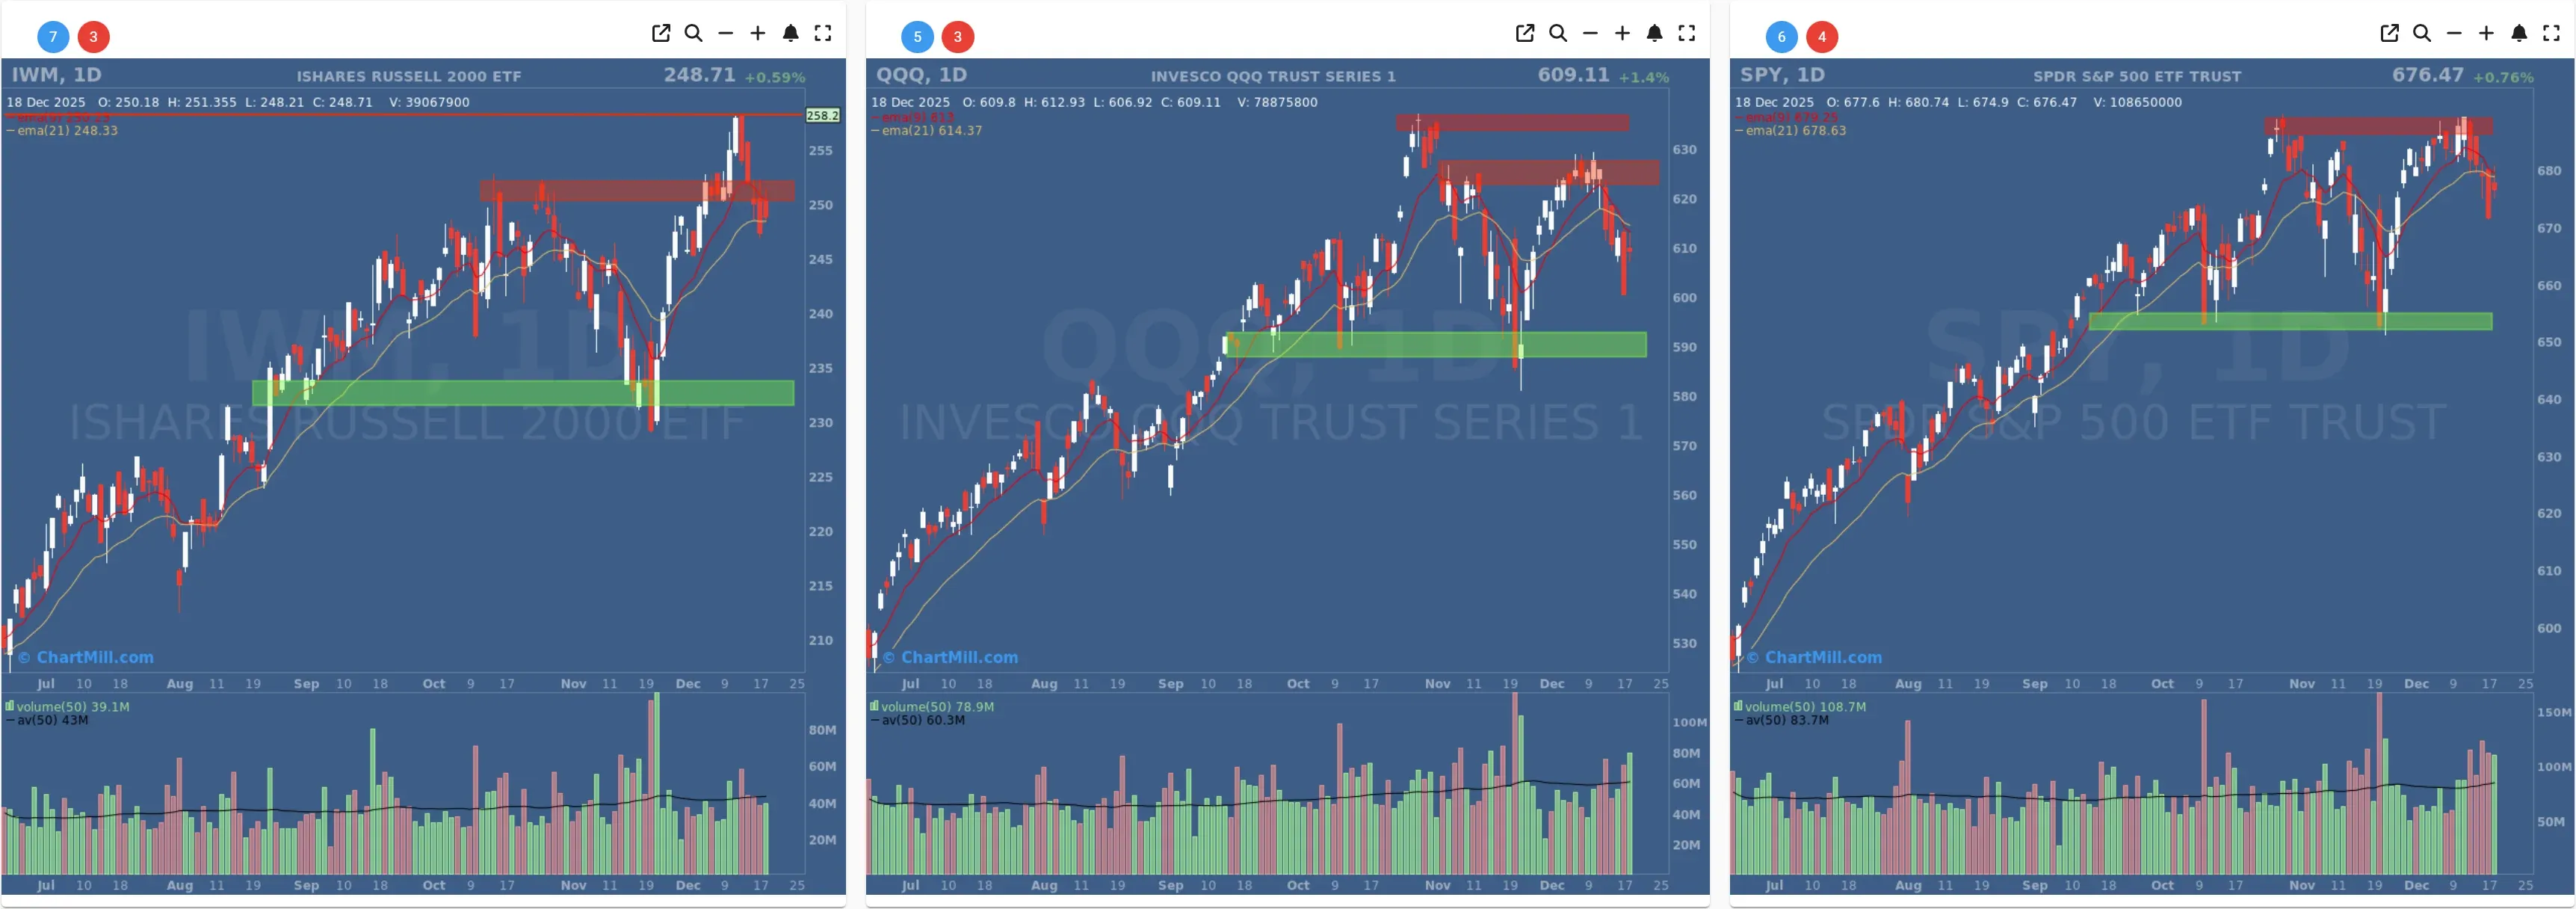
Daily: SPY finished higher on the day, but the chart still looks repair-mode: price is hovering around the fast averages while EMA21 remains overhead, with visible resistance/supply above the market (the red zone). In other words: a bounce, but not a clean trend resume yet.
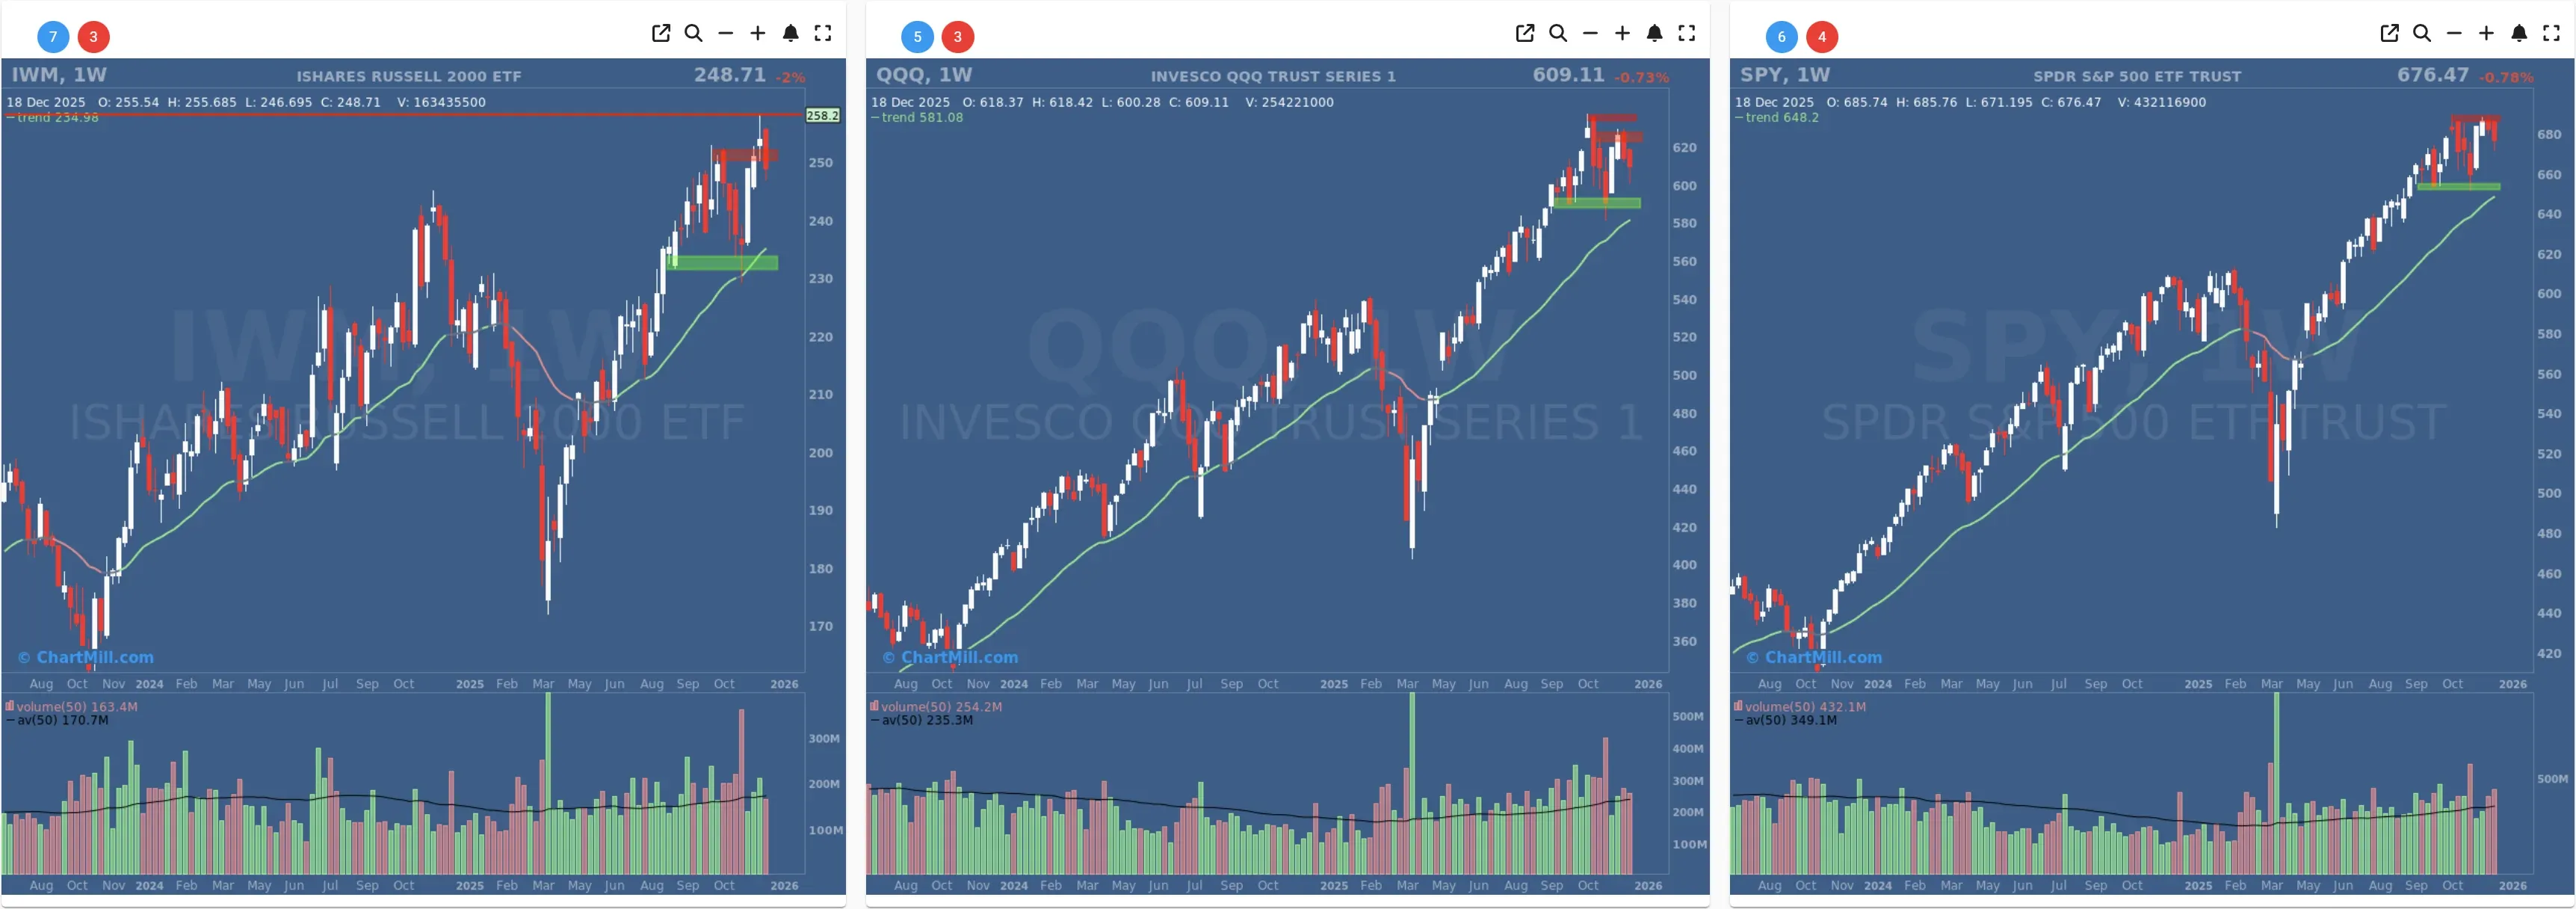
Weekly (Trend Indicator / 30-week EMA): The longer-term structure still looks constructive (price remains well above the rising 30-week EMA). However, recent weeks show hesitation near the highs, this is consistent with “uptrend, but tightening risk control.”
QQQ
Daily: The bounce was stronger here, but QQQ remains below its short-term averages and under a stacked resistance area. This lines up well with what we flagged yesterday: the EMA9/EMA21 bearish crossover created technical “gravity,” and one strong day doesn’t automatically undo that.
Weekly: Still an uptrend on the bigger picture (above a rising 30-week EMA), yet the recent pullback suggests the market is digesting gains rather than accelerating.
IWM
Daily: IWM also bounced, but it’s still chopping beneath/around the fast averages and directly under a well-defined resistance band. This is typical of small caps in a “two steps forward, one step back” phase.
Weekly: Longer-term trend remains intact, but the recent stall near the highs suggests small caps are participating, but not leading aggressively right now.
Market breadth dashboard (what the data says)
Daily breadth: rebound day (and healthier tape than Wednesday)
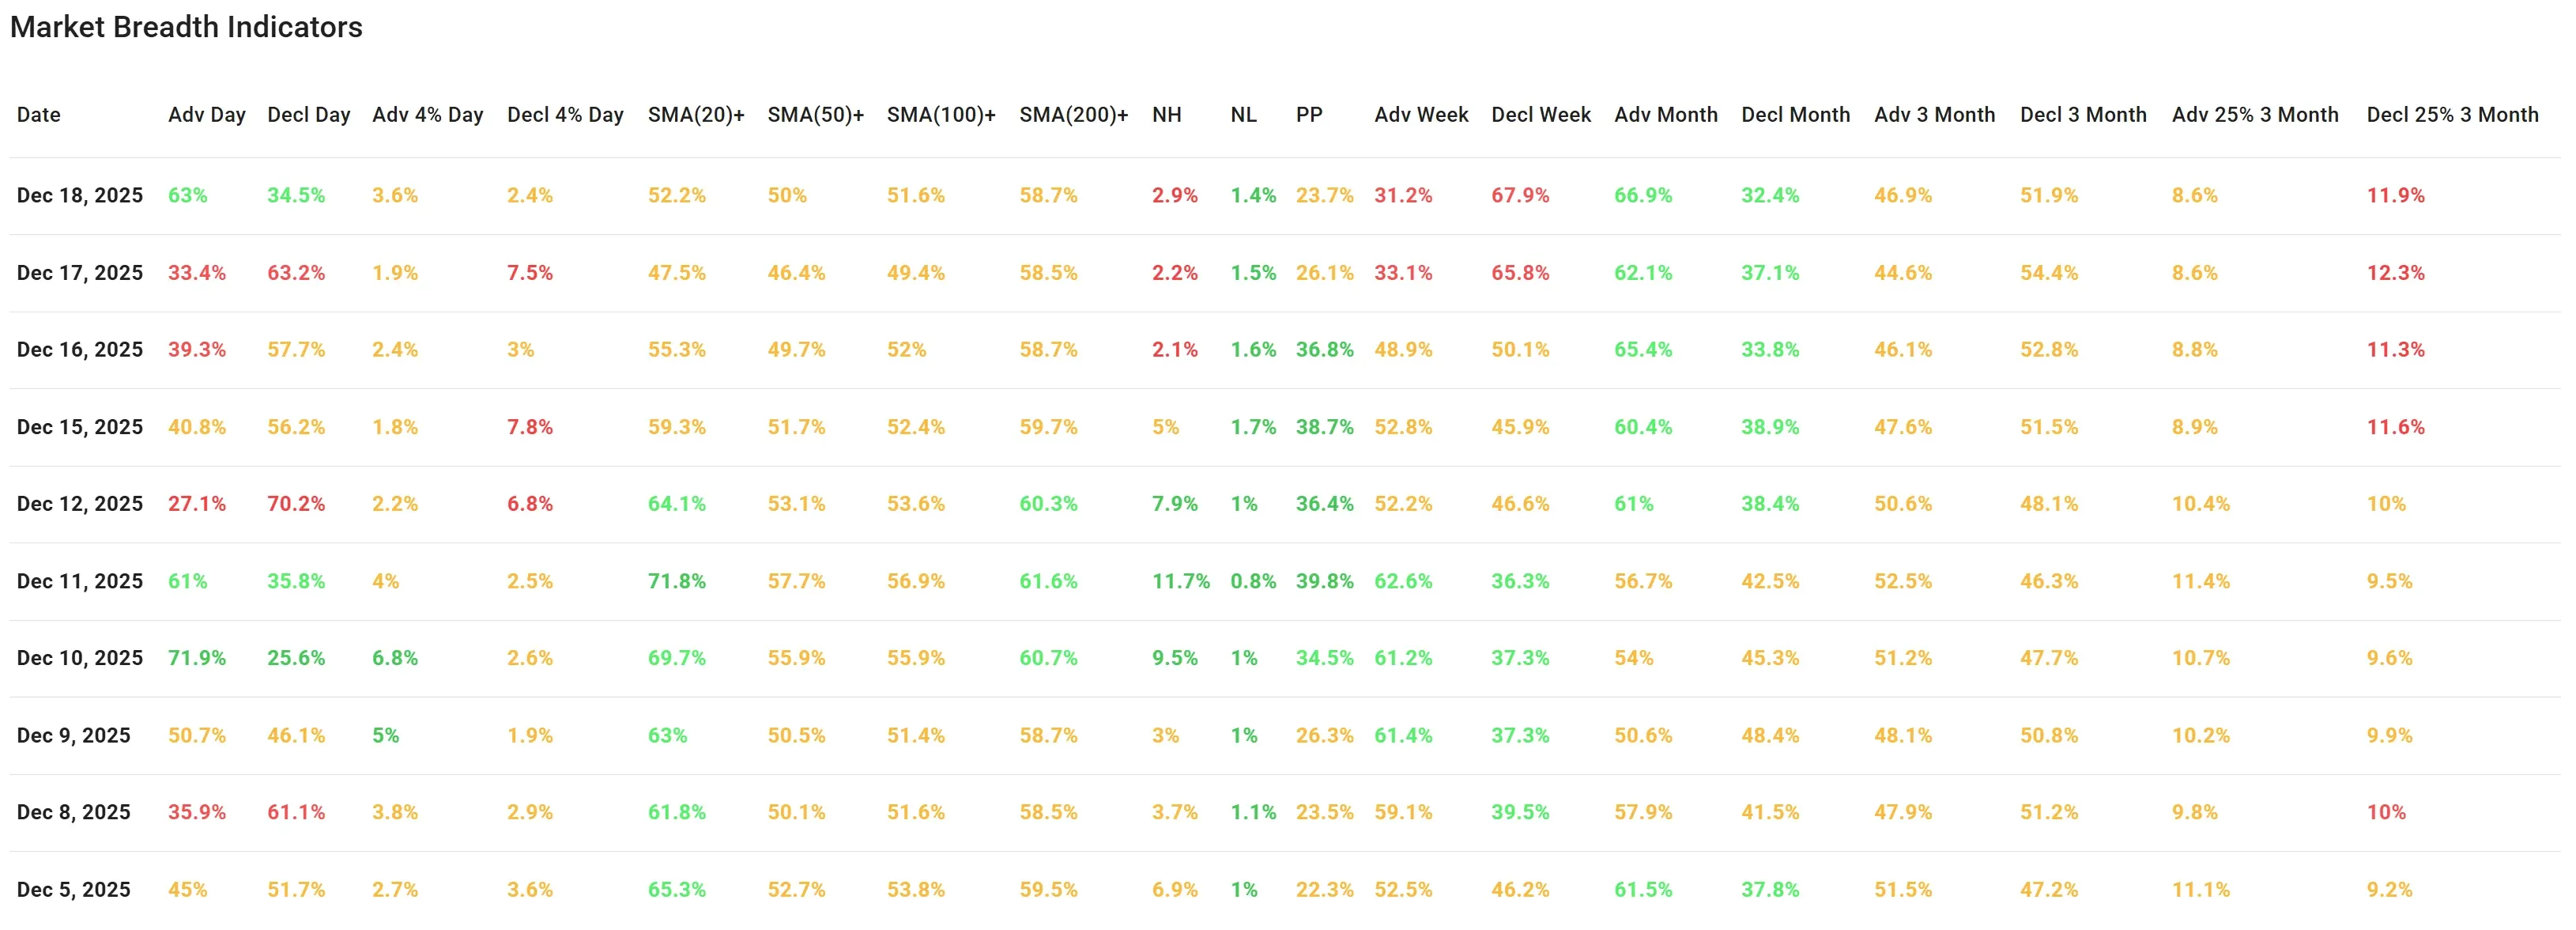
Thursday’s internals flipped decisively:
- Advancers: 63% vs Decliners: 34.5% (a major improvement from Wednesday’s 33.4% / 63.2%).
Big movers improved too:
-
Adv +4%: 3.6% (up from 1.9%)
-
Decl -4%: 2.4% (down sharply from 7.5%)
That combination matters: it’s not just “more stocks up,” it’s also less downside violence than the prior session—exactly what you want to see after a risk-off day.
Stocks above key moving averages: short-term stabilizing, long-term still fine
-
Above SMA(20): 52.2% (up from 47.5%)
-
Above SMA(50): 50.0% (up from 46.4%)
-
Above SMA(100): 51.6% (up from 49.4%)
-
Above SMA(200): 58.7% (basically stable vs 58.5%)
Translation: the long-term foundation remains solid, but the short-term trend is only now clawing back toward “neutral.” This matches what the index charts show: bounce + resistance + overhead averages.
New highs / new lows: still not an expansion phase
-
New Highs: 2.9%
-
New Lows: 1.4%
New lows are contained (good), but new highs are still modest, this is not the signature of a broad-based momentum expansion yet.
Weekly vs monthly vs 3-month: the key tension
This is the most important “zoom out” takeaway:
-
Week: Adv 31.2% vs Decl 67.9% → still clearly negative
-
Month: Adv 66.9% vs Decl 32.4% → still positive
-
3-Month: Adv 46.9% vs Decl 51.9% → still slightly negative
Larger magnitude moves over 3 months remain skewed:
-
Adv +25% (3M): 8.6%
-
Decl -25% (3M): 11.9%
So Thursday improved the day, but the weekly and 3-month “balance of power” hasn’t flipped. That’s why this bounce still feels like a recovery attempt inside a short-term corrective phase, rather than a clean “risk-on restart.”
What changed vs. Wednesday (Dec 17)
Yesterday’s story was breadth breakdown (decliners dominant + a spike in large down days). Today’s story is breadth recoil: the downside pressure eased, advancers returned, and the “tail risk” count (Decl -4%) normalized.
However, what didn’t change meaningfully:
-
Weekly breadth remains heavily negative, so the tape still carries short-term fragility.
-
QQQ’s bearish EMA configuration (noted yesterday) still shows up in price behavior: rallies are meeting supply quickly.
Breadth trend rating
Rating: Neutral, negative bias.

The one-day breadth snapback is constructive and long-term participation (SMA200+) remains supportive, but the market still needs follow-through to repair weekly/3-month breadth and to reclaim key moving averages across SPY/QQQ/IWM.
Kristoff
Next to read: Micron’s HBM Wake-Up Call Reboots the AI Trade (and Tariffs Keep Eating Margins)