
(All data & visualisations by ChartMill.com)
Daily Market Trend Analysis – September 10, 2025 (After Market Close)
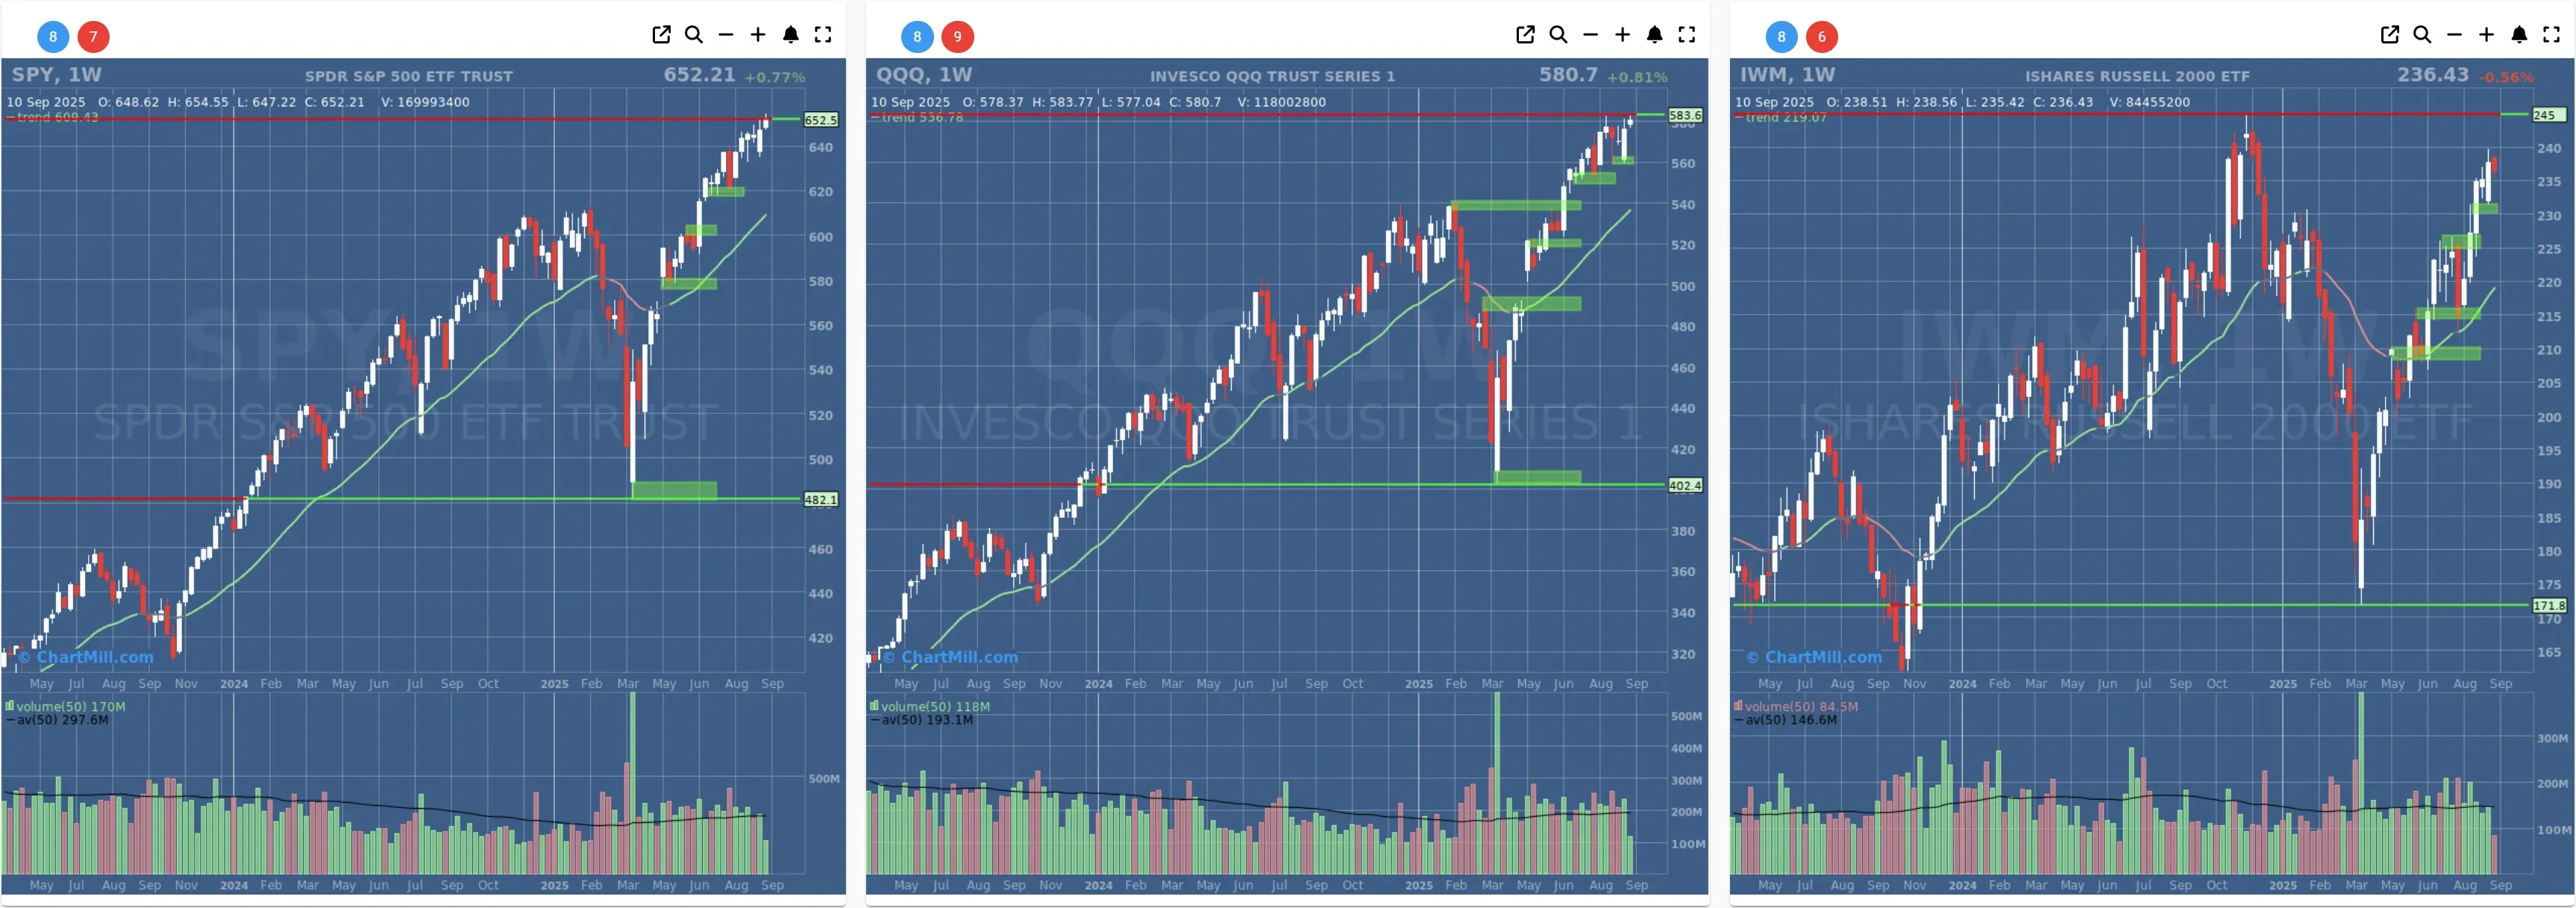
Confirmed new highs for SPY and QQQ, IWM still showing a mini bull flag pattern
Short Term Trend

- Short-Term Trend: Positive (no change)
- Next Support at $640 - $630
- Next Resistance at $652
- Volume: Slightly Above Average (50)
- Pattern: Up Day - New Intraday High
- Short-Term Trend: Positive (no change)
- Next Support at $560
- Next Resistance at $583
- Volume: Slightly Above Average (50)
- Pattern: Up Day - New Intraday High
- Short-Term Trend: Positive (no change)
- Next Support at $225 - $230
- Next Resistance at $237
- Volume: At Average (50)
- Pattern: Down Day
Long Term Trend
- Long-Term Trend: Positive (no change)
- Long-Term Trend: Positive (no change)
- Long-Term Trend: Positive (from neutral)
Daily Market Breadth Analysis – September 10, 2025 (After Market Close)
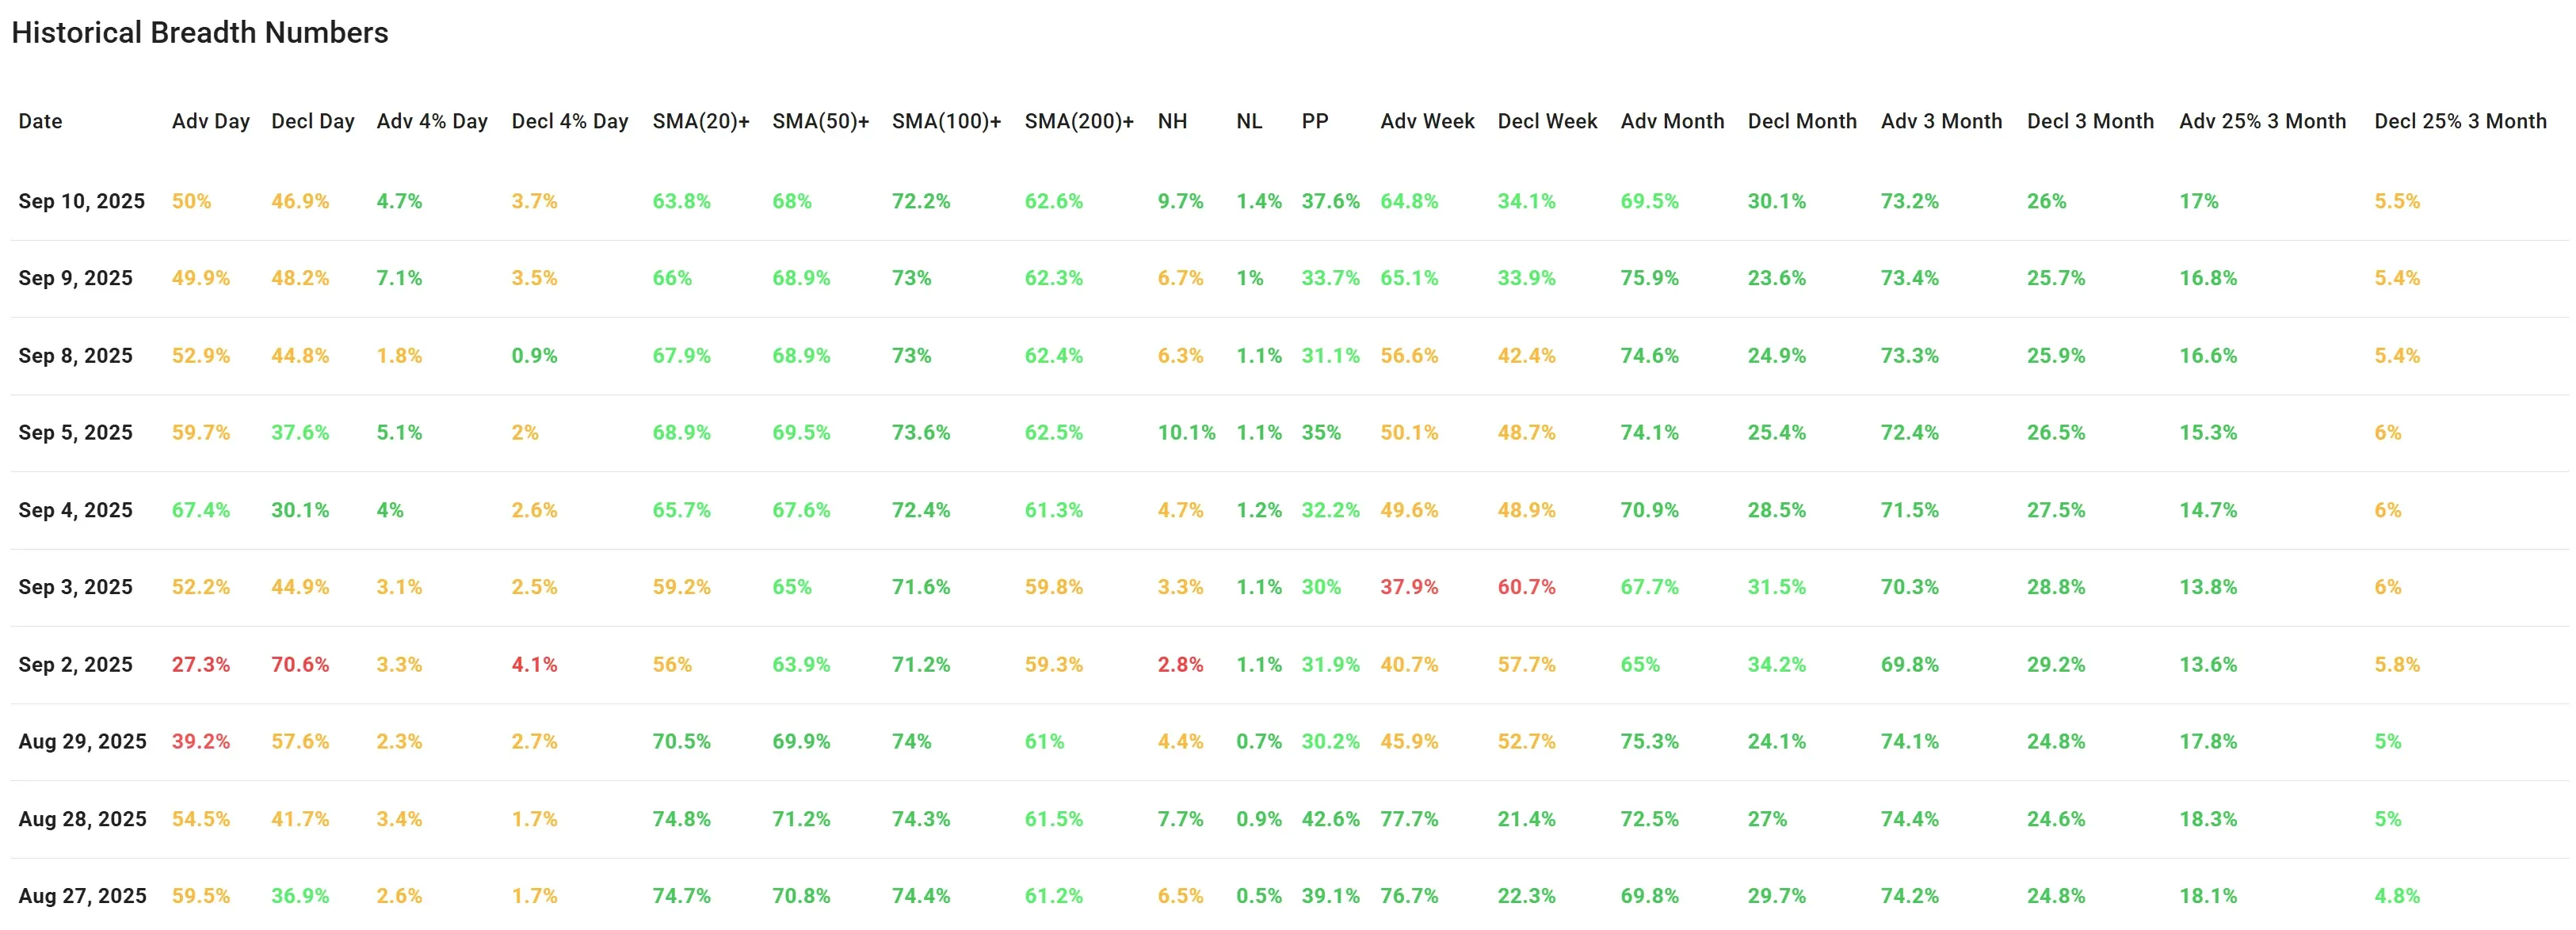
Market breadth metrics on Wednesday, September 10, showed only minor shifts. Gains in short-term strength were offset by slight declines in broader participation. The overall picture remains one of hesitation, with the bullish momentum from early September now showing signs of stalling.
Midweek trading brought little net progress in market breadth
While advancing stocks held a slight edge at 50% versus 46.9% decliners, the margin was razor-thin and less convincing than earlier in the week.
The percentage of stocks rising more than 4% dropped to 4.7%, a decline from 7.1% on Tuesday — indicating a reduction in strong upside momentum.
Short-term metrics, such as the number of stocks above their 20-day SMA, declined to 63.8%, down from 66% the day before. The 50-day SMA breadth fell to 68%, and though these numbers remain healthy, they confirm that fewer stocks are keeping up their recent bullish pace.
On the intermediate trend side, things remain steady:
-
SMA(100)+: 72.2%
-
SMA(200)+: 62.6%
New Highs (NH) rose modestly to 9.7%, the strongest showing in the past seven sessions, suggesting some individual names are still pushing higher. New Lows (NL) remained low at 1.4%, a supportive factor for the overall structure.
The Pocket Pivots (PP) metric climbed to 37.6%, its best level since late August, indicating some improving strength among leading stocks.
Breadth over broader timeframes showed some softening:
-
Advancers over the past month fell to 69.5% (from 75.9% the day before).
-
Advancers over the past 3 months held at 73.2%, a slight dip.
-
Decliners over 3 months remained contained at 26%.
A Pause in Momentum
Wednesday’s numbers suggest a stall in the recent breadth recovery that began after the September 2 lows. Short-term enthusiasm is cooling, and while there’s no immediate sign of deterioration, the momentum appears to be slowing.
Markets often hesitate midweek, particularly when there's a lack of strong catalysts. So far, no new negative developments have disrupted the longer-term structure, but the lack of follow-through from early September’s strength is something to watch.
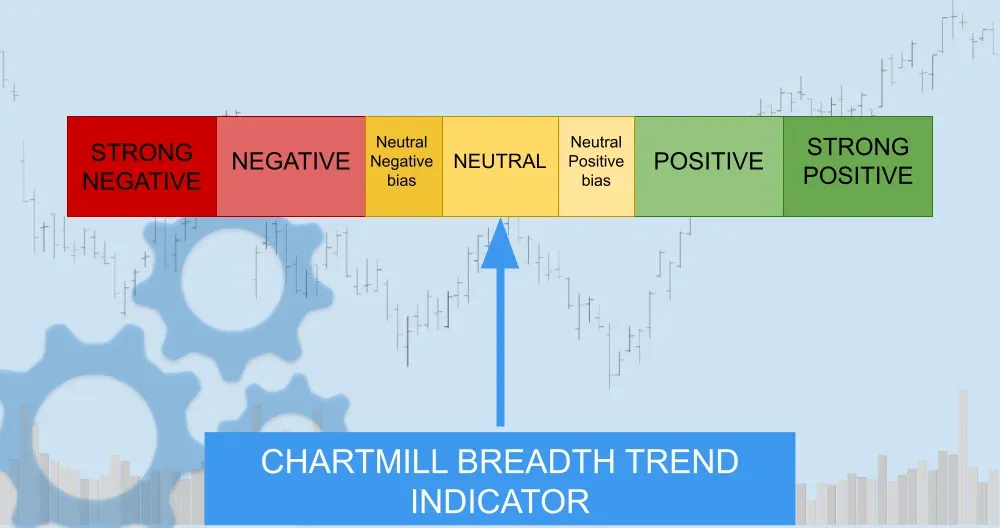
Breadth Trend Rating: 3 – Neutral
The trend remains in a neutral zone. There’s no confirmation of renewed weakness, but the fading of short-term strength and lack of broad participation keeps breadth from turning decisively positive.
Kristoff - ChartMill
Next to read: Oracle Rockets to Record High on AI Frenzy, Lifts S&P 500 to New Heights