(All data & visualisations by ChartMill.com)
Daily Market Trend Analysis – August 21, 2025 (After Market Close)
US index ETFs had a quiet day ahead of Powell's speech in Jackson Hole today.
Short Term Trend
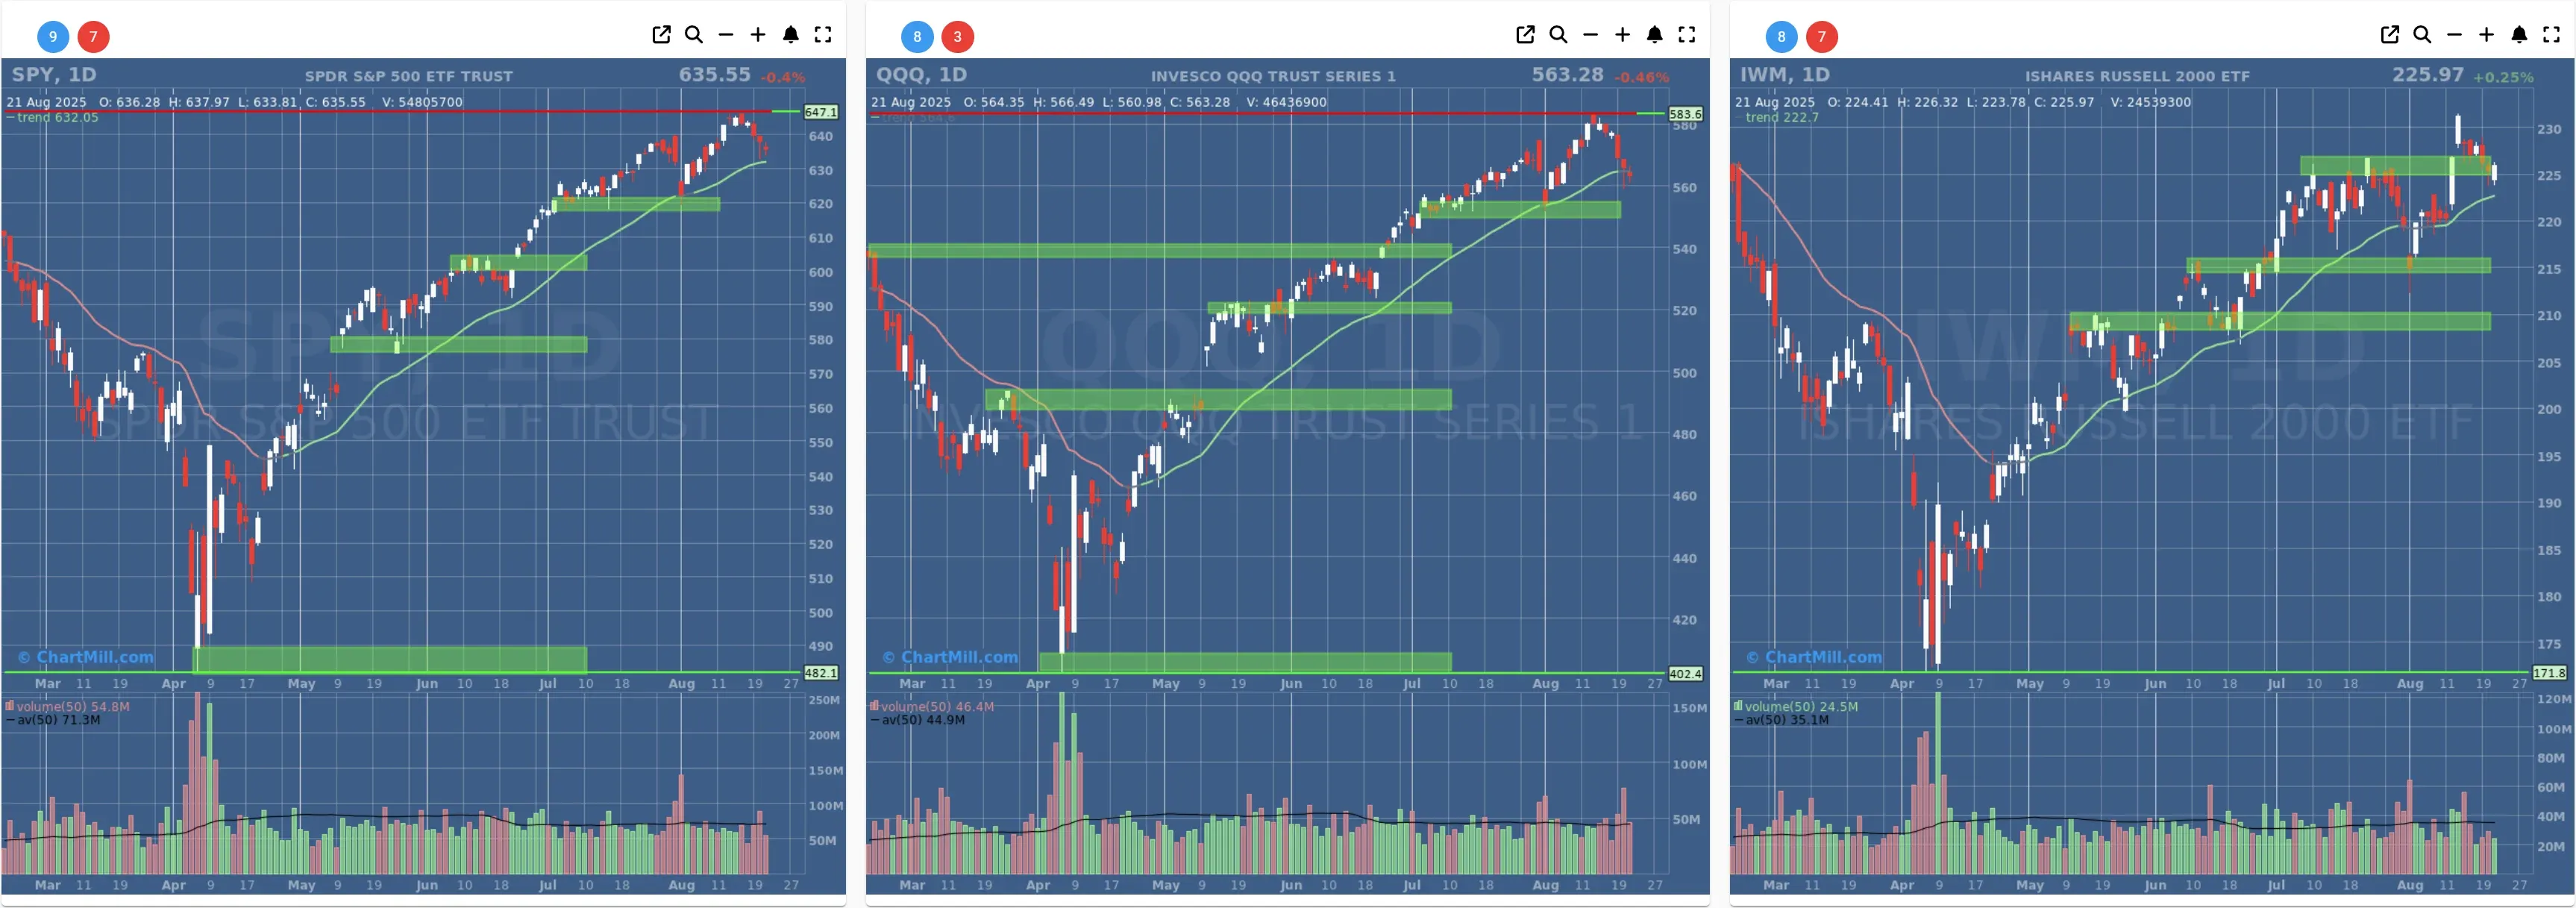
- Short-Term Trend: Bullish (no change)
- Next Support at $640 - $620
- Next Resistance at $647
- Volume: Below Average (50)
- Pattern: Down Day - Inside Day Candle
- Short-Term Trend: Neutral (no change)
- Next Support at $550 - $540
- Next Resistance at $580
- Volume: At Average (50)
- Pattern: Down Day - Inside Day Candle
- Short-Term Trend: Positive (no change)
- Next Support at $225
- Next Resistance at $230 - $245
- Volume: Well Below Average (50)
- Pattern: Up Day
Long Term Trend
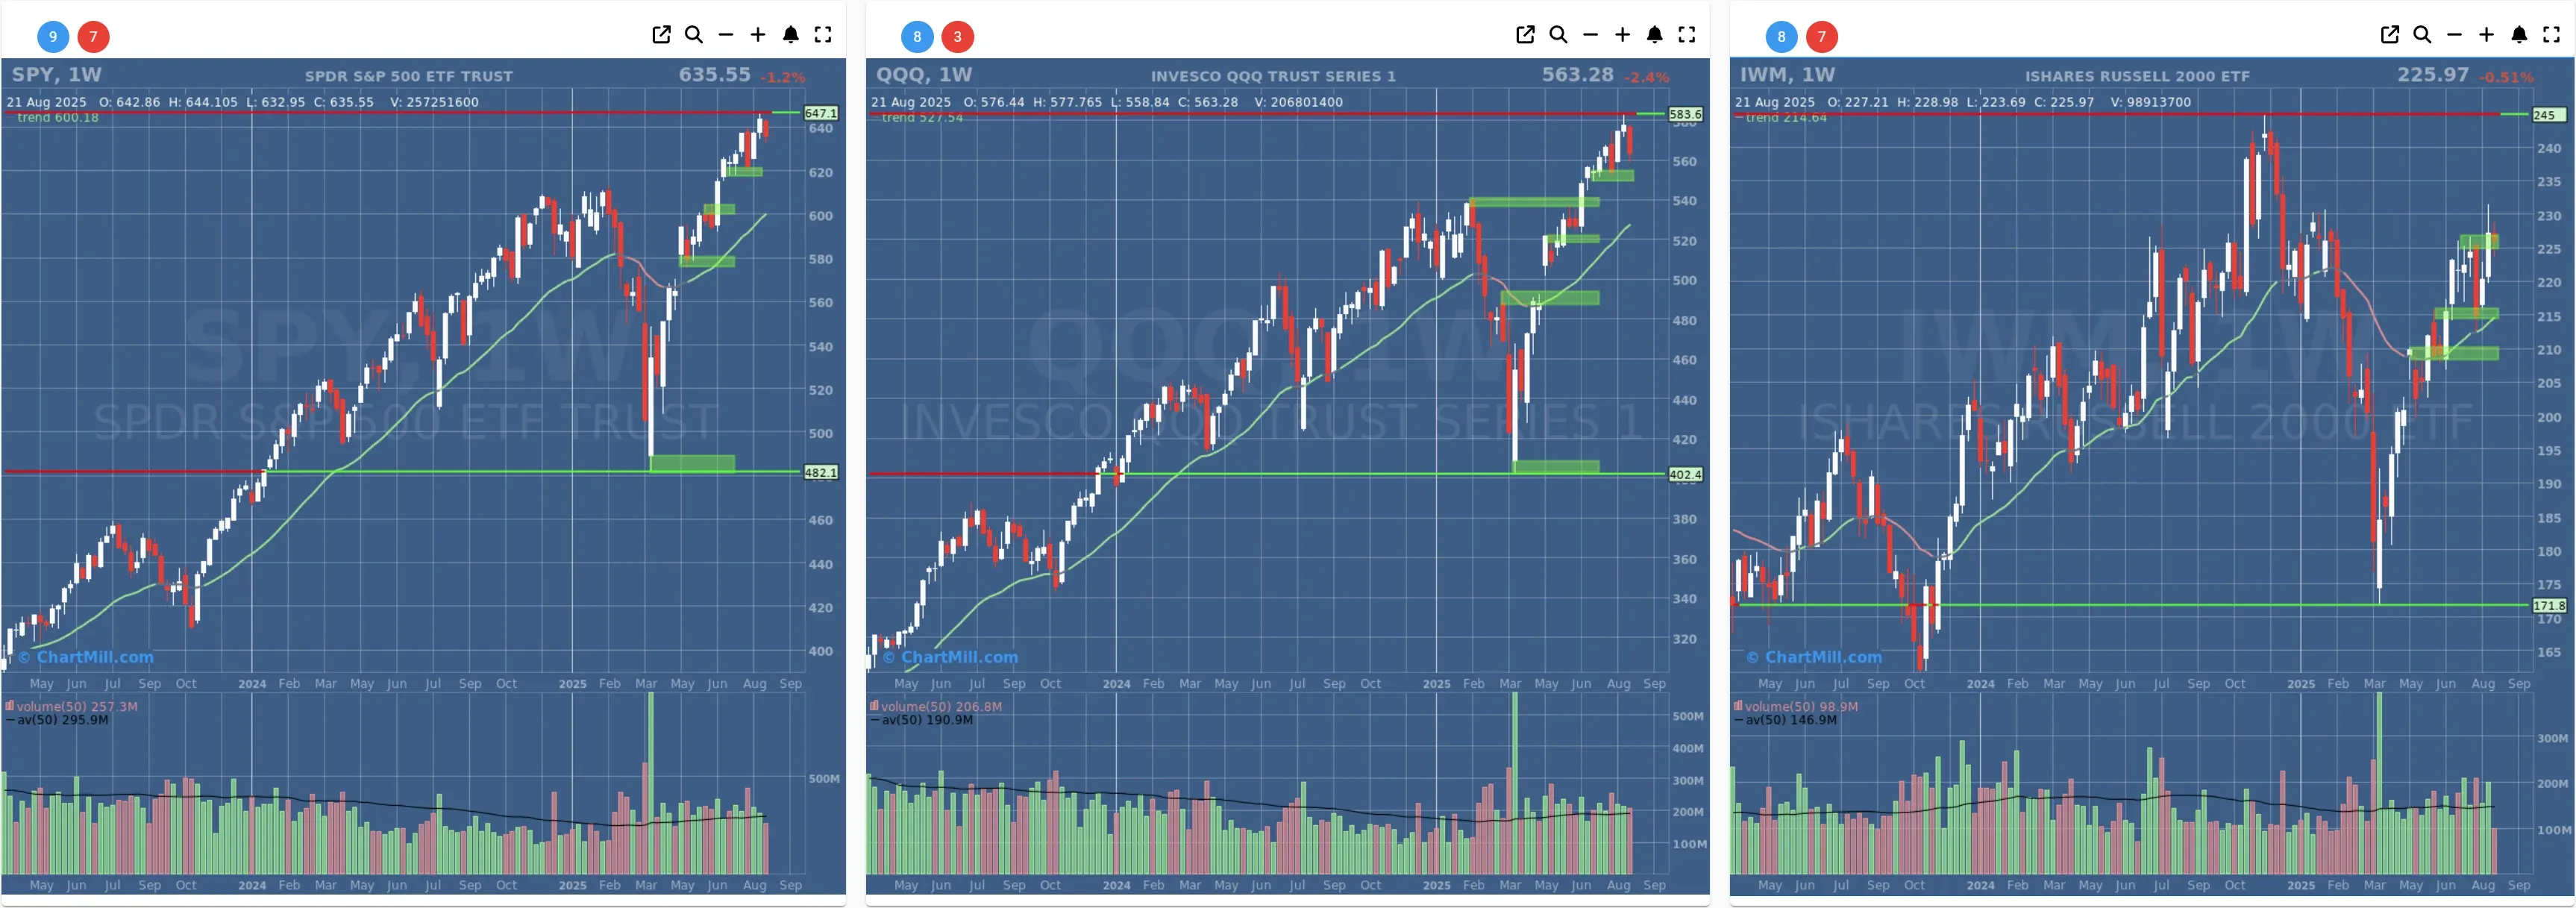
- Long-Term Trend: Positive (no change)
- Long-Term Trend: Positive (no change)
- Long-Term Trend: Positive (from neutral)
Daily Market Breadth Analysis – August 21, 2025 (After Market Close)
Market breadth continues to erode as short-term participation metrics decline for the third day in a row. While long-term structural indicators remain stable, short-term deterioration suggests caution heading into the final sessions of the week.
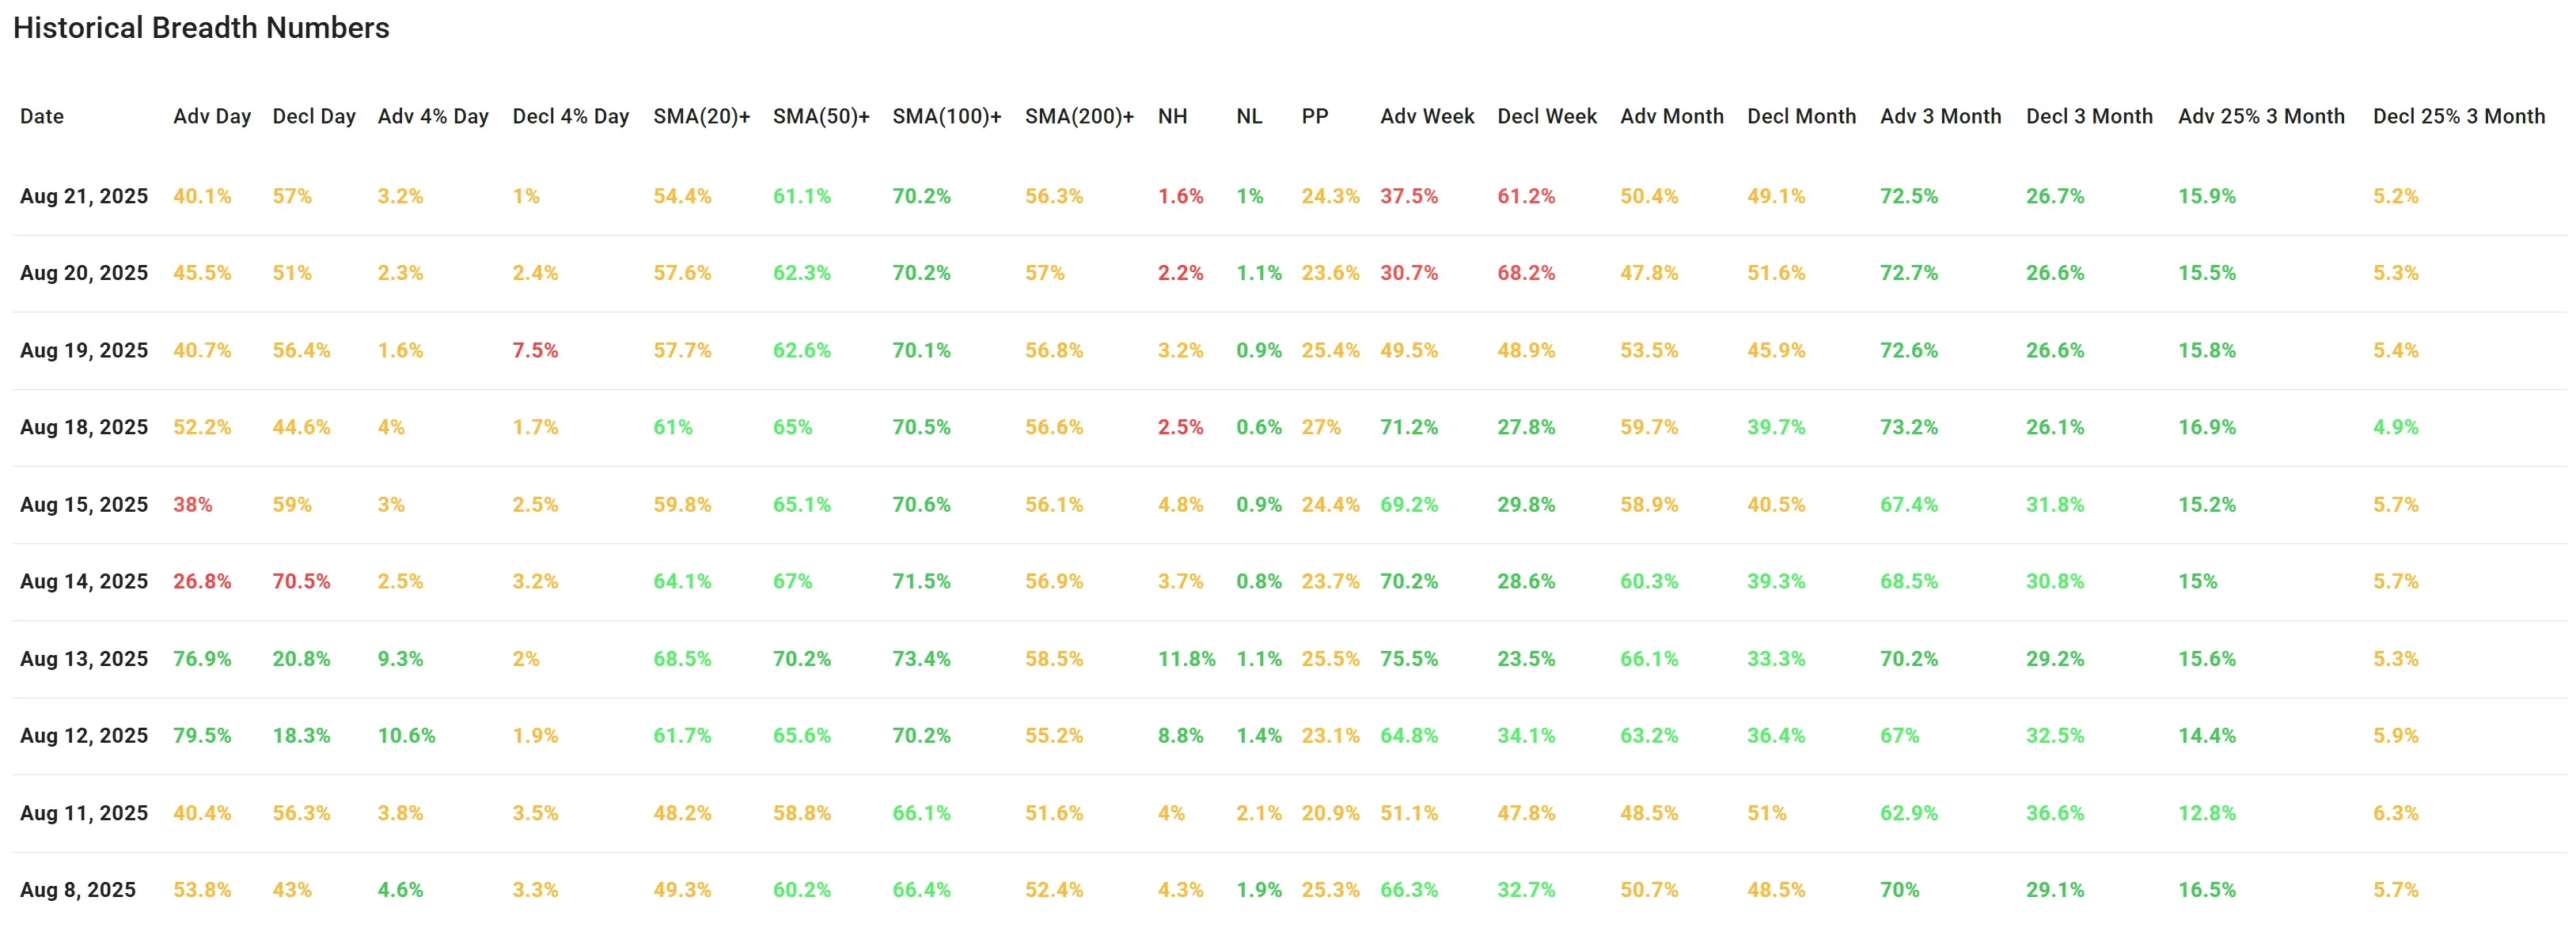
Market breadth metrics weakened again on Thursday, marking the third consecutive session of soft participation.
While the damage remains moderate under the surface, the short-term trend has clearly rolled over after the 8/18 bounce. Notably, the percentage of stocks above key short-term moving averages (20 and 50-day) continues to decline, and weekly breadth is firmly negative.
Daily Participation:
Advancers slipped again to 40.1%, versus 57.0% decliners.
Strong gainers (≥4%) increased slightly to 3.2%, but remain modest overall.
On the downside, only 1.0% of stocks dropped ≥4%, easing from 2.4% on Wednesday and 7.5% Tuesday, so while the red breadth dominates, intensity has subsided.
Short-Term Trend Measures:
-
% above 20-DMA fell again to 54.4%, down from 57.6%, and well below 61% from earlier in the week.
-
% above 50-DMA declined to 61.1% from 62.3% and 65% on Monday.
Conclusion: Participation above short-term trend lines is clearly trending down.
Intermediate/Long-Term Measures:
-
% above 100-DMA (70.2%) and 200-DMA (56.3%) are unchanged.
-
New Highs (1.6%) and New Lows (1.0%) remain low and stable.
These suggest the longer-term trend remains structurally intact, with no signs of panic.
Breadth Across Time Frames:
-
Weekly breadth continues to deteriorate: 37.5% of stocks are up on the week, 61.2% are down, confirming weakness.
-
Monthly breadth is now almost flat: 50.4% up vs 49.1% down.
-
3-month picture remains positive: 72.5% of stocks are up over the past 3 months, with 15.9% up ≥25% (vs 5.2% down ≥25%)—leadership intact.
Context and Trend Continuation
Thursday’s data confirmed the continued weakening of short-term breadth flagged earlier this week. The bounce on 8/18 (advancers 52.2%, strong weekly/monthly participation) is now clearly in the rearview mirror, as participation fades again.
However, the absence of any spike in severe decliners or new lows suggests this is a soft fade, not a hard selloff.
While short-term traders should take note of the weakening participation and limited breakouts, medium- and long-term investors can take some comfort in the stability of the 100- and 200-day trends and healthy 3-month momentum.
Conclusion
The market is in a shallow correction or consolidation phase. If short-term metrics (20/50-DMA and weekly advance/decline) continue to weaken into next week, the intermediate trend may begin to deteriorate as well.
For now, the breadth trend rating is: 3 — Neutral (with a clear short-term negative bias).

Kristoff - ChartMill
Next to read: Market Monitor News, August 22 BMO