

(All data & visualisations by ChartMill.com)
Daily Market Trend Analysis – August 20, 2025 (After Market Close)
Short Term Trend Change for $QQQ!
Short Term Trend
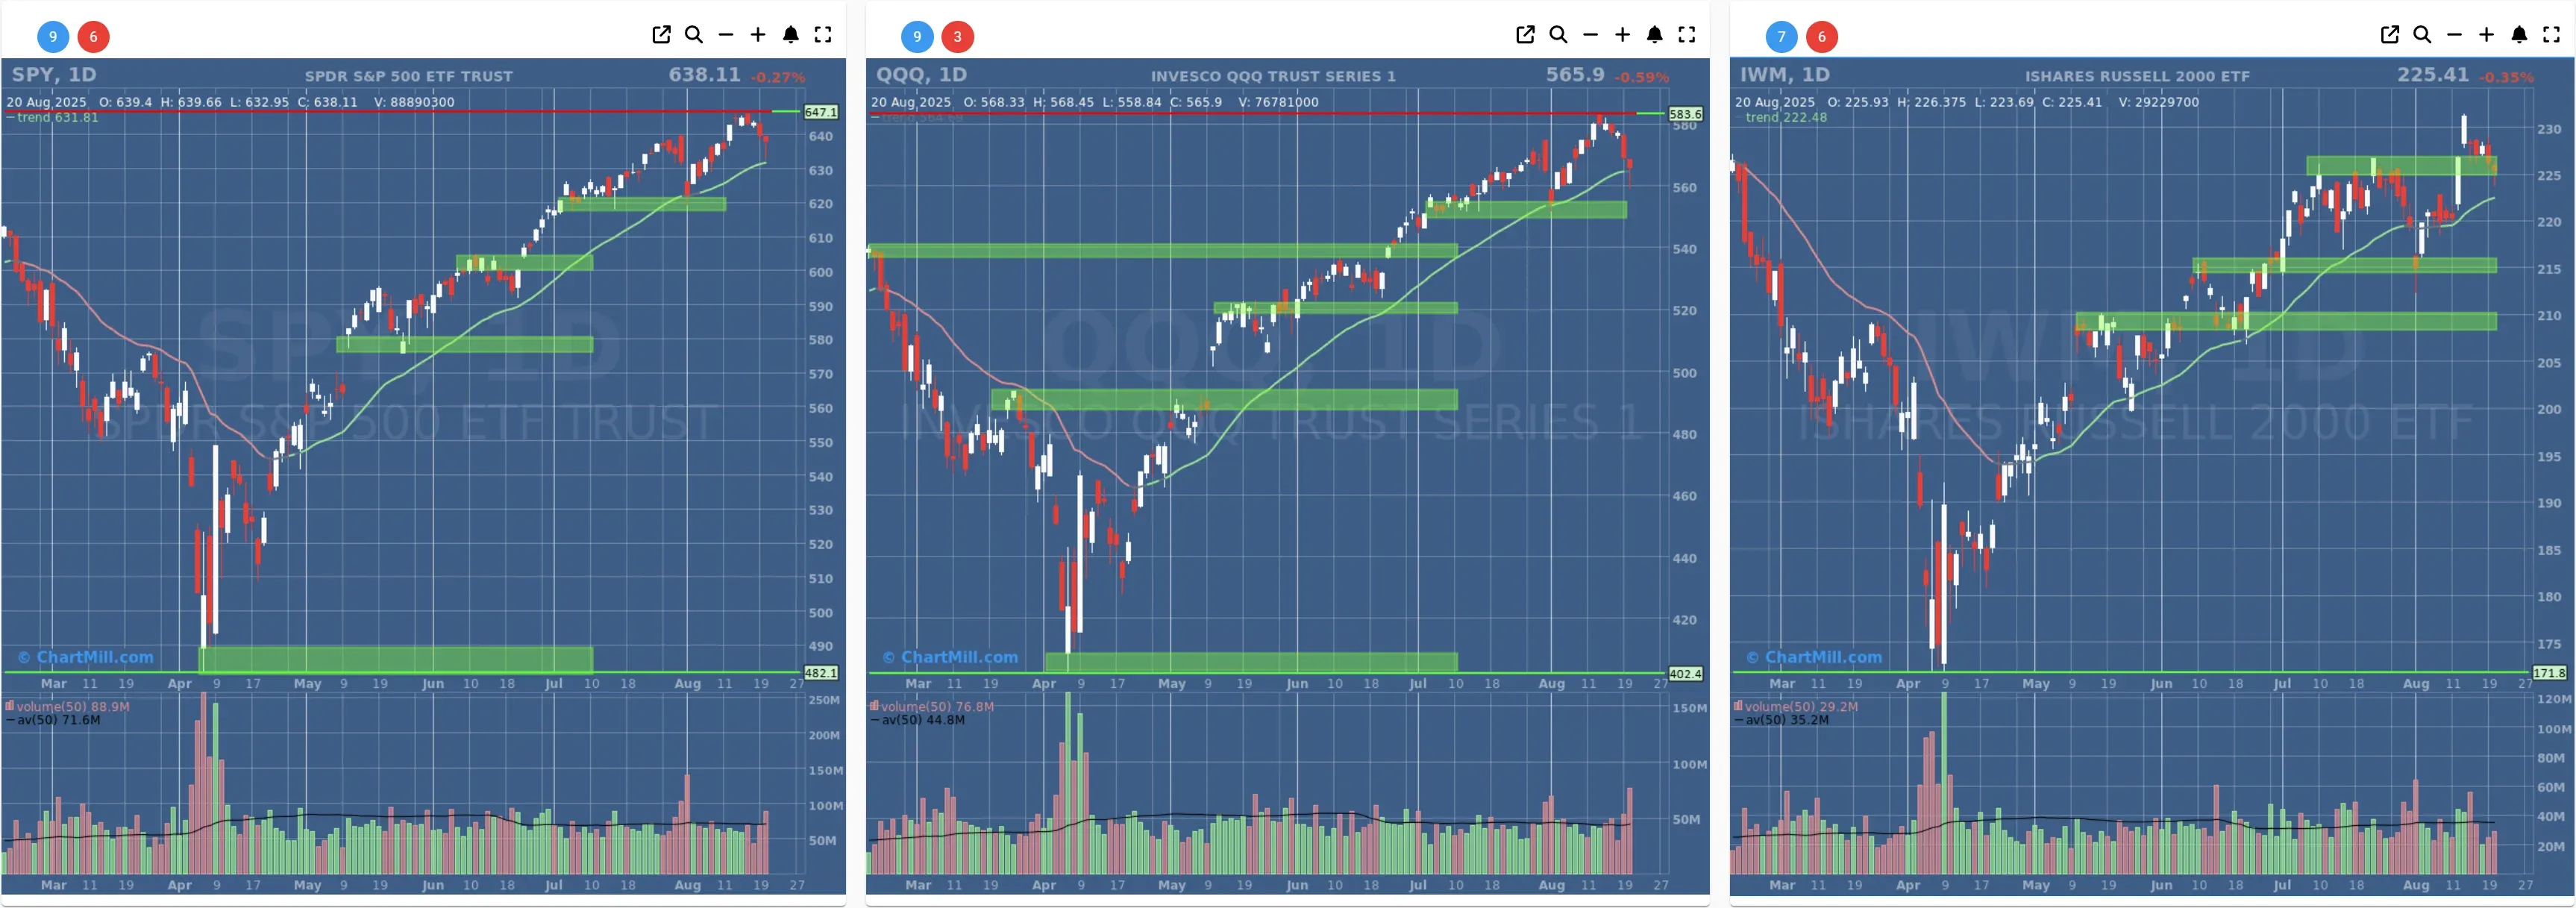
- Short-Term Trend: Bullish (no change)
- Next Support at $640 - $620
- Next Resistance at $647
- Volume: Above Average (50)
- Pattern: Down Day - Doji Candle
- Short-Term Trend: Neutral (from Bullish)
- Next Support at $550 - $540
- Next Resistance at $580
- Volume: Far Above Average (50)
- Pattern: Firm Down Day - Doji Candle
- Short-Term Trend: Positive (no change)
- Next Support at $225
- Next Resistance at $230 - $245
- Volume: Far Below Average (50)
- Pattern: Down Day - Testing Support
Long Term Trend
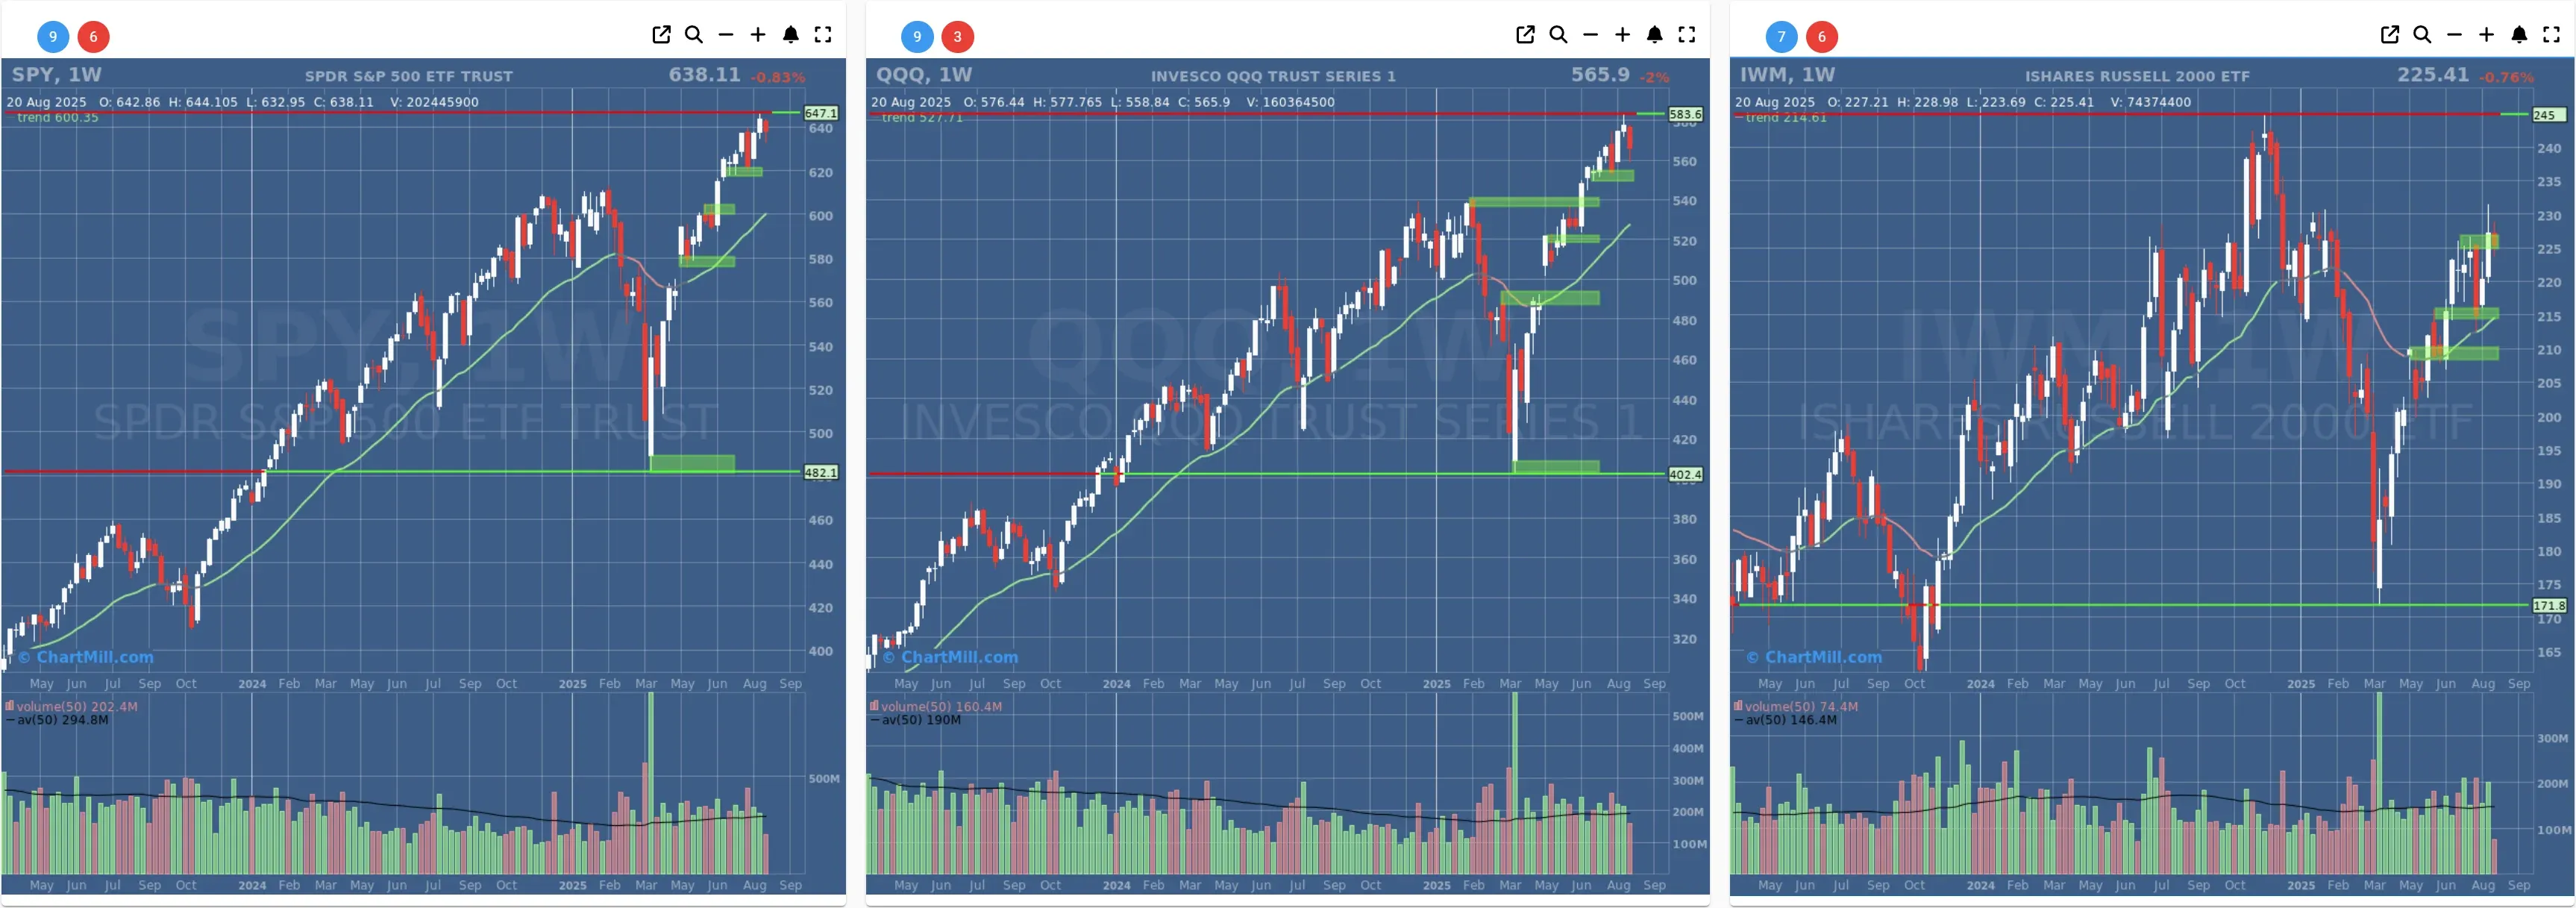
- Long-Term Trend: Positive (no change)
- Long-Term Trend: Positive (no change)
- Long-Term Trend: Positive (from neutral)
Daily Market Breadth Analysis – August 20, 2025 (After Market Close)
After last week’s volatility, the latest breadth data suggests a rebalancing in market participation. The broader trend remains neutral, though a slight tilt toward weakness persists. Fewer new highs, soft advancing metrics, and lukewarm SMA participation continue to limit bullish momentum.
Market breadth remained mixed at the start of the week, reflecting the market's ongoing struggle to regain sustained directional momentum.
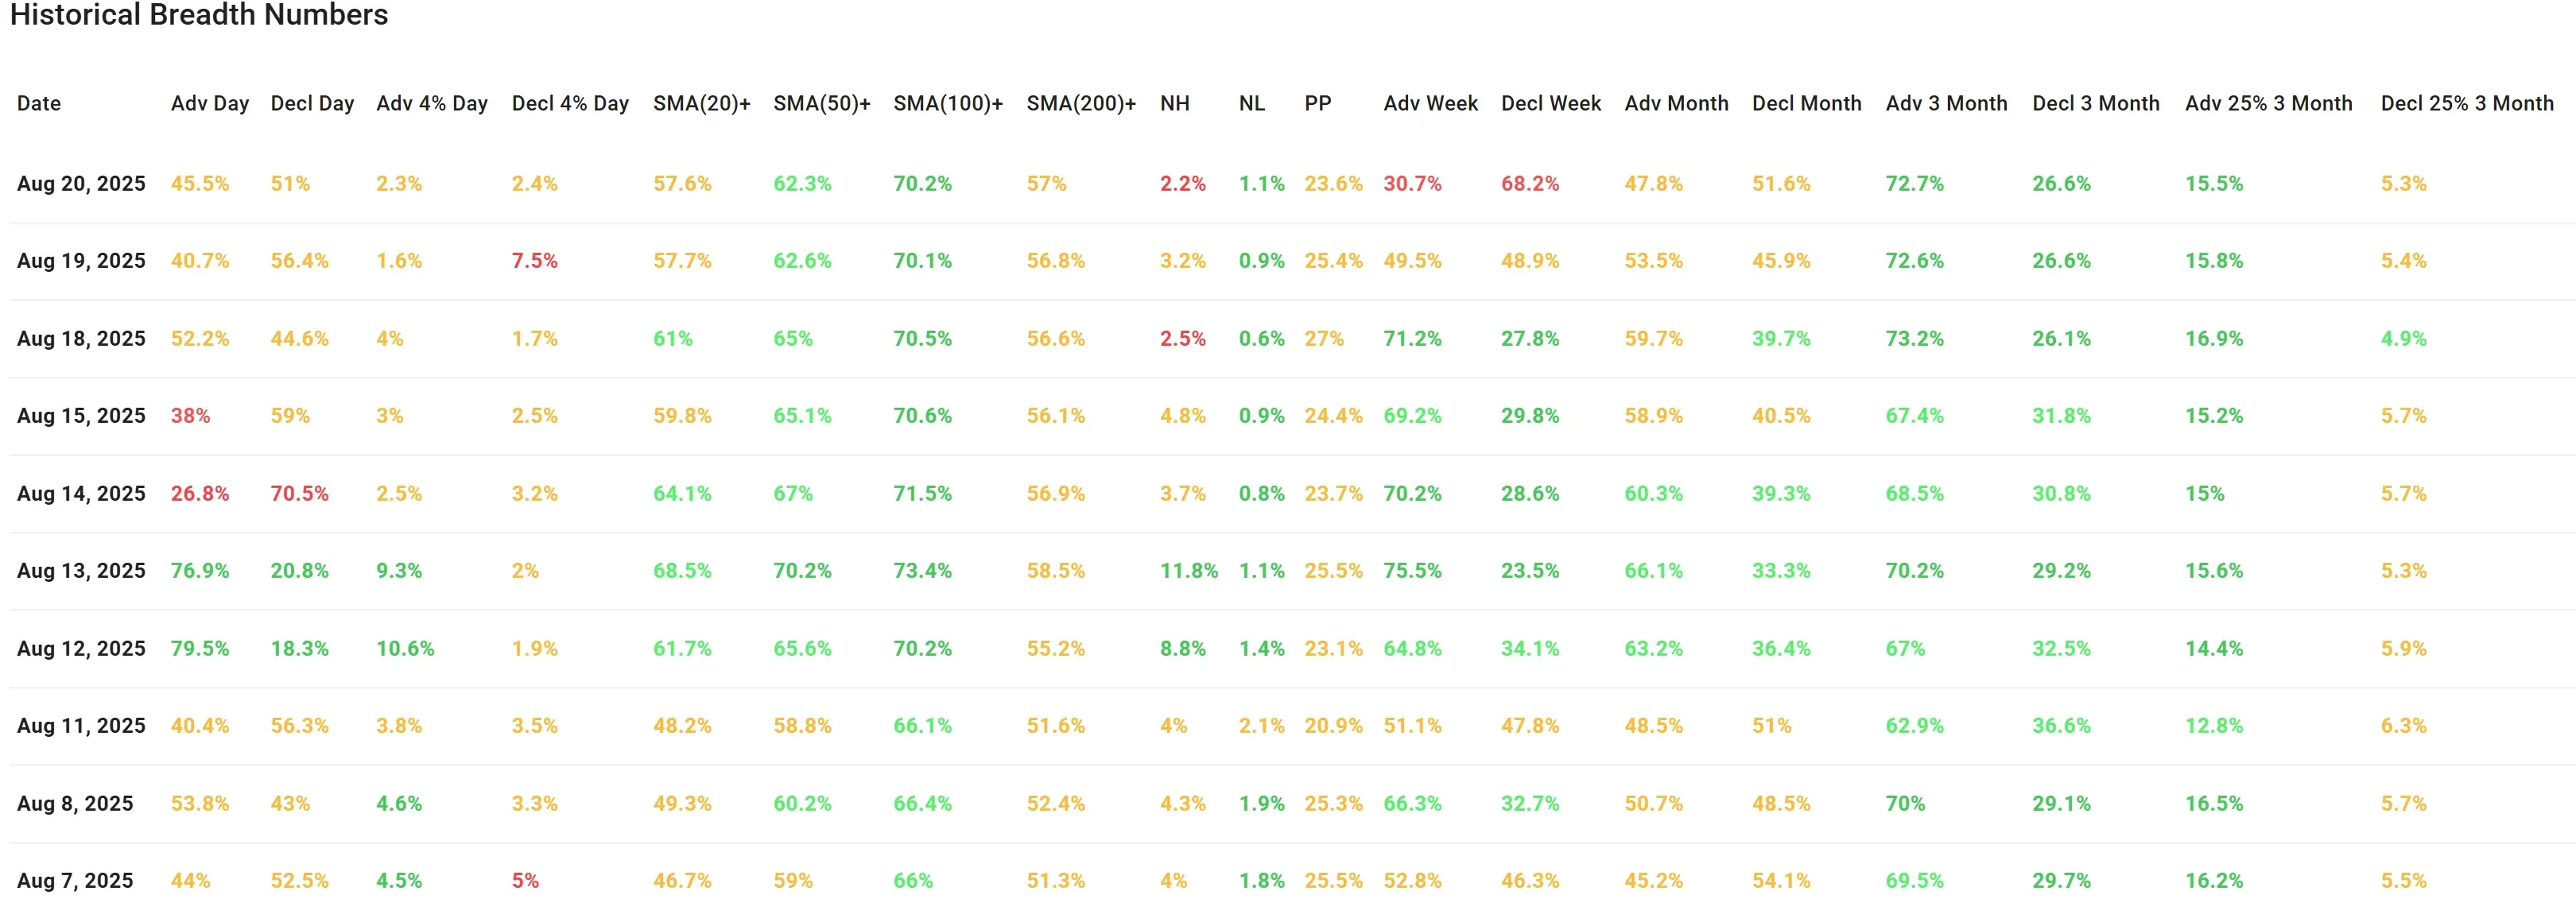
Monday’s session (Aug 20) showed only 45.5% of stocks advancing versus 51% declining. This slight imbalance comes on the heels of Friday’s (Aug 19) more negative session, where decliners held a firmer grip at 56.4%.
What stands out is the low conviction on both the upside and downside: only 2.3% of stocks advanced more than 4%, and 2.4% declined more than 4%. These are low volatility numbers, suggesting indecision rather than a strong directional bias.
Short-term moving average breadth also continues to flatten out:
-
SMA(20)+: 57.6% (down slightly from 57.7%)
-
SMA(50)+: 62.3% (down from 62.6%)
-
SMA(100)+: 70.2%
-
SMA(200)+: 57%
All remain relatively stable and are holding above 50%, but they show no signs of clear acceleration, which is typical in more bullish environments.
New Highs vs. New Lows also show muted bullish participation, with:
-
NH: 2.2%
-
NL: 1.1%
This is a far cry from the stronger readings seen just a week ago (e.g., 11.8% NH on Aug 13), and is an important sign that fewer stocks are leading the market higher.
Weekly and monthly breadth continues to reflect the sideways tone:
-
Adv Week: 30.7% (a sharp drop from 49.5% Friday)
-
Decl Week: 68.2%
-
Adv Month: 47.8%
-
Decl Month: 51.6%
The deterioration in weekly breadth is noteworthy and tilts the near-term trend back toward the negative side, though the monthly trend remains roughly balanced.
The 3-month forward-looking indicators:
-
Adv 3M: 72.7%
-
Decl 3M: 26.6%
-
Adv 25% 3M: 15.5%
-
Decl 25% 3M: 5.3%
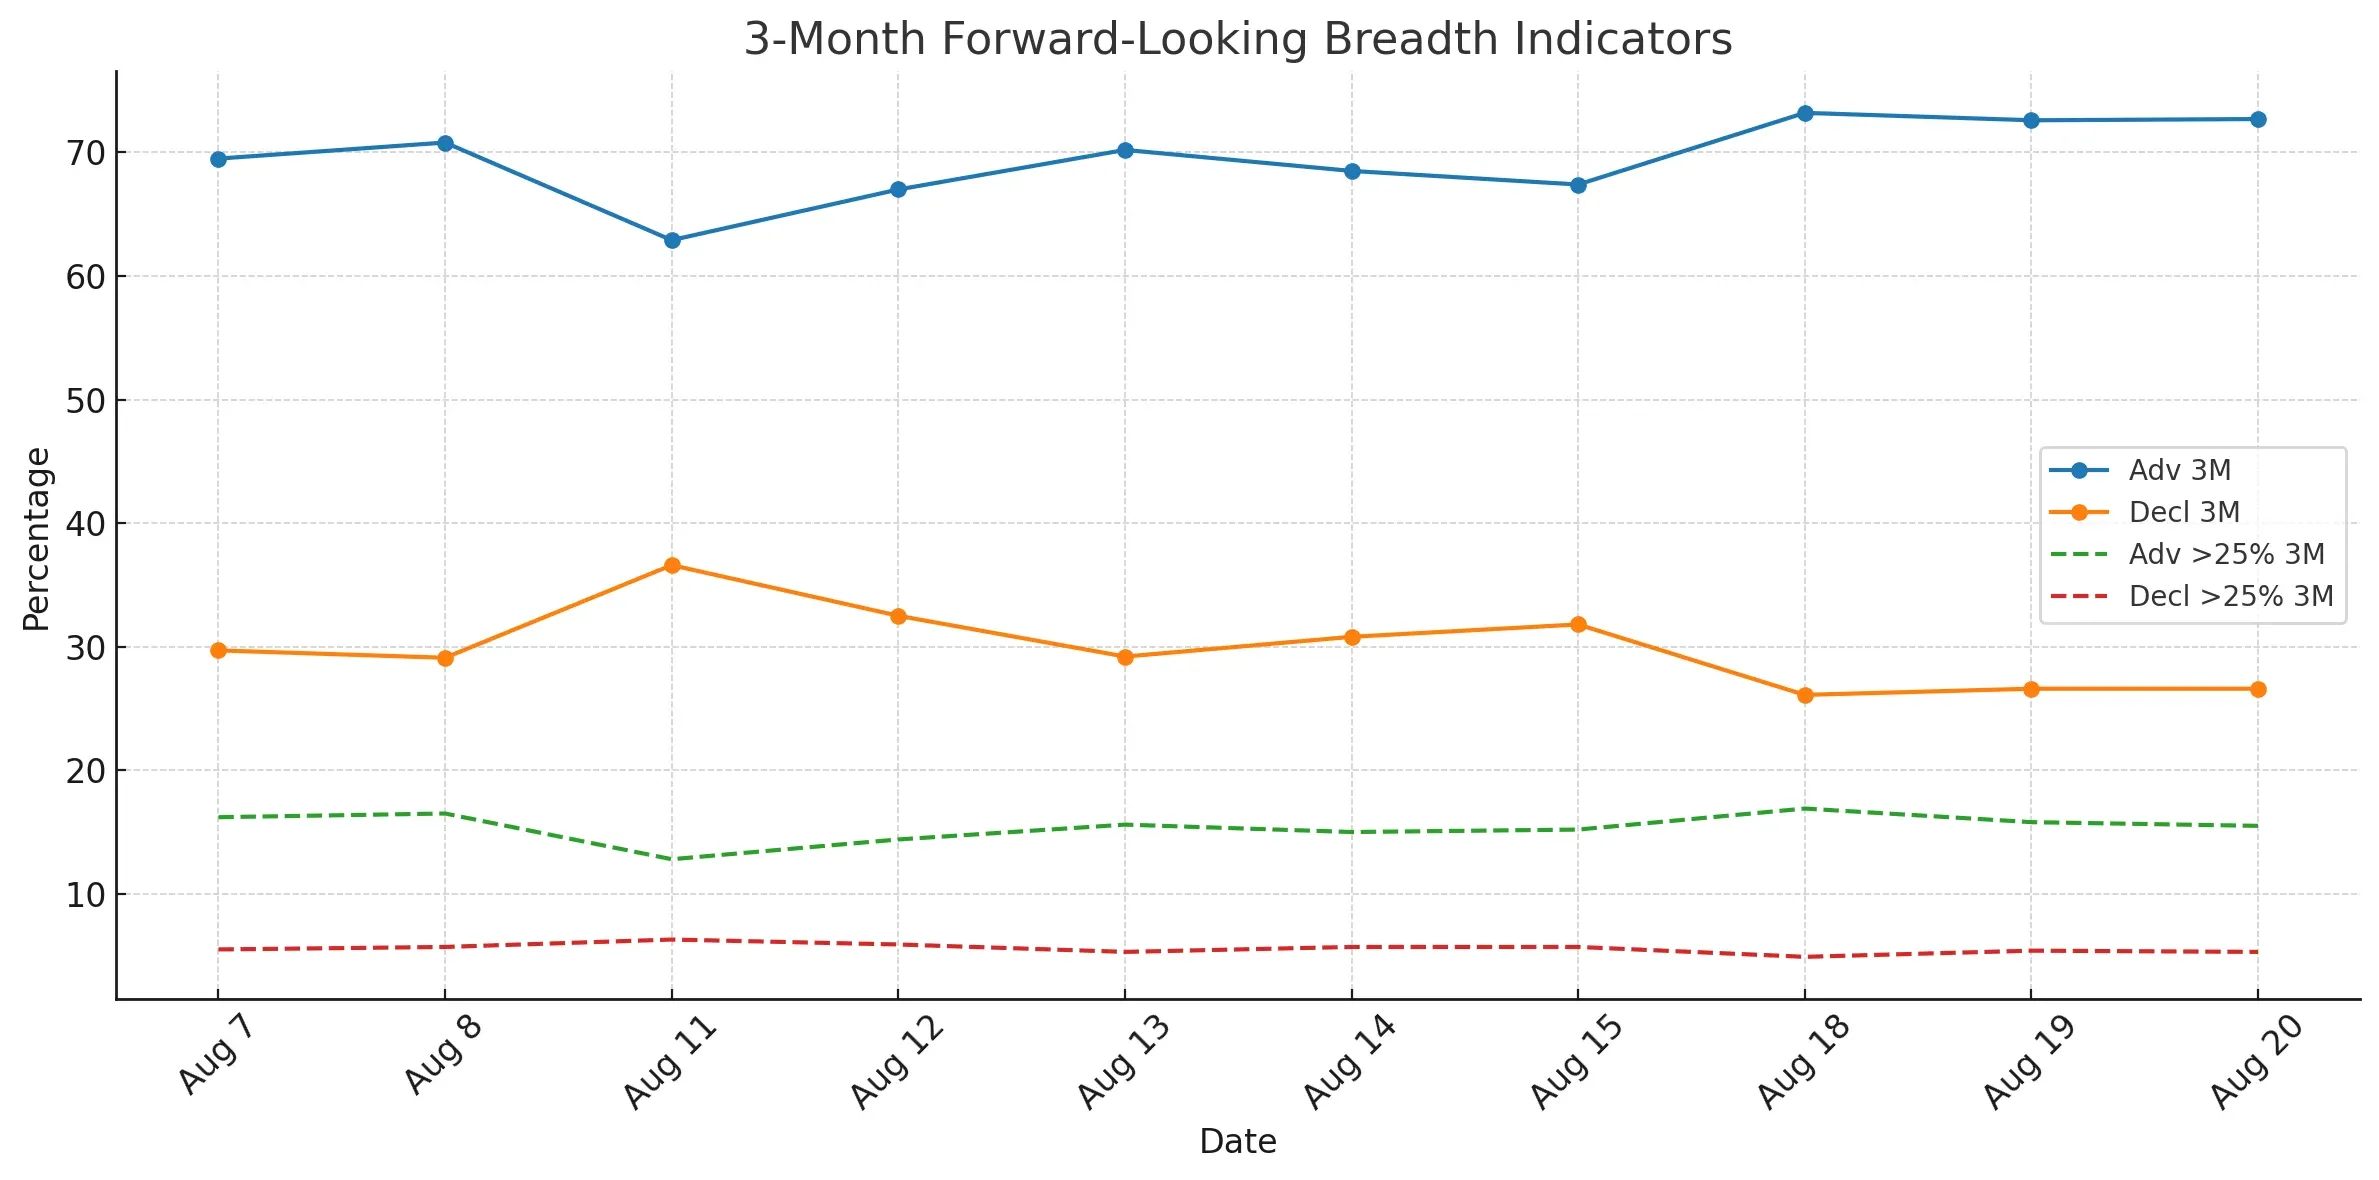
These metrics continue to show resilience, but are also plateauing. Participation in longer-term advances has not yet picked up meaningfully.
Conclusion and Trend Rating
Despite the recent weakness, there is no clear breakdown in the data, but also no signs of a strong bullish resurgence.
Most short- and medium-term indicators are treading water. Compared to the stronger breadth in early August, the market now finds itself in a holding pattern, awaiting clearer leadership.
Breadth Trend Rating: 3 – Neutral
The market remains range-bound with neutral breadth characteristics, leaning slightly bearish in the short term due to a lack of advancing volume and weakening weekly metrics.

Kristoff - ChartMill
Next to read: Market Monitor News, August 21 BMO