

(All data & visualisations by ChartMill.com)
Daily Market Trend Analysis – August 15, 2025 (After Market Close)
US index ETFs are stuck in neutral.
Short Term Trend
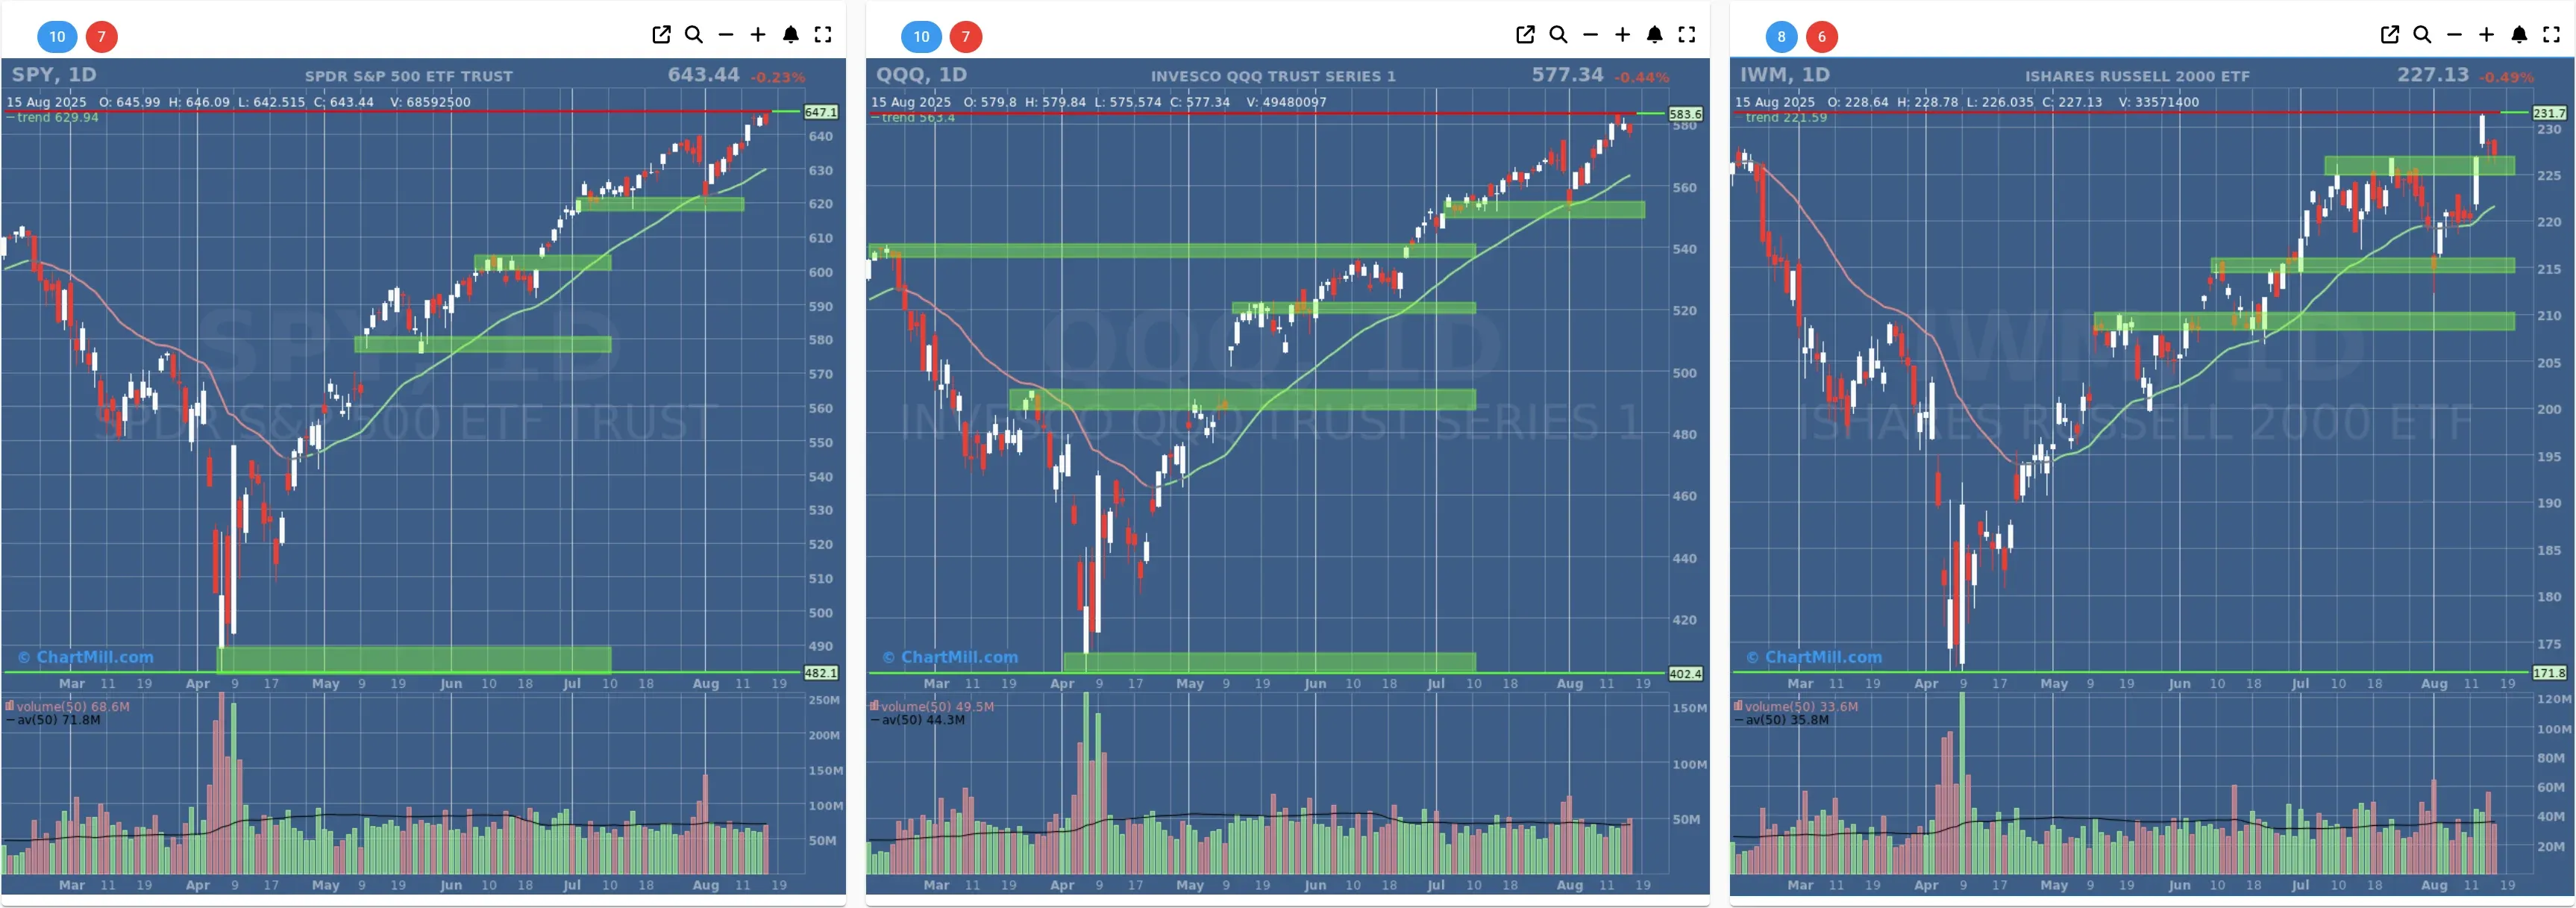
- Short-Term Trend: Bullish (from neutral)
- Next Support at $620 - $600
- Next Resistance at /
- Volume: At Average (50)
- Pattern: Down Day
- Short-Term Trend: Bullish (no change)
- Next Support at $550 - $540
- Next Resistance at /
- Volume: Slightly Above Average (50)
- Pattern: Down Day
- Short-Term Trend: Positive (from neutral)
- Next Support at $225
- Next Resistance at $245
- Volume: At Average (50)
- Pattern: Down Day
Long Term Trend
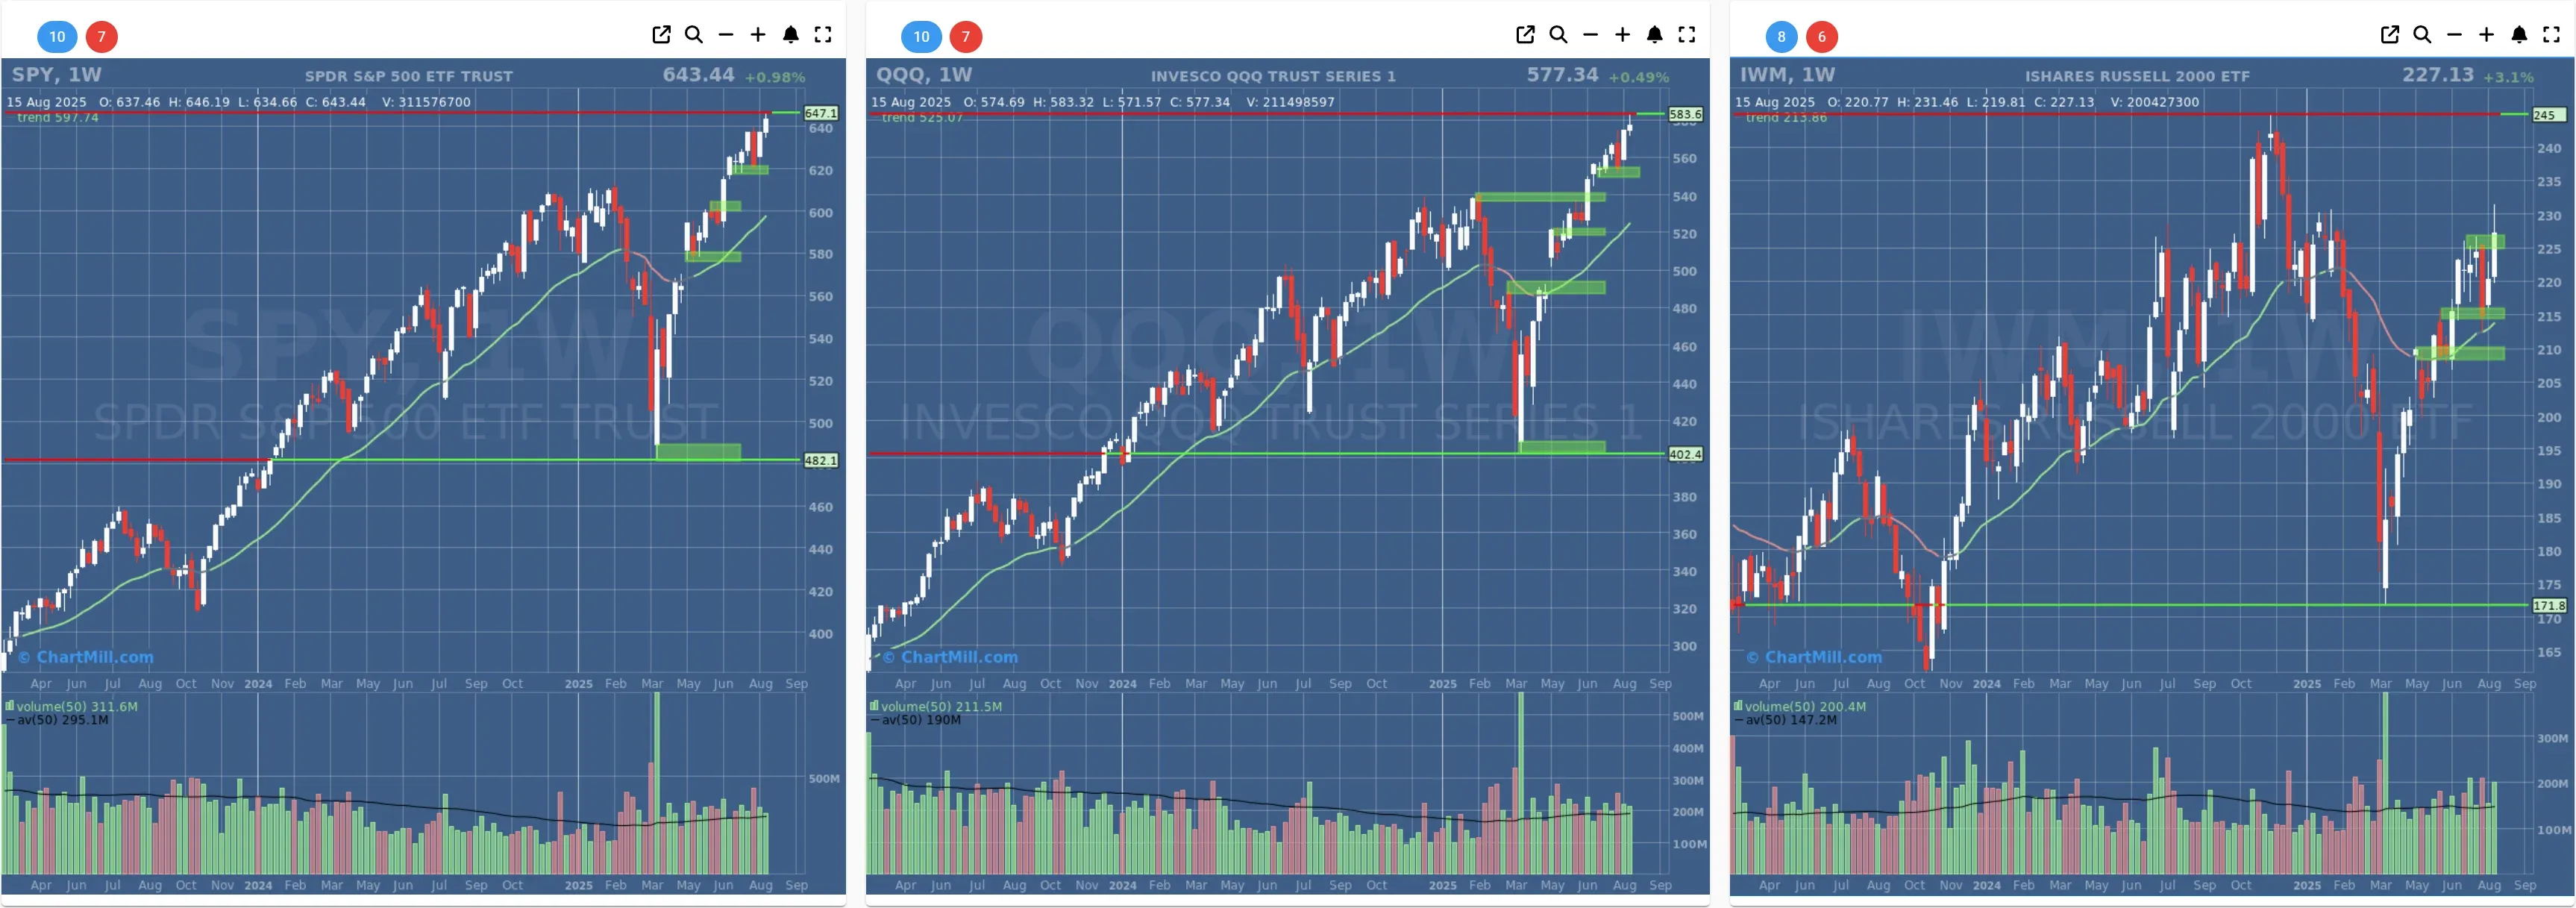
- Long-Term Trend: Positive (no change)
- Long-Term Trend: Positive (no change)
- Long-Term Trend: Positive (from neutral)
Daily Market Breadth Analysis – August 15, 2025 (After Market Close)
After back‑to‑back broad advances on Aug 12–13, breadth flipped red on Aug 14 as 71% of issues declined. Despite the single‑day setback, the weekly and monthly composites remain firmly positive and more than half of stocks still sit above their key moving averages. Net‑net: a pause inside an improving intermediate trend.
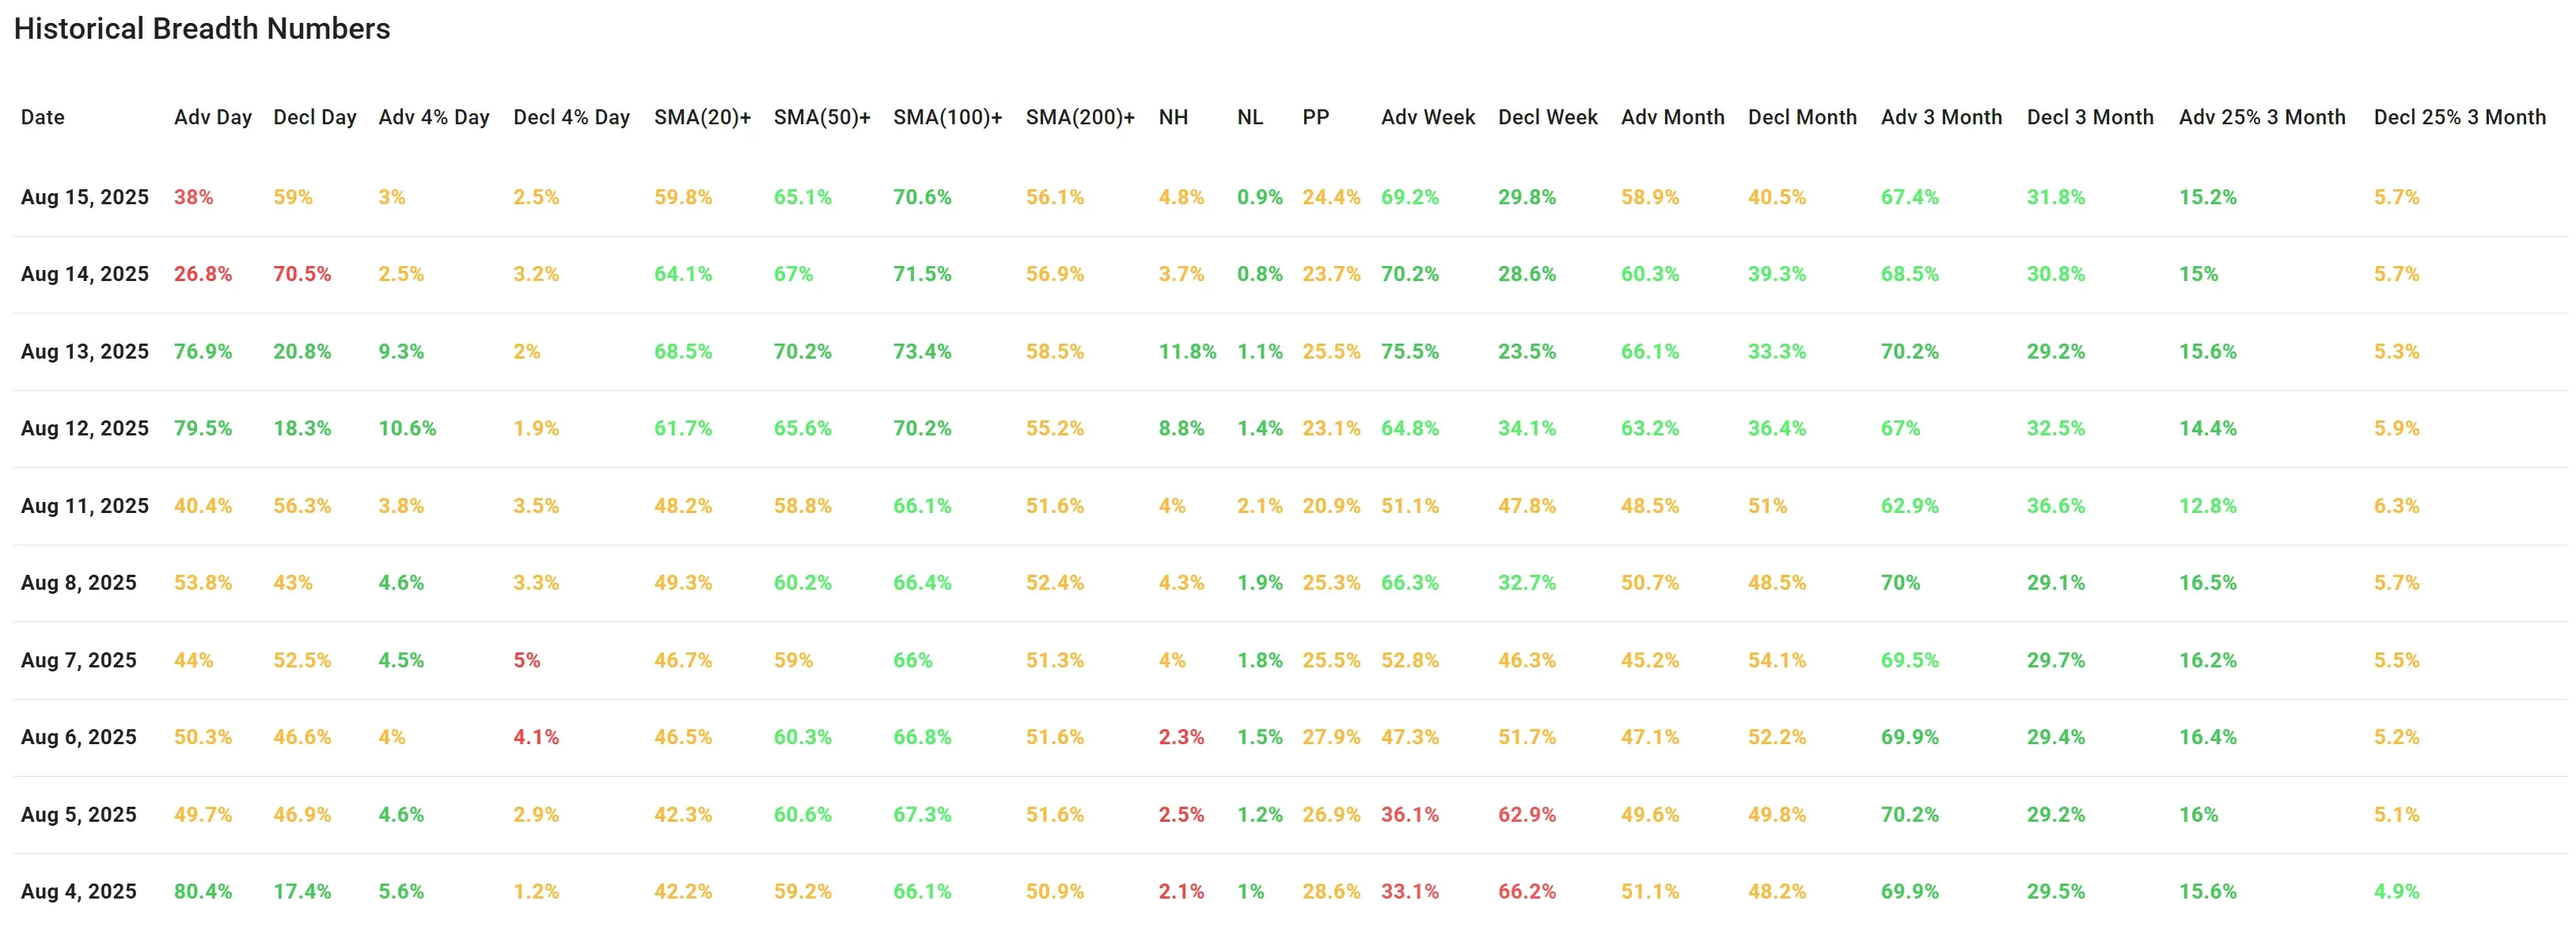
The most recent breadth data for August 15, 2025 shows a clear cooling of momentum. Advancing issues accounted for just 38%, while 59% of stocks declined, a sharp reversal from the strong breadth seen on August 13 and 12, when advances were in the 77–80% range.
This indicates that the recovery earlier in the week lacked strong follow-through.
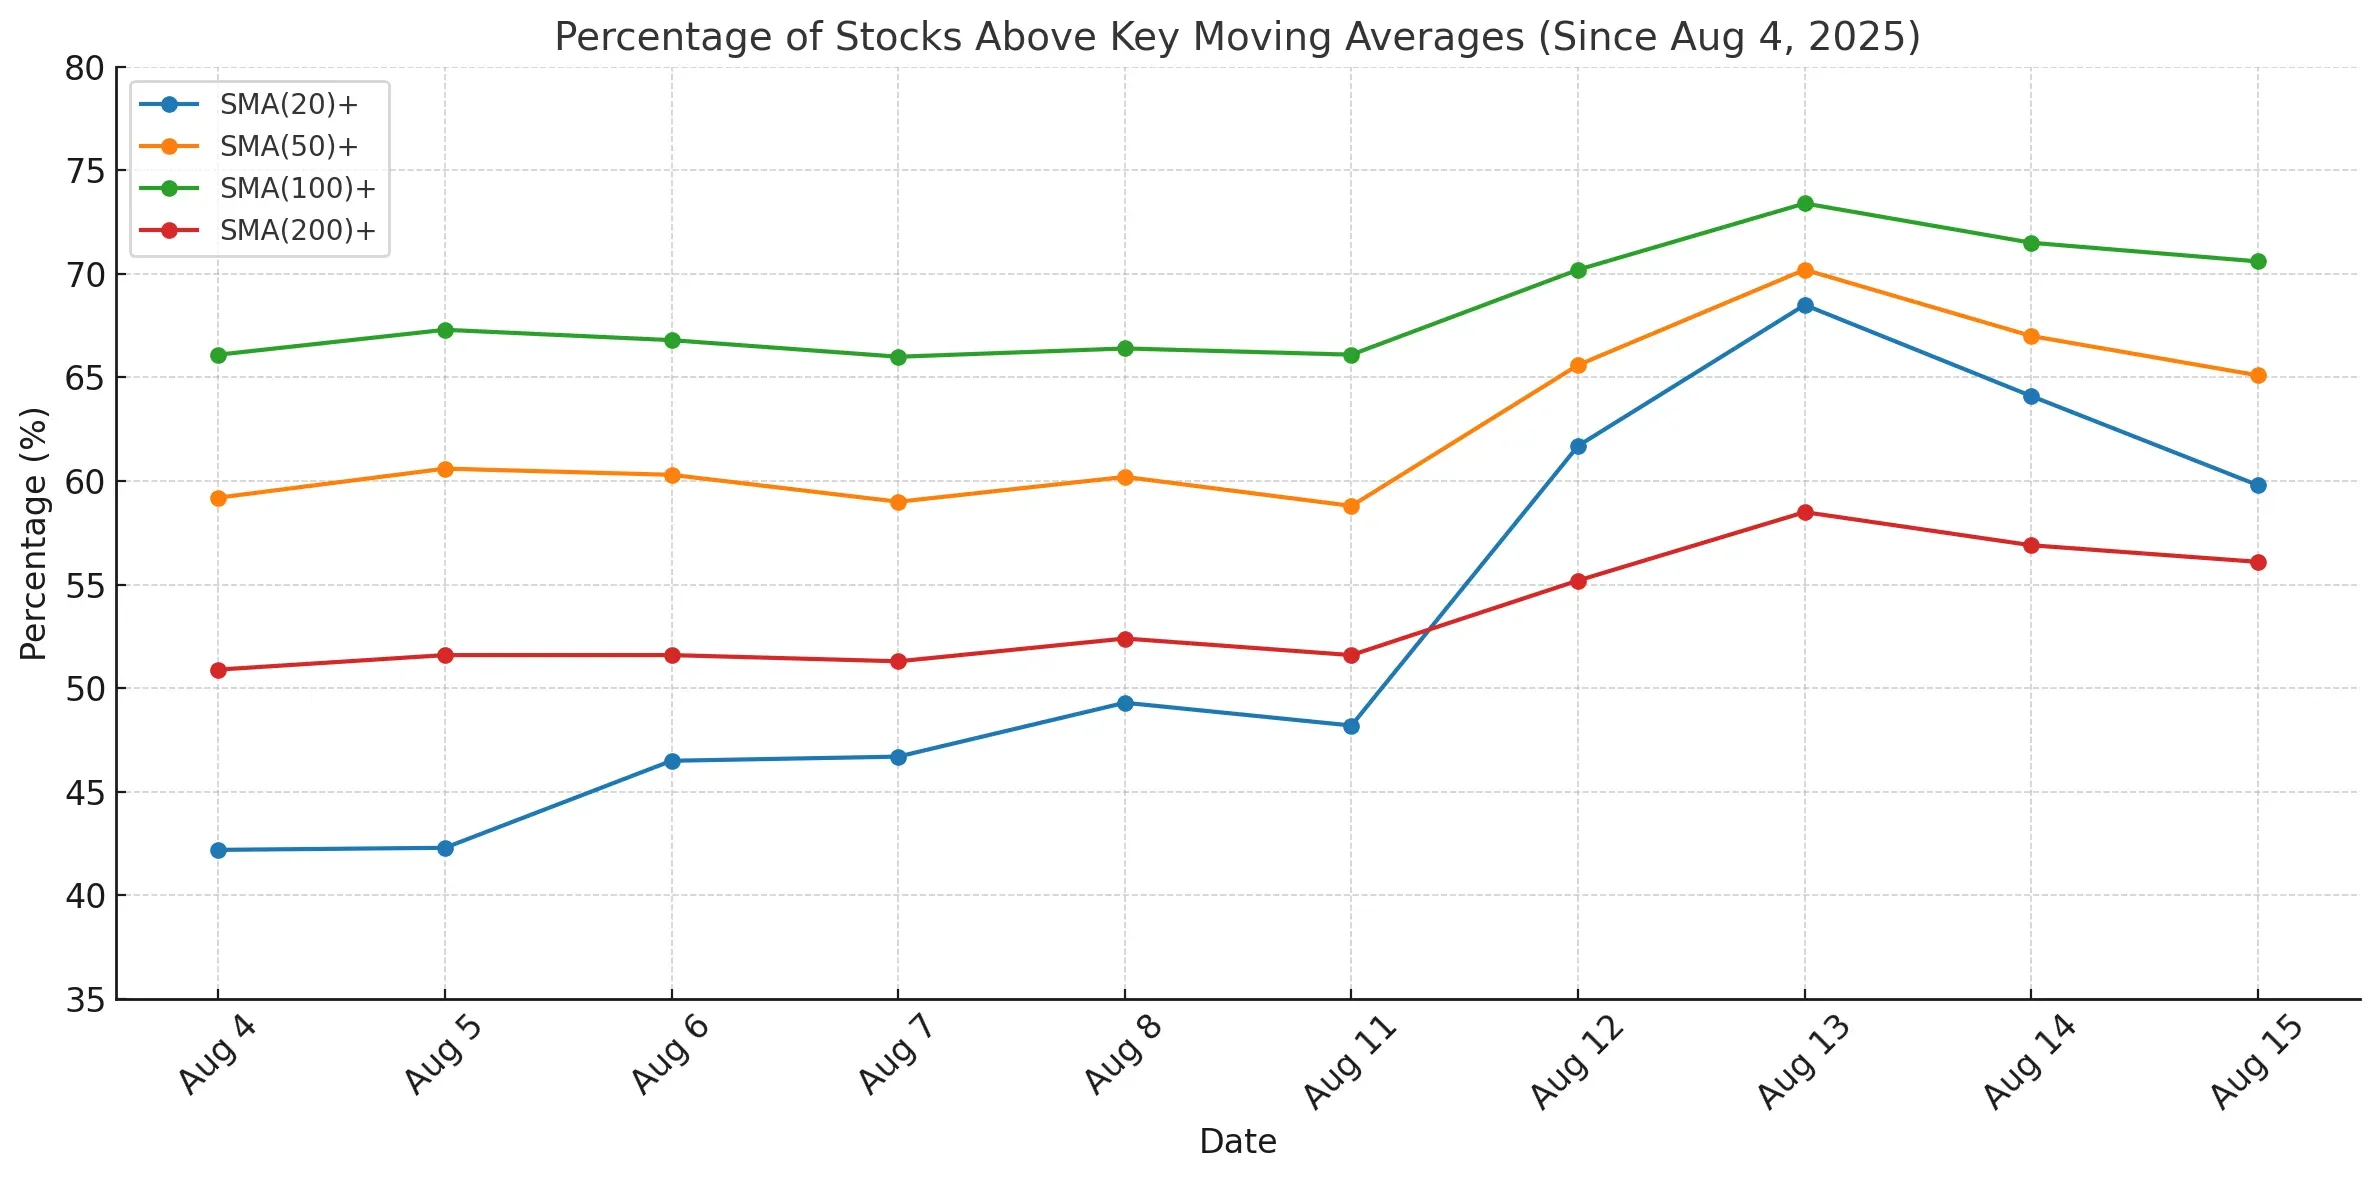
Looking at short-term breadth (SMA levels), the percentage of stocks trading above their 20-day moving average fell to 59.8%, down from 68.5% on August 13.
Similarly, stocks above the 50-day dipped to 65.1%, and above the 100-day to 70.6%.
The 200-day level remained stable at 56.1%, but still reflects only modest longer-term strength.
New highs (NH) contracted sharply to 4.8%, less than half of the 11.8% peak from August 13, while new lows (NL) stayed muted at just 0.9%. This contraction in leadership confirms that buyers have stepped back after the midweek rally.
On a weekly horizon, breadth remains tilted towards the positive side, with 69.2% of stocks advancing vs. 29.8% declining. However, this advantage is narrower than the stronger ratios seen earlier in the week.
Monthly and quarterly metrics continue to show balance, with advances generally outweighing declines, but without decisive momentum in either direction.
Comparison with the previous session (August 14):
Yesterday’s breadth already hinted at cooling, with advancing issues at 26.8% versus 70.5% declines. Today’s numbers reflect only a partial rebound, but still leave the market in a vulnerable position.
The bounce from August 13–12 has now given way to renewed selling pressure, suggesting that buyers were not willing to sustain leadership.
Conclusion: The recent two-day surge in breadth has quickly faded, giving way to renewed weakness. While longer-term measures remain constructive, the short-term picture reflects hesitation and fragility.
Unless advancing participation strengthens again, market breadth risks sliding back into a corrective phase.
Breadth Trend Rating: 3 – Neutral (with a short-term negative tilt after losing follow-through).

Kristoff - ChartMill
Next to read: Market Monitor News, August 18 BMO