(All data & visualisations by ChartMill.com)
Daily Market Trend Analysis – July 14, 2025 (After Market Close)
Both QQQ and SPY appear primed to reach new highs...
Short Term Trend
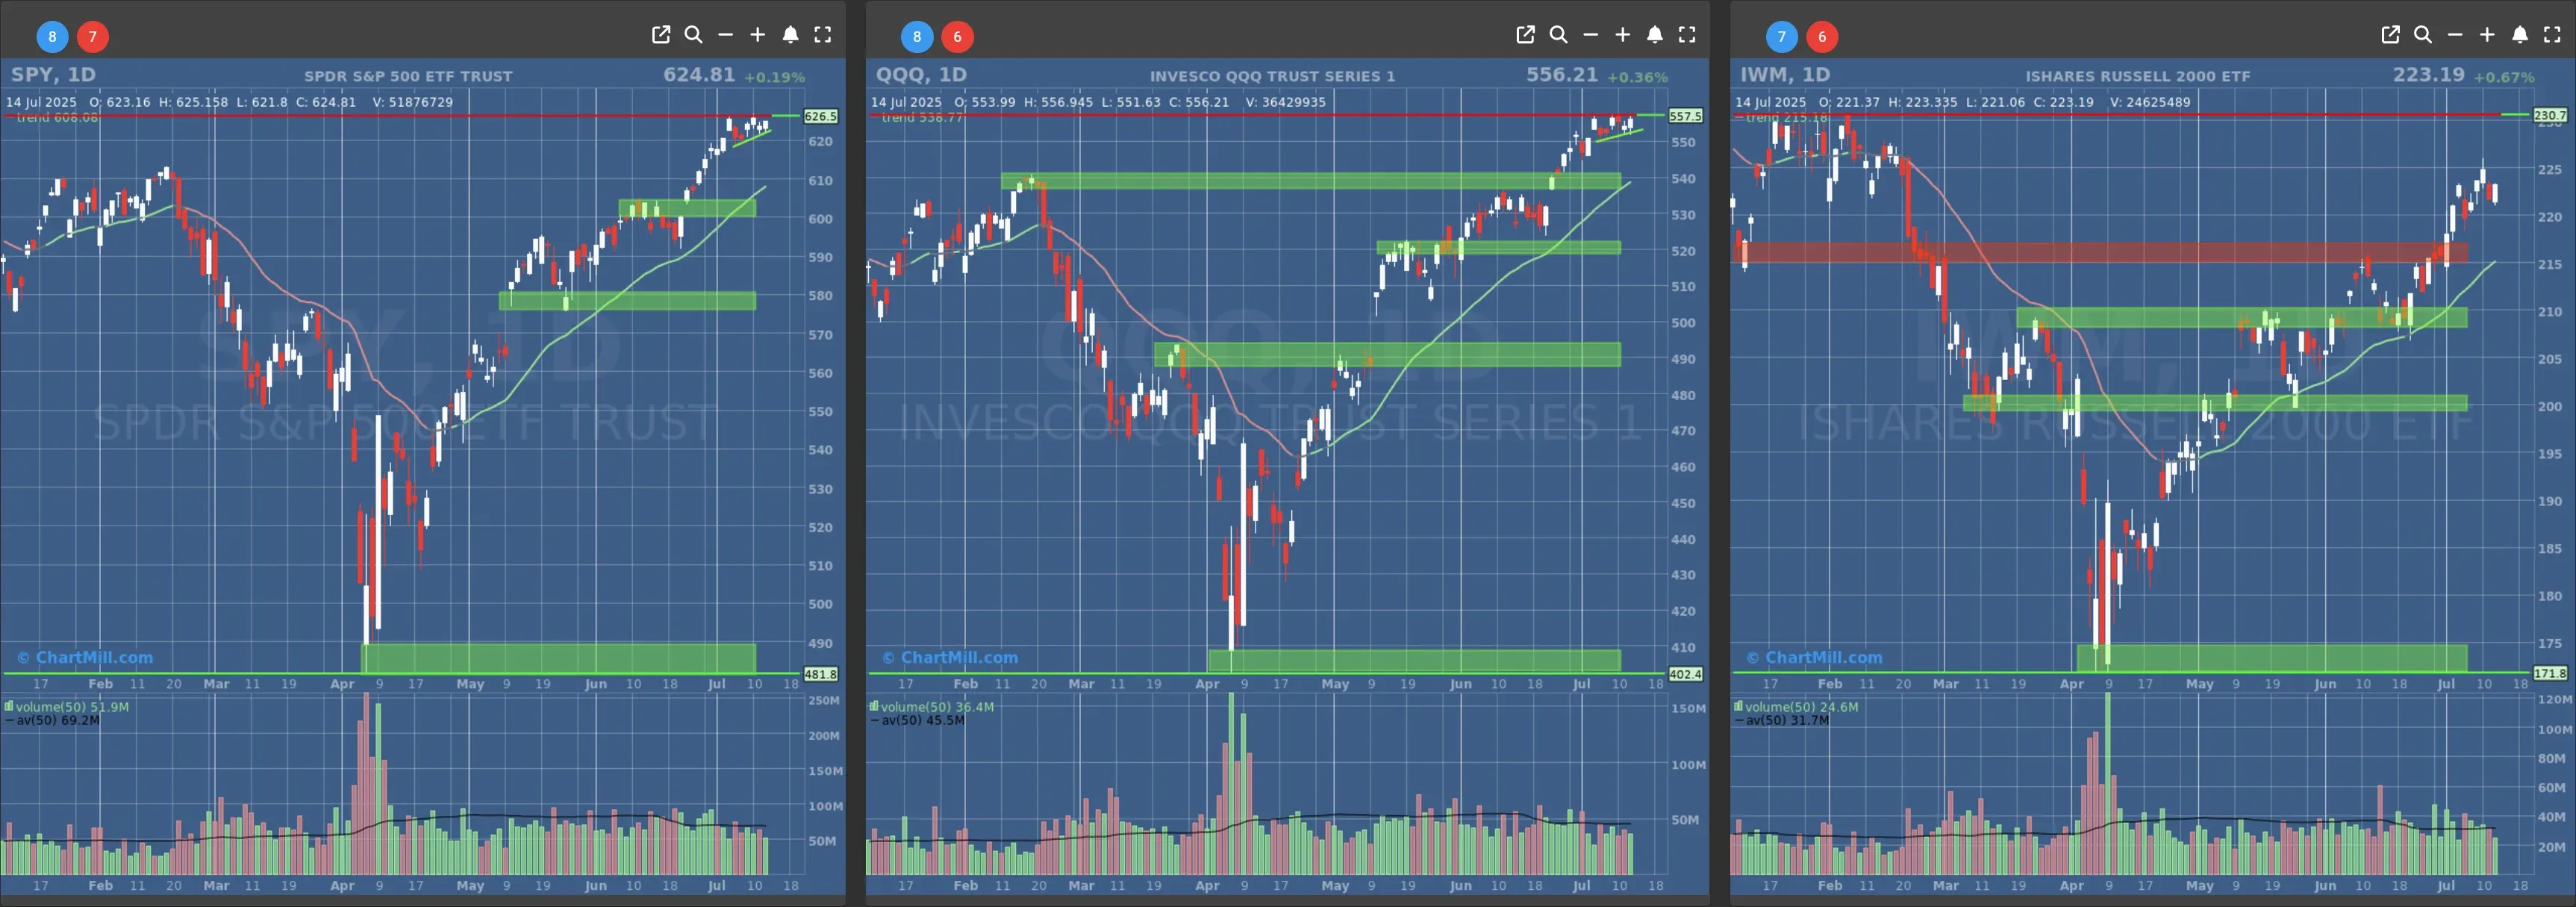
- Short-Term Trend: Bullish (no change)
- Next Support at $600 to $610
- Next Resistance at /
- Volume: Slightly Below Average (50)
- Pattern: Up Day - Ascending Triangle
- Short-Term Trend: Bullish (no change)
- Next Support at $540
- Next Resistance at /
- Volume: Slightly Below Average (50)
- Pattern: Up Day - Ascending Triangle
- Short-Term Trend: Bullish (no change)
- Next Support at $210
- Next Resistance at $215 to $220
- Volume: Slightly Below Average (50)
- Pattern: Up Day
Long Term Trend
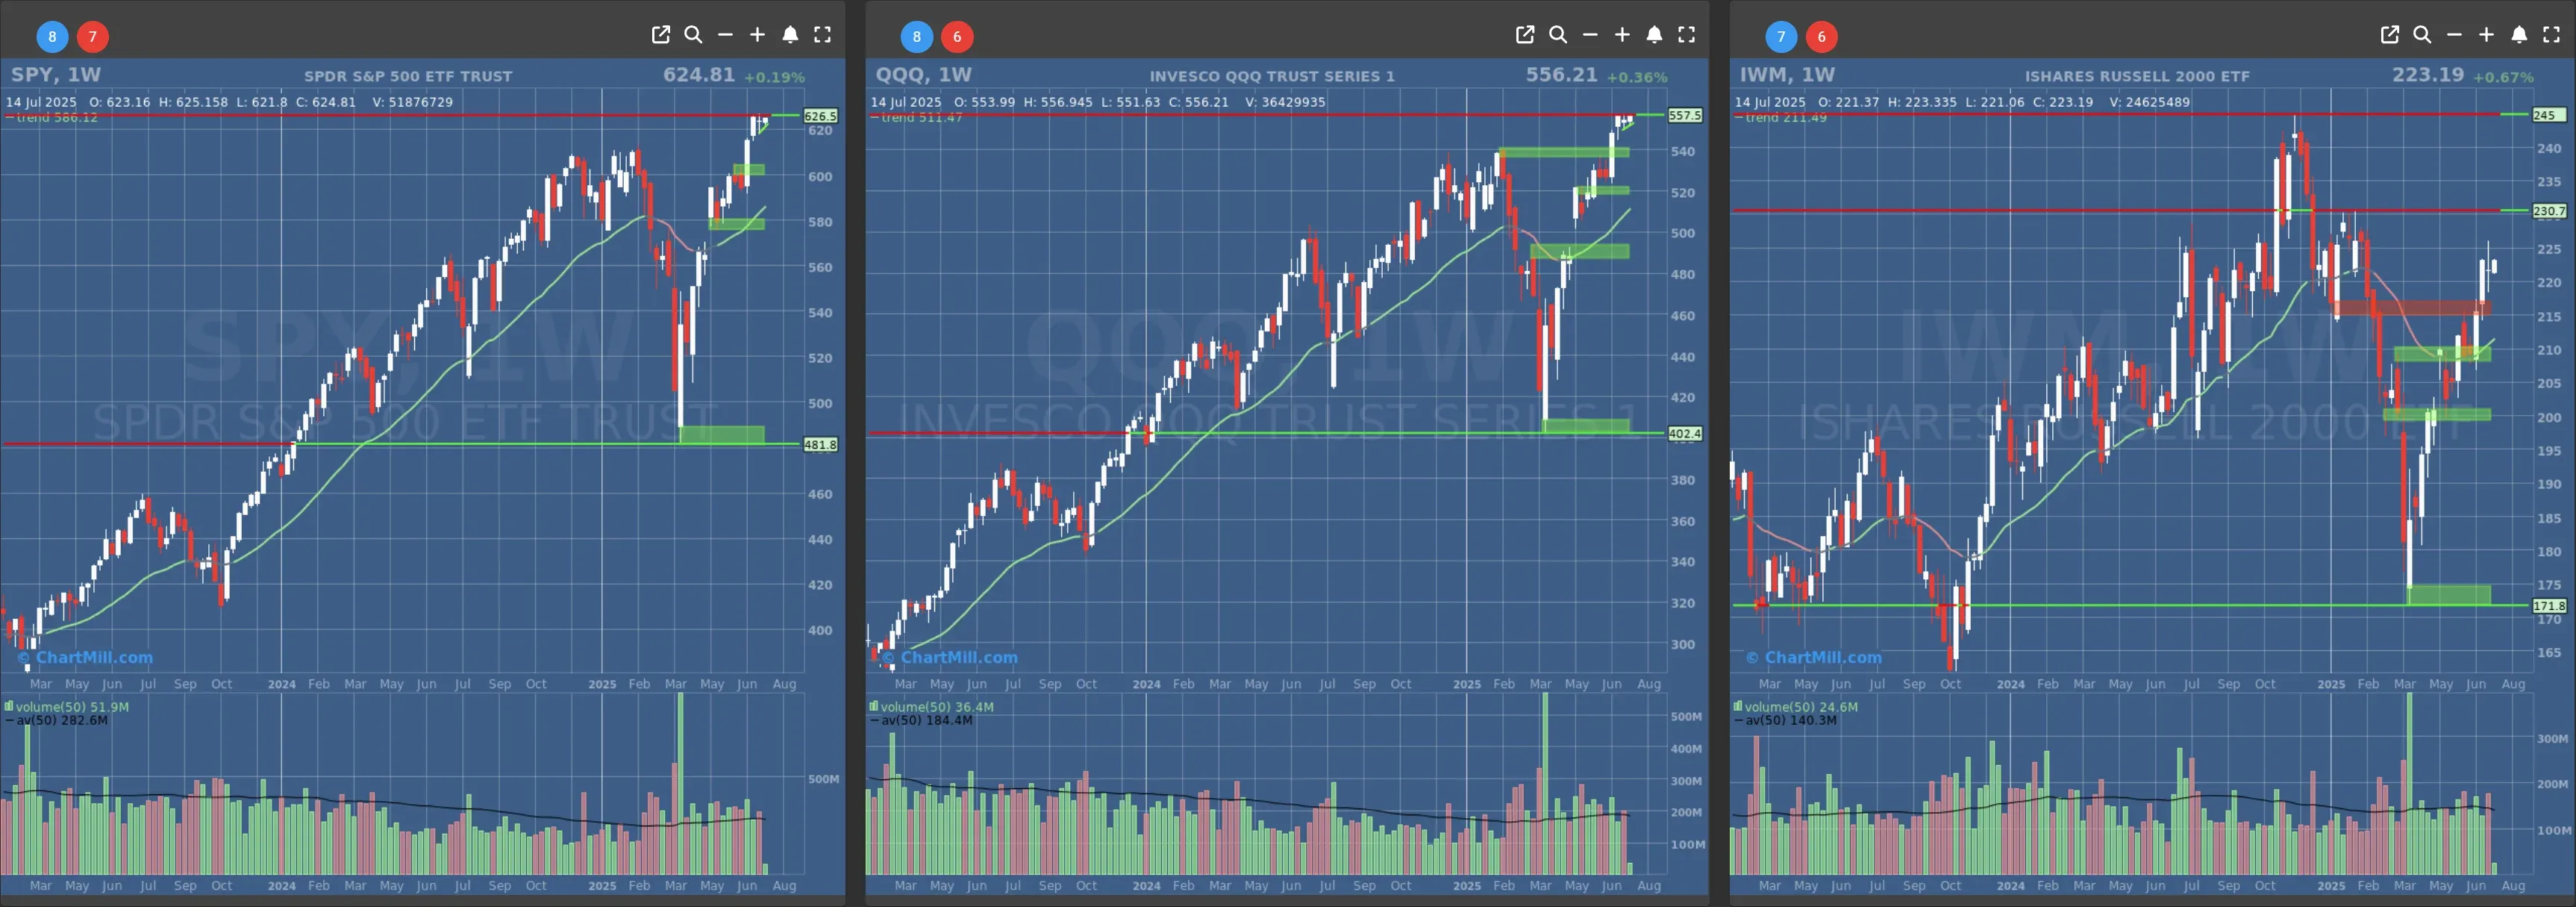
- Long-Term Trend: Positive (no change)
- Long-Term Trend: Positive (no change)
- Long-Term Trend: Positive (no change)
Daily Market Breadth Analysis – July 14, 2025 (After Market Close)
After a shaky end to last week, market breadth on Monday made a meaningful shift, one that could indicate strengthening internal support just as earnings season and inflation data are about to put the markets to the test.
The breadth didn’t explode higher, but the numbers are telling a more constructive story than we saw last Friday. Here’s what the data shows and what it might mean heading into a pivotal week.
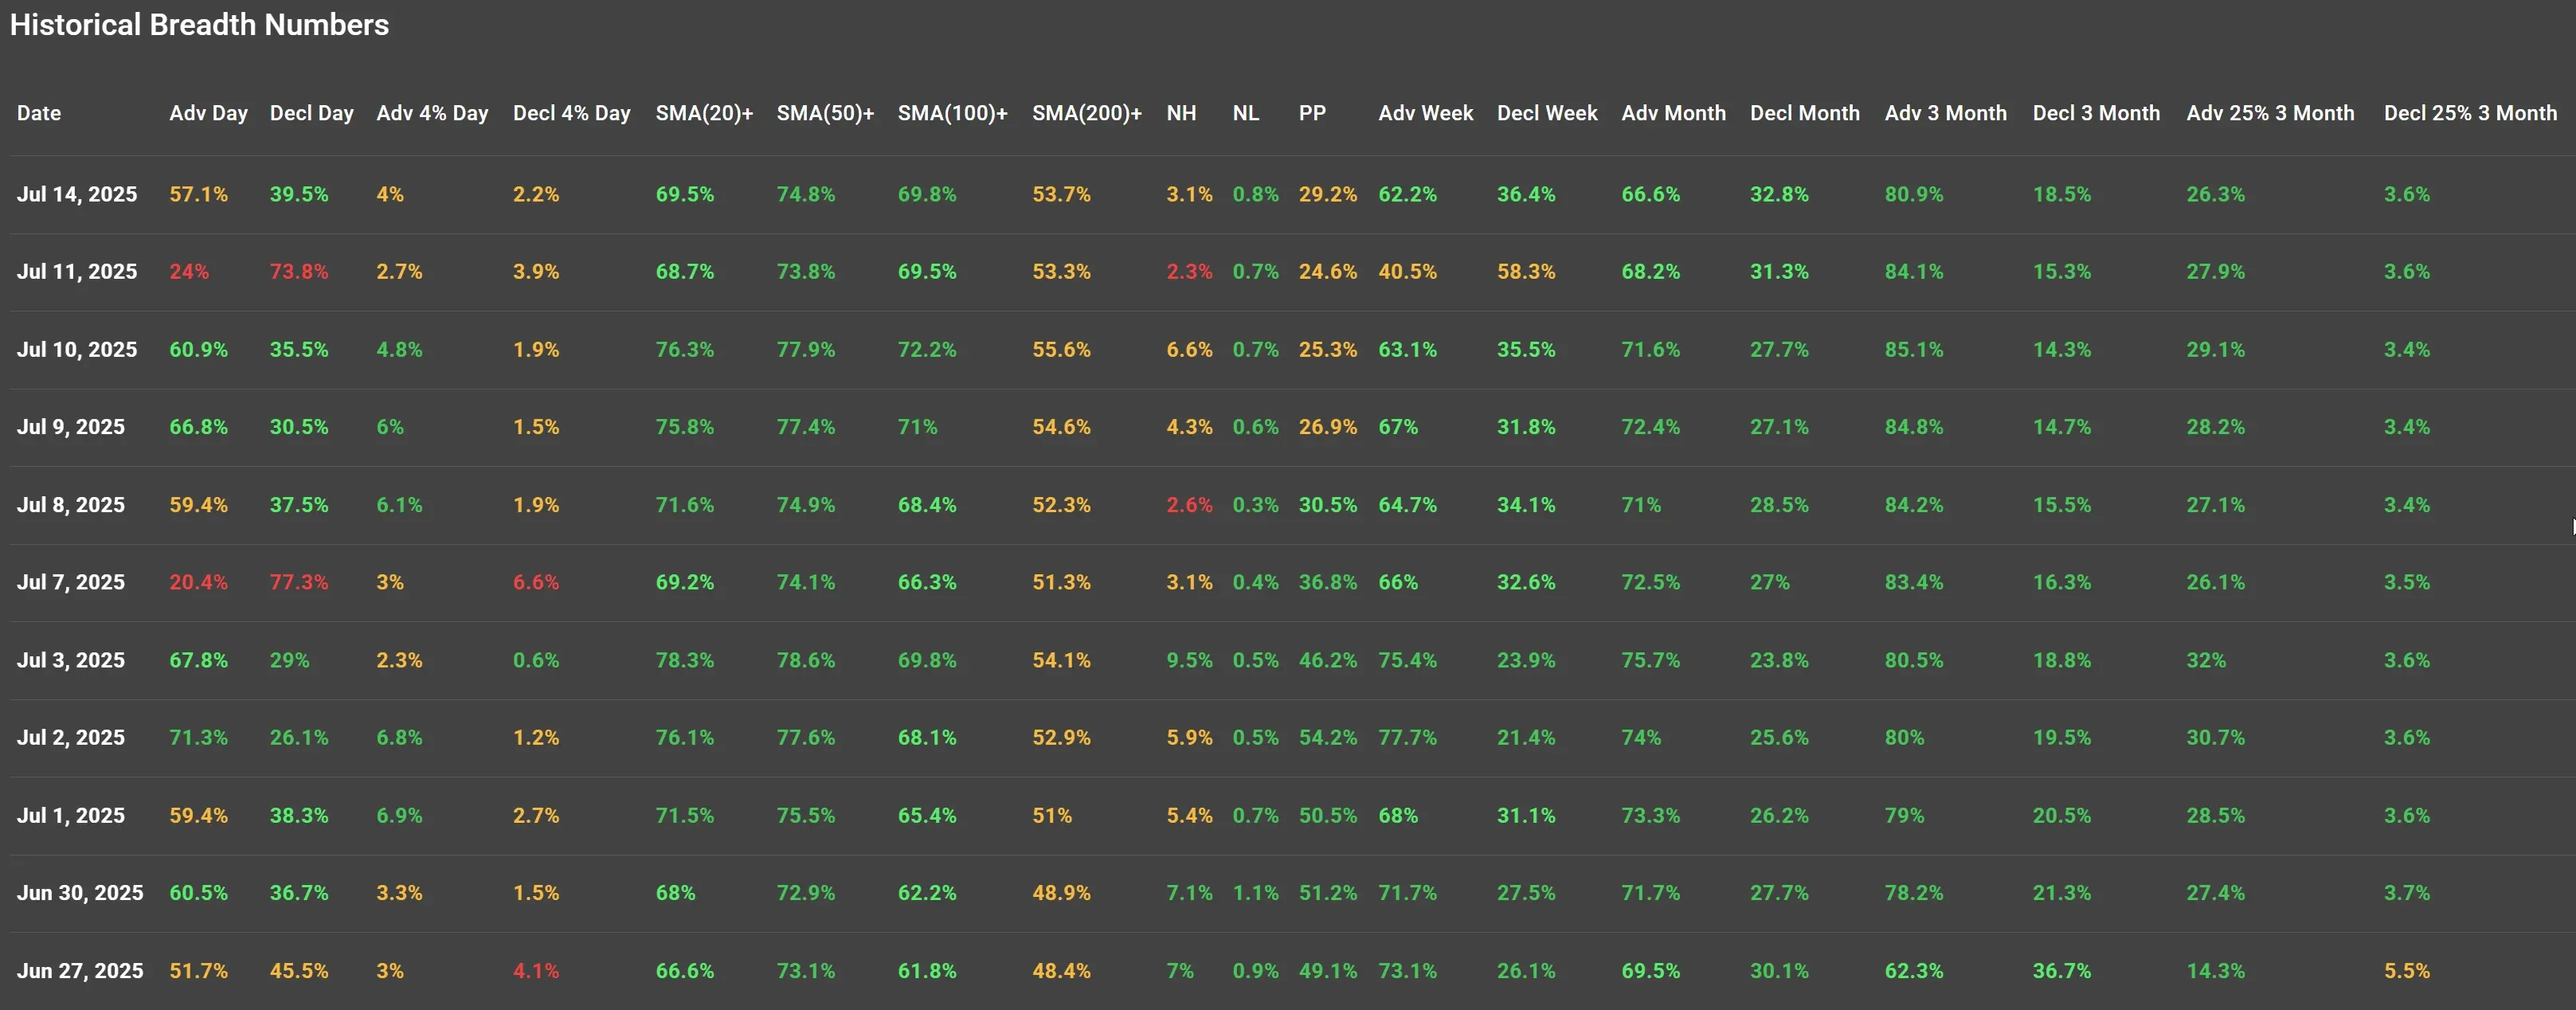
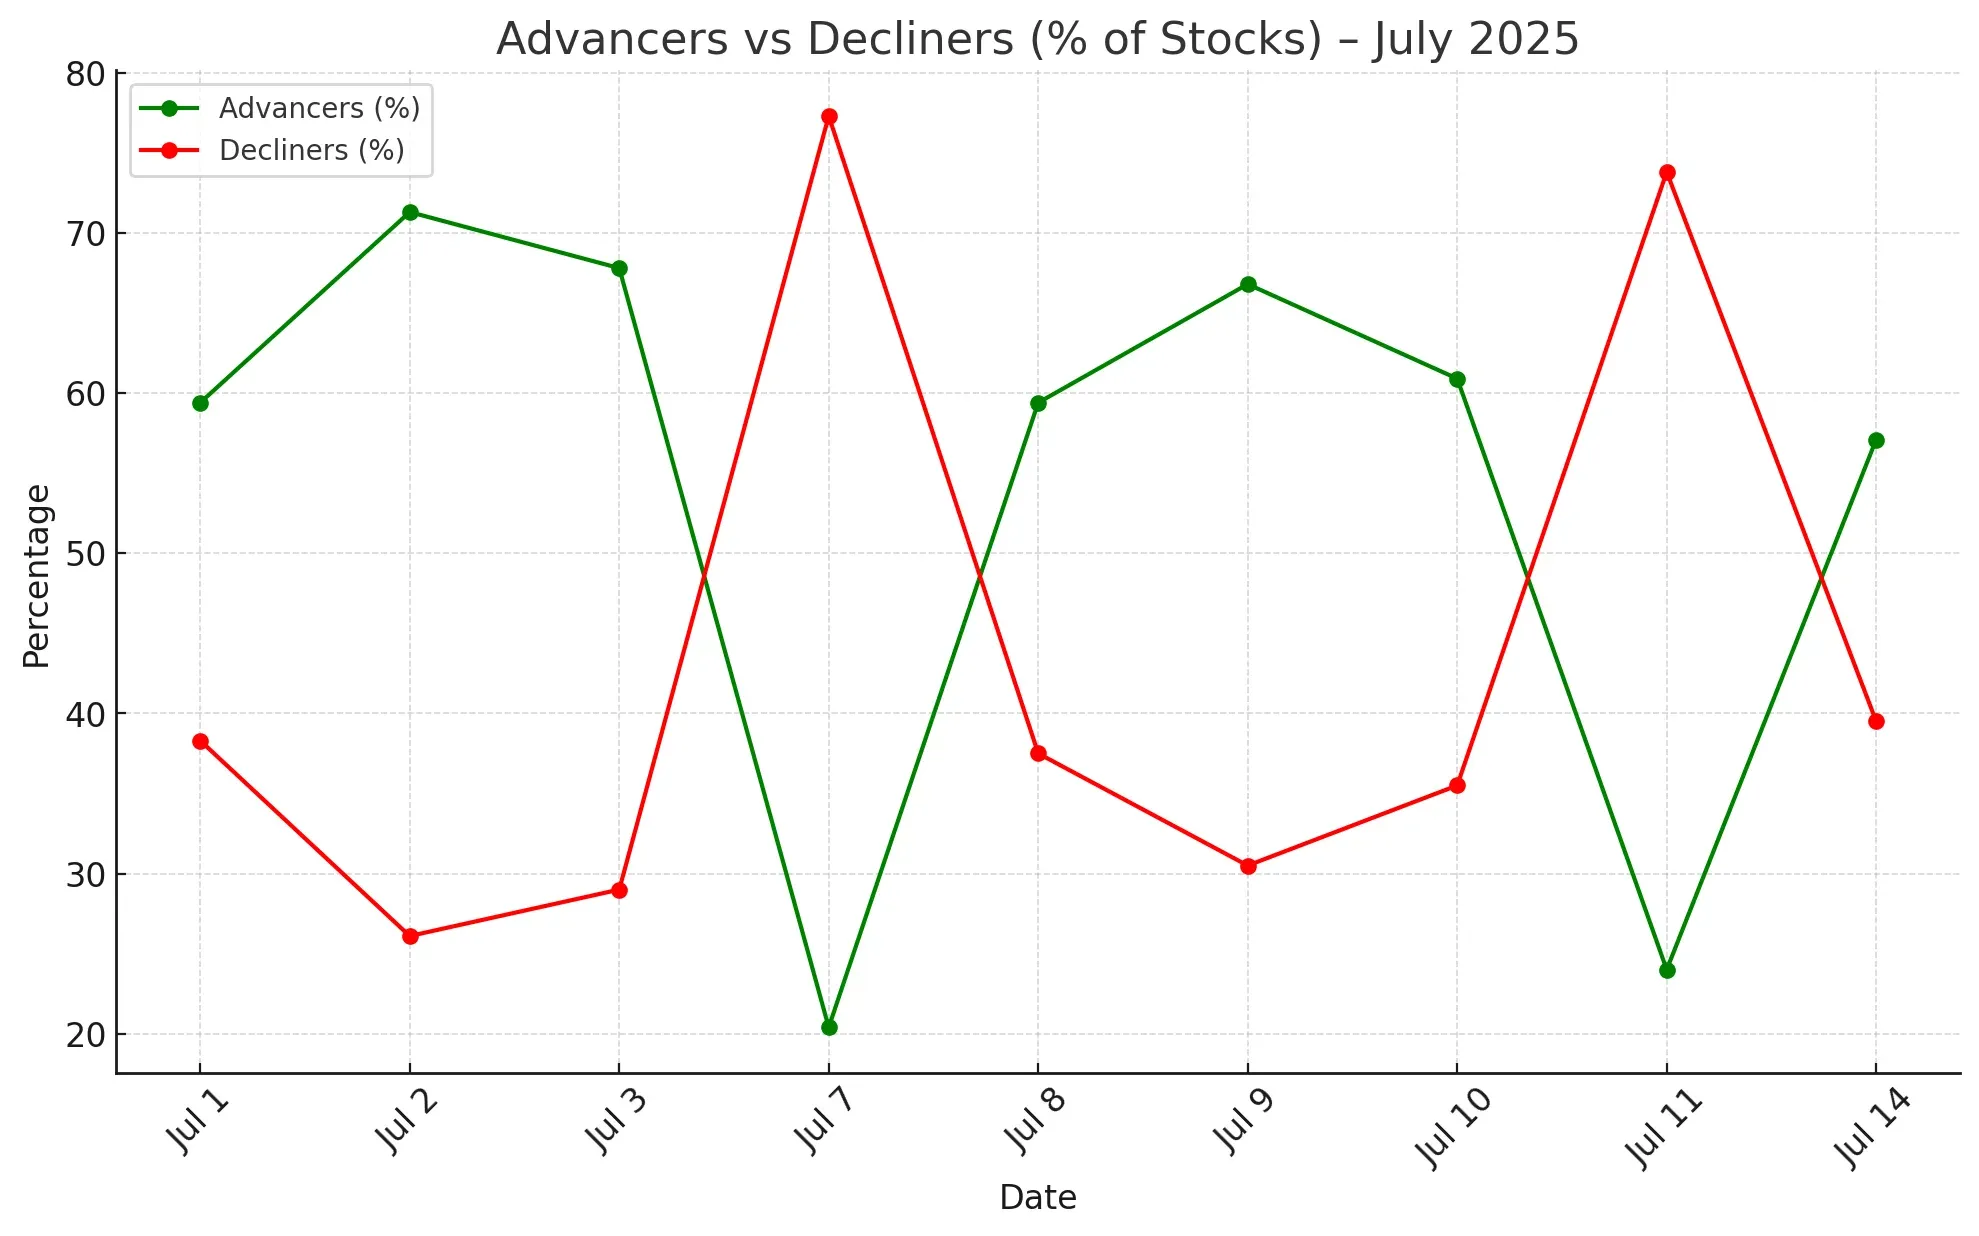
Advancers Regain the Edge, Participation Improves
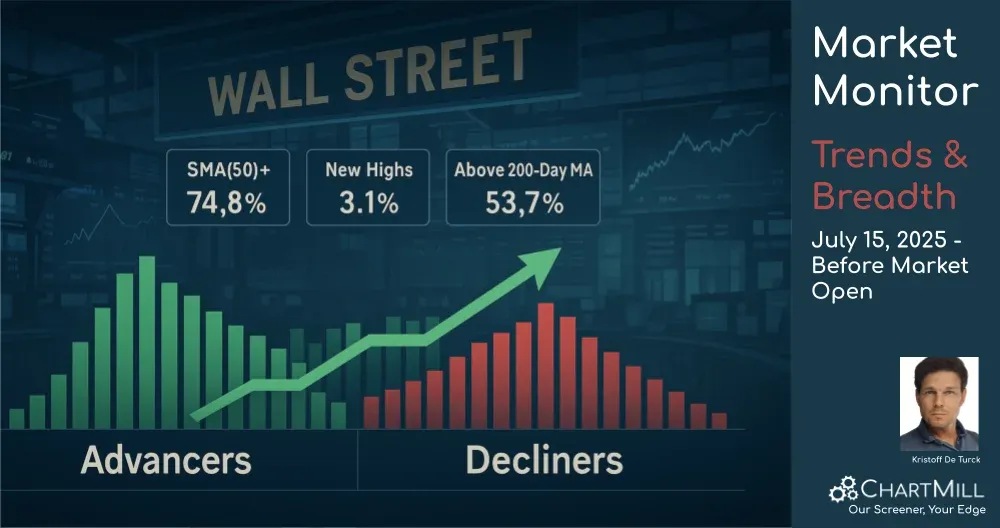
On July 14, 2025, 57.1% of stocks advanced on the day versus 39.5% that declined. While the gain isn’t overwhelming, it marks a sharp reversal from Friday’s ugly 24% advancers and shows a market that's regaining composure.
Even more encouraging, the 4% Day Advancers - those stocks gaining more than 4% - increased slightly to 4.0%, up from 2.7%. It’s modest, but it shows there’s some real buying enthusiasm coming back, not just passive drift.
On the flipside, the Decliners >4% came down to 2.2% from 3.9%, a good sign that the worst-hit names are stabilizing.
Short-Term Momentum Shifts: Moving Averages Firming Up
Participation across key short-term and intermediate-term moving averages also bounced back:
-
SMA(20)+: 69.5% (vs. 68.7% Friday)
-
SMA(50)+: 74.8% (vs. 73.8%)
-
SMA(100)+: 69.8% (vs. 69.5%)
-
SMA(200)+: 53.7% (unchanged)
These upticks may look small, but they reflect quiet improvement under the surface. The 20-day and 50-day breadth indicators especially confirm that the short-term pullback hasn’t broken the broader trend.
It’s worth noting that the percentage of stocks above their 200-day remains stuck just above 50%, which is a line in the sand. As long as this level holds, longer-term trend followers can breathe easier.
New Highs Tick Up, While Lows Remain Contained
New Highs (NH) edged slightly higher to 3.1%, while New Lows (NL) stayed very subdued at 0.8%. These are healthy levels, especially coming off a risk-off Friday. The shift suggests underlying confidence, despite the cautious headline indices.
Weekly & Monthly Breadth Metrics Are Holding the Line
-
Advancing Week %: 62.2% (up from 40.5% Friday)
-
Declining Week %: 36.4% (down from 58.3%)
That’s a big swing, and it shows just how narrow Friday’s weakness really was. One bad session didn’t derail the weekly uptrend. The monthly and 3-month advance/decline stats remain rock solid:
-
Adv Month: 66.6%
-
Adv 3 Month: 80.9%
-
Decl 3 Month: 18.5%
The longer-term data tells us the bull trend is intact, despite the occasional bump in the road.
Context: Friday Was Bad, but Not Trend-Breaking
Looking back to Friday, July 11, the data was notably risk-off:
-
Just 24% advancers
-
73.8% decliners
-
3.9% of stocks dropped >4%
-
New Highs fell to just 2.3%
It looked like a warning shot, but Monday’s bounce suggests it was more of a sentiment hiccup, likely tied to tariff concerns and pre-inflation anxiety, than the start of something bigger. No major technical damage was done.
Final Thoughts: Constructive, but Not Euphoric
Monday’s breadth bounce isn’t a moonshot, but it matters. It tells me buyers are stepping back in, not aggressively, but selectively. Breadth isn’t deteriorating. It’s quietly improving, just as the market is about to face serious tests from earnings reports and macro data.
We’ll be watching closely how breadth responds to Tuesday’s CPI print. A hotter-than-expected number could shake things up but for now, internal market structure remains intact and even improving.
Stay tuned, breadth doesn’t lie!
Kristoff - ChartMill
Next to read: Market Monitor News, July 15