
(All data & visualisations by ChartMill.com)
Daily Market Trend Analysis – July 11, 2025 (After Market Close)
Both QQQ and SPY are forming an ascending triangle pattern on the daily chart.
Short Term Trend
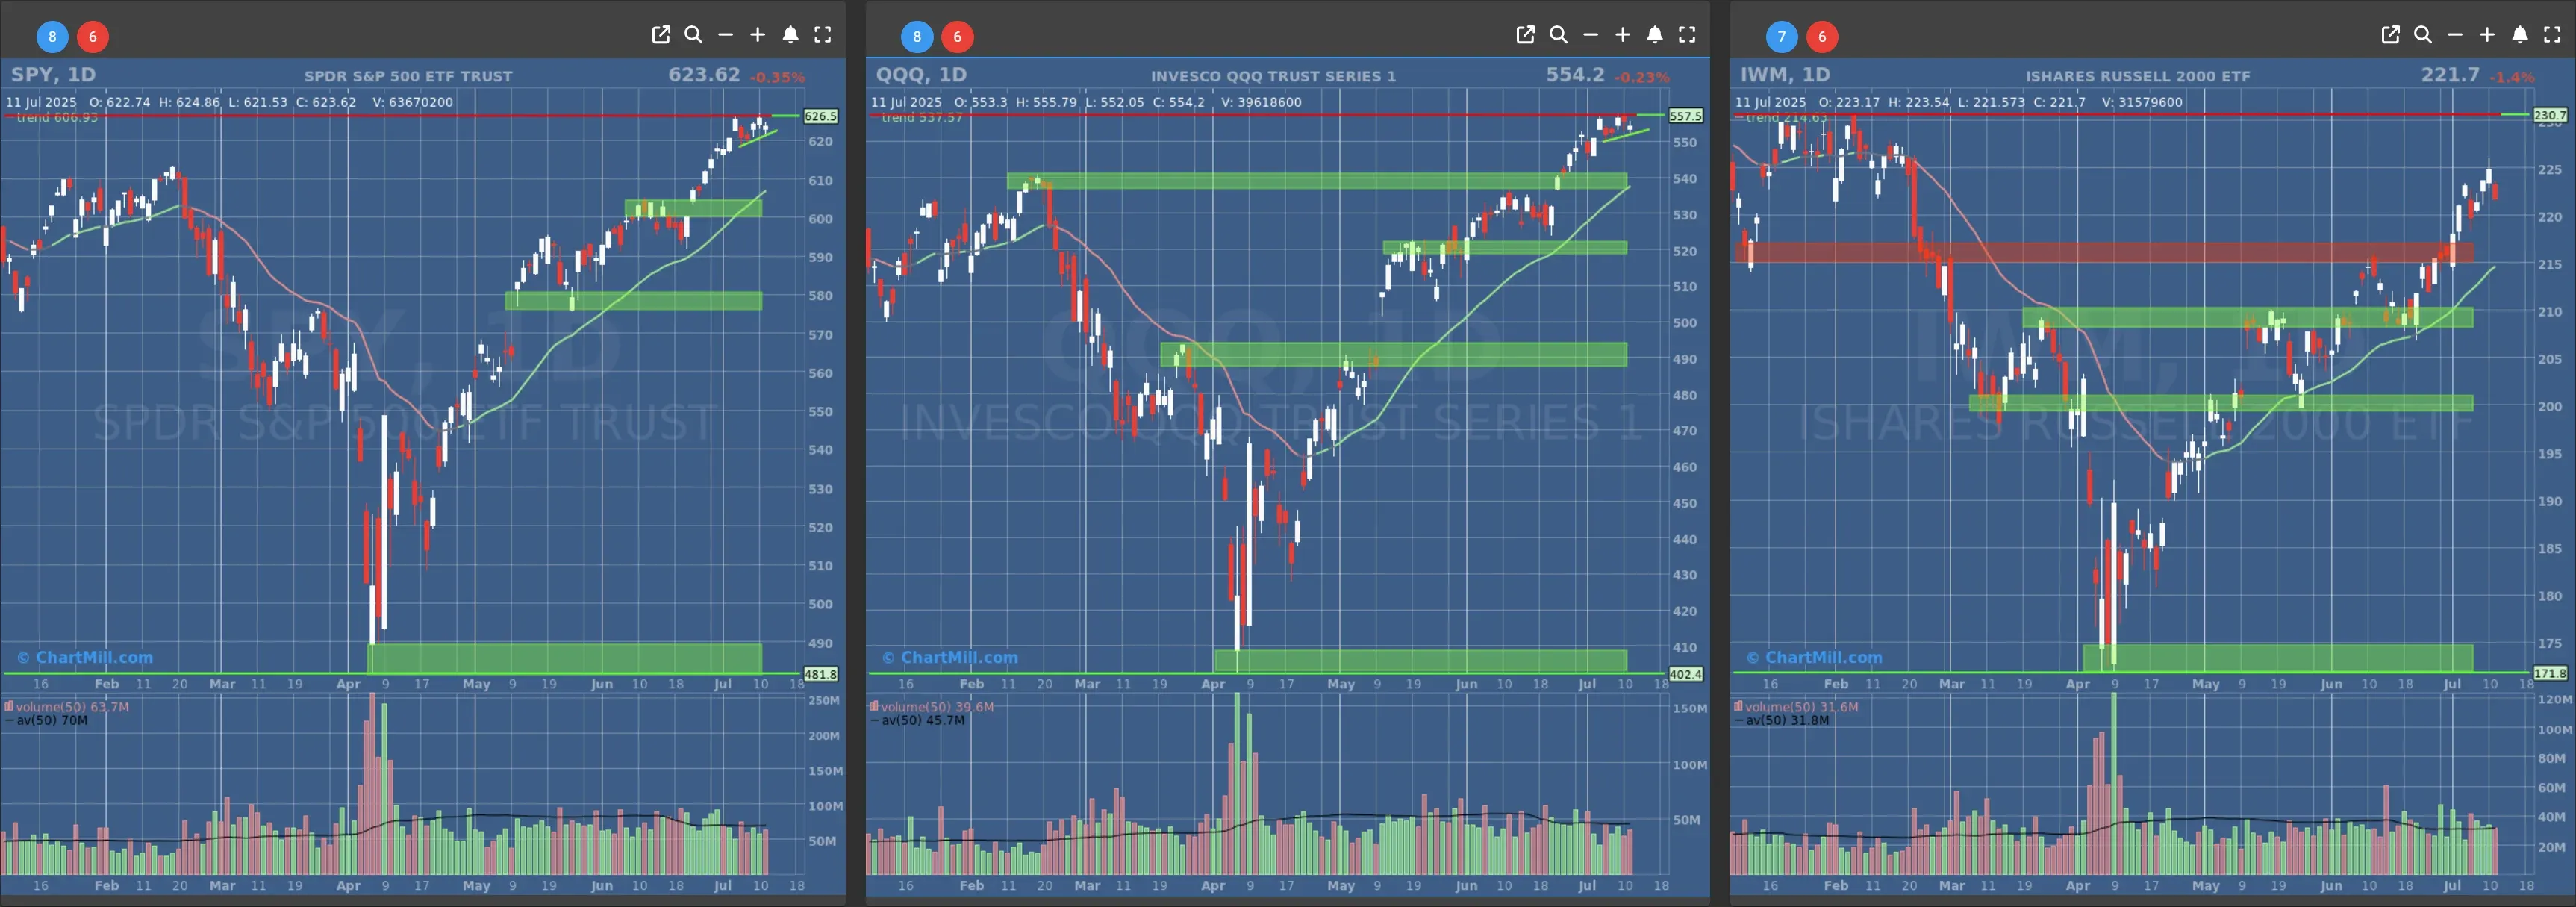
- Short-Term Trend: Bullish (no change)
- Next Support at $600 to $610
- Next Resistance at /
- Volume: Slightly Below Average (50)
- Pattern: Down Day - Doji Candle - Ascending Triangle
- Short-Term Trend: Bullish (no change)
- Next Support at $540
- Next Resistance at /
- Volume: Slightly Below Average (50)
- Pattern: Down Day - Doji Candle - Ascending Triangle
- Short-Term Trend: Bullish (no change)
- Next Support at $210
- Next Resistance at $215 to $220
- Volume: At Average (50)
- Pattern: Down Day
Long Term Trend
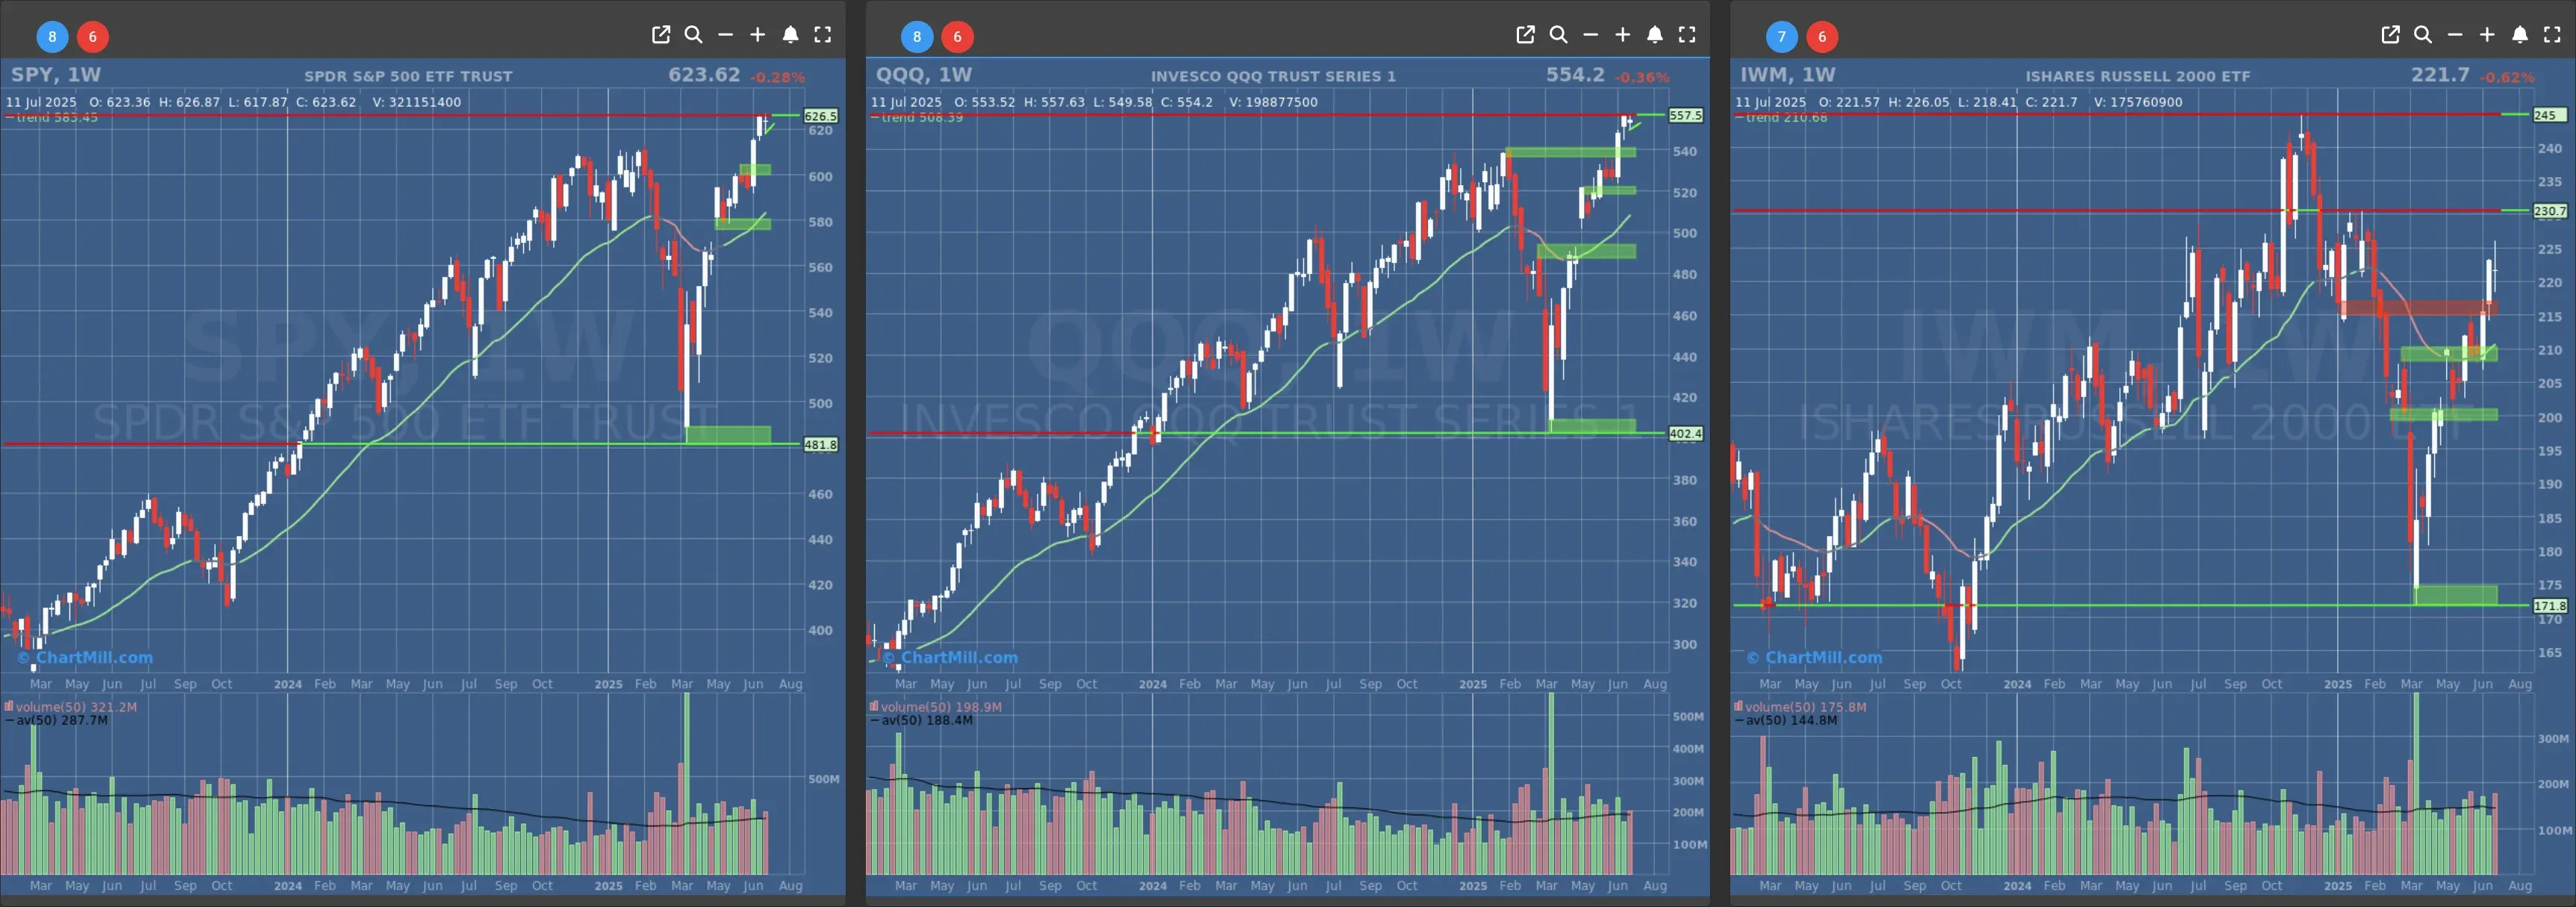
- Long-Term Trend: Positive (no change)
- Long-Term Trend: Positive (no change)
- Long-Term Trend: Positive (no change)
Daily Market Breadth Analysis – July 11, 2025 (After Market Close)
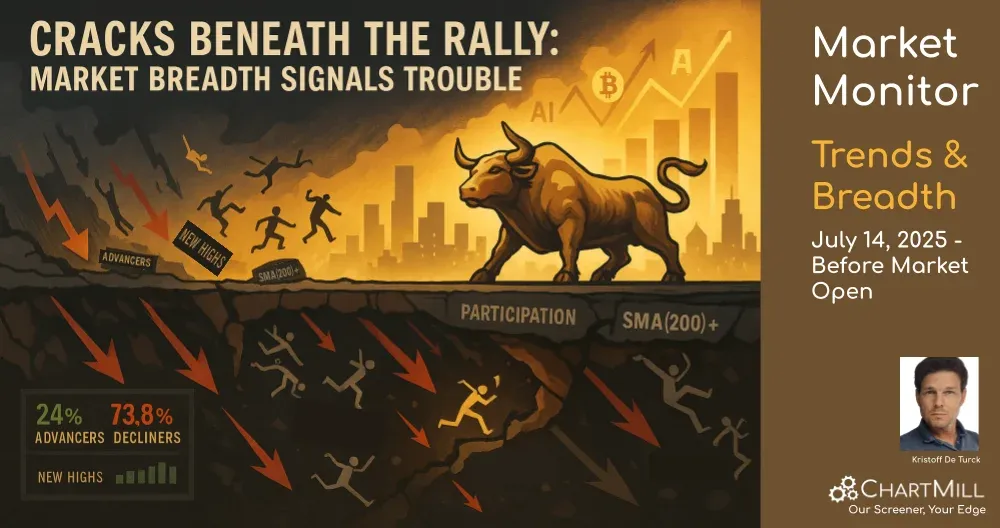
Let’s call it what it was: Thursday's market resilience evaporated into Friday’s retreat, and the market breadth data confirms it.
While a few mega-caps like Nvidia and crypto names kept headlines bullish, the internal structure of the market showed distinct signs of weakness? borderline fragility, even.
Participation Breakdown: A Stark Shift in Tone
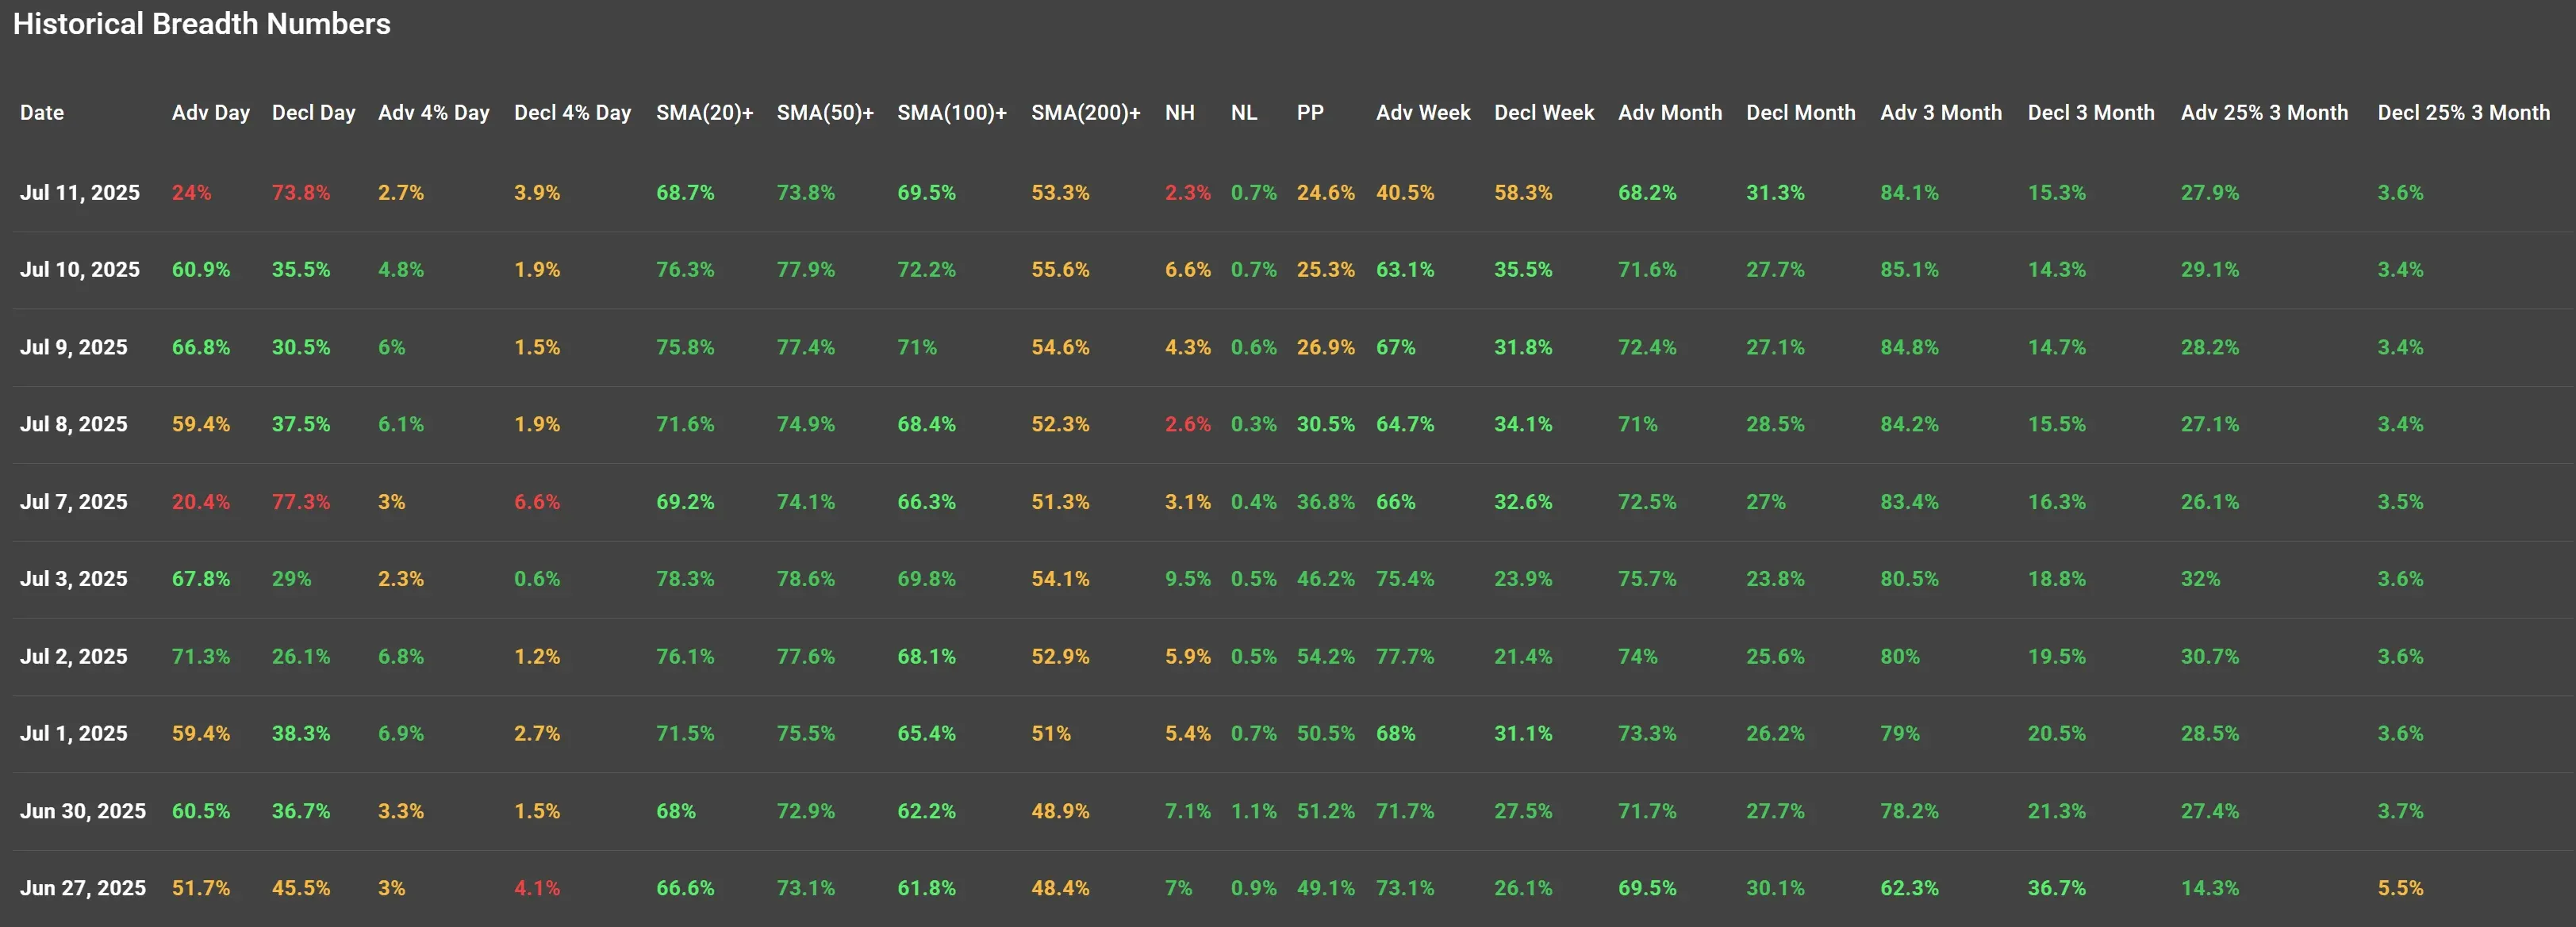
On July 11, only 24% of stocks finished the day higher? a sharp drop from the healthy 60.9% advance day on July 10. Decliners, on the other hand, surged to 73.8%, the worst reading since July 7 when just 20.4% advanced.
This is a significant reversal from earlier in the week, when bullish breadth seemed to be building. The advance-decline spread flipped hard into the red, highlighting how few stocks participated in any kind of upside and how broad the selling pressure actually was.
High-Intensity Moves: Momentum Dwindles
Looking at the intensity of the moves, the number of stocks advancing more than 4% dropped to just 2.7%, while 3.9% declined over 4%. The previous session had shown signs of upward momentum regaining ground (4.8% of stocks up 4%+), but Friday reversed course.
That’s a clear sign the market’s upward thrust wasn’t built on solid footing.
Moving Averages: Longer-Term Health Still Intact
The percentage of stocks trading above short- and mid-term moving averages (SMA 20, 50, 100) softened slightly but remained solid:
-
SMA(20)+: 68.7% (down from 76.3%)
-
SMA(50)+: 73.8% (vs. 77.9%)
-
SMA(100)+: 69.5% (vs. 72.2%)
What does this tell us? The longer-term trend is still intact. The market hasn’t broken down technically, but it is showing signs of fatigue. It’s not just about what’s rising? it’s how many are still participating.
But that’s where the SMA(200)+ reading stings a little: 53.3%, a minor dip, but not inspiring. Especially considering it has barely budged above the 50% threshold all month.
New Highs vs. New Lows: Anemic Strength, Creeping Weakness
Only 2.3% of stocks made new highs on Friday, down from 6.6% the day prior. That’s a red flag. In a healthy bull run, we want to see more names pushing into fresh highs.
At the same time, new lows stayed negligible (0.7%), so we’re not seeing a market breakdown yet. But the gap between new highs and participation is starting to resemble a market being carried by fewer and fewer names.
Short-Term Pressure: The 5-Day Trend Shifts Bearish
On the weekly view, just 24.6% of stocks are up for the week, while 40.5% are down. Compare this to Thursday’s much more bullish picture: 25.3% up, but 63.1% still green for the week. That’s a near 23-point collapse in bullish momentum across one day.
Also note that the weekly declining volume percentage jumped from 35.5% to 58.3%, an unmistakable tilt toward risk-off behavior. That makes Friday’s pullback more than just a blip, it looks like the start of real hesitation, likely spurred by the tariff rhetoric rearing its head again.
Longer-Term Outlook: Mixed But Still Constructive
Monthly breadth remained constructive: 68.2% of stocks are up over the past month.
3-month figures are still solid: 84.1% of stocks positive, 27.9% of them up more than 25%.
So no, we’re not in broad-based trouble for now. But if we get more days like Friday, those numbers can decay fast. Especially with earnings season about to kick off and macro risks (like tariffs and inflation data) hanging overhead like dark clouds.
Final Take
Friday’s breadth numbers delivered a clear message: the rally lost steam, hard. Participation crumbled, short-term momentum reversed, and weekly breadth shifted decisively bearish.
The trigger? Renewed tariff threats and a reminder that macro risks still matter, even in a tech-driven, AI-hyped market.
We’re not in breakdown territory, but the market’s internals suggest caution. Momentum can only carry so far without broad support. If Monday doesn't bring a turnaround in participation, I’d start watching for deeper corrective signs.
Stay alert, and as always, watch the breadth beneath the surface.
Kristoff - ChartMill
Next to read: Market Monitor News, July 11