

(All data & visualisations by ChartMill.com)
Daily Market Trend Analysis – June 10, 2025 (After Market Close)
QQQ and SPY are slowly rising further towards their all time highs. Curious to see if the IWM can surpass the current $215 resistance level in the coming days.
Short Term Trend
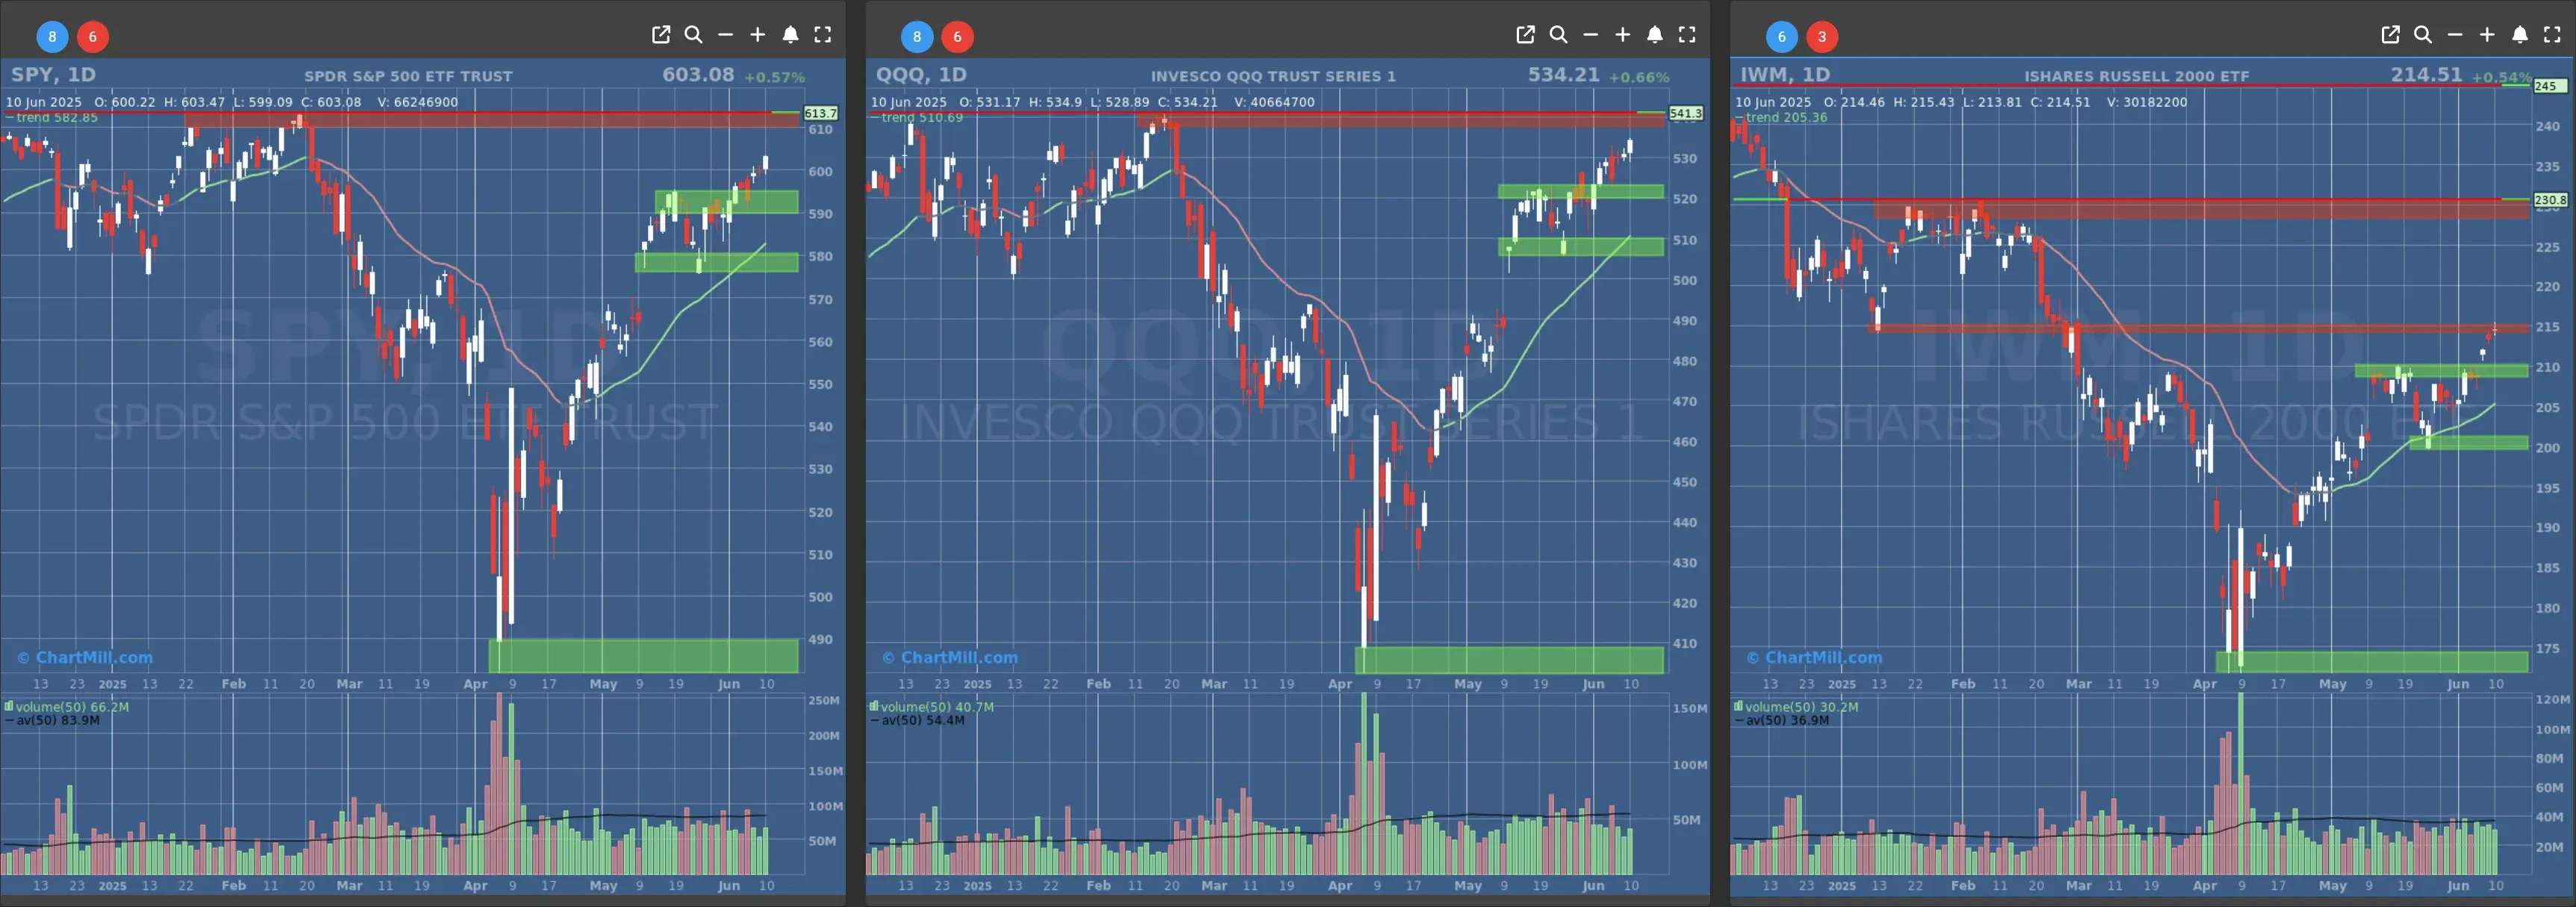
- Short-Term Trend: Bullish (no change)
- Next Support at $580
- Next Resistance at $610
- Volume: Below Average (50)
- Pattern: Up Day, Follow Through
- Short-Term Trend: Bullish (no change)
- Next Support at $520
- Next Resistance at $540
- Volume: Below Average (50)
- Pattern: Up Day, Follow Through
- Short-Term Trend: Bullish (no change)
- Next Support at $210 & $205
- Next Resistance at $215 & $230
- Volume: Slightly below Average (50)
- Pattern: Doji Candle, at resistance
Long Term Trend
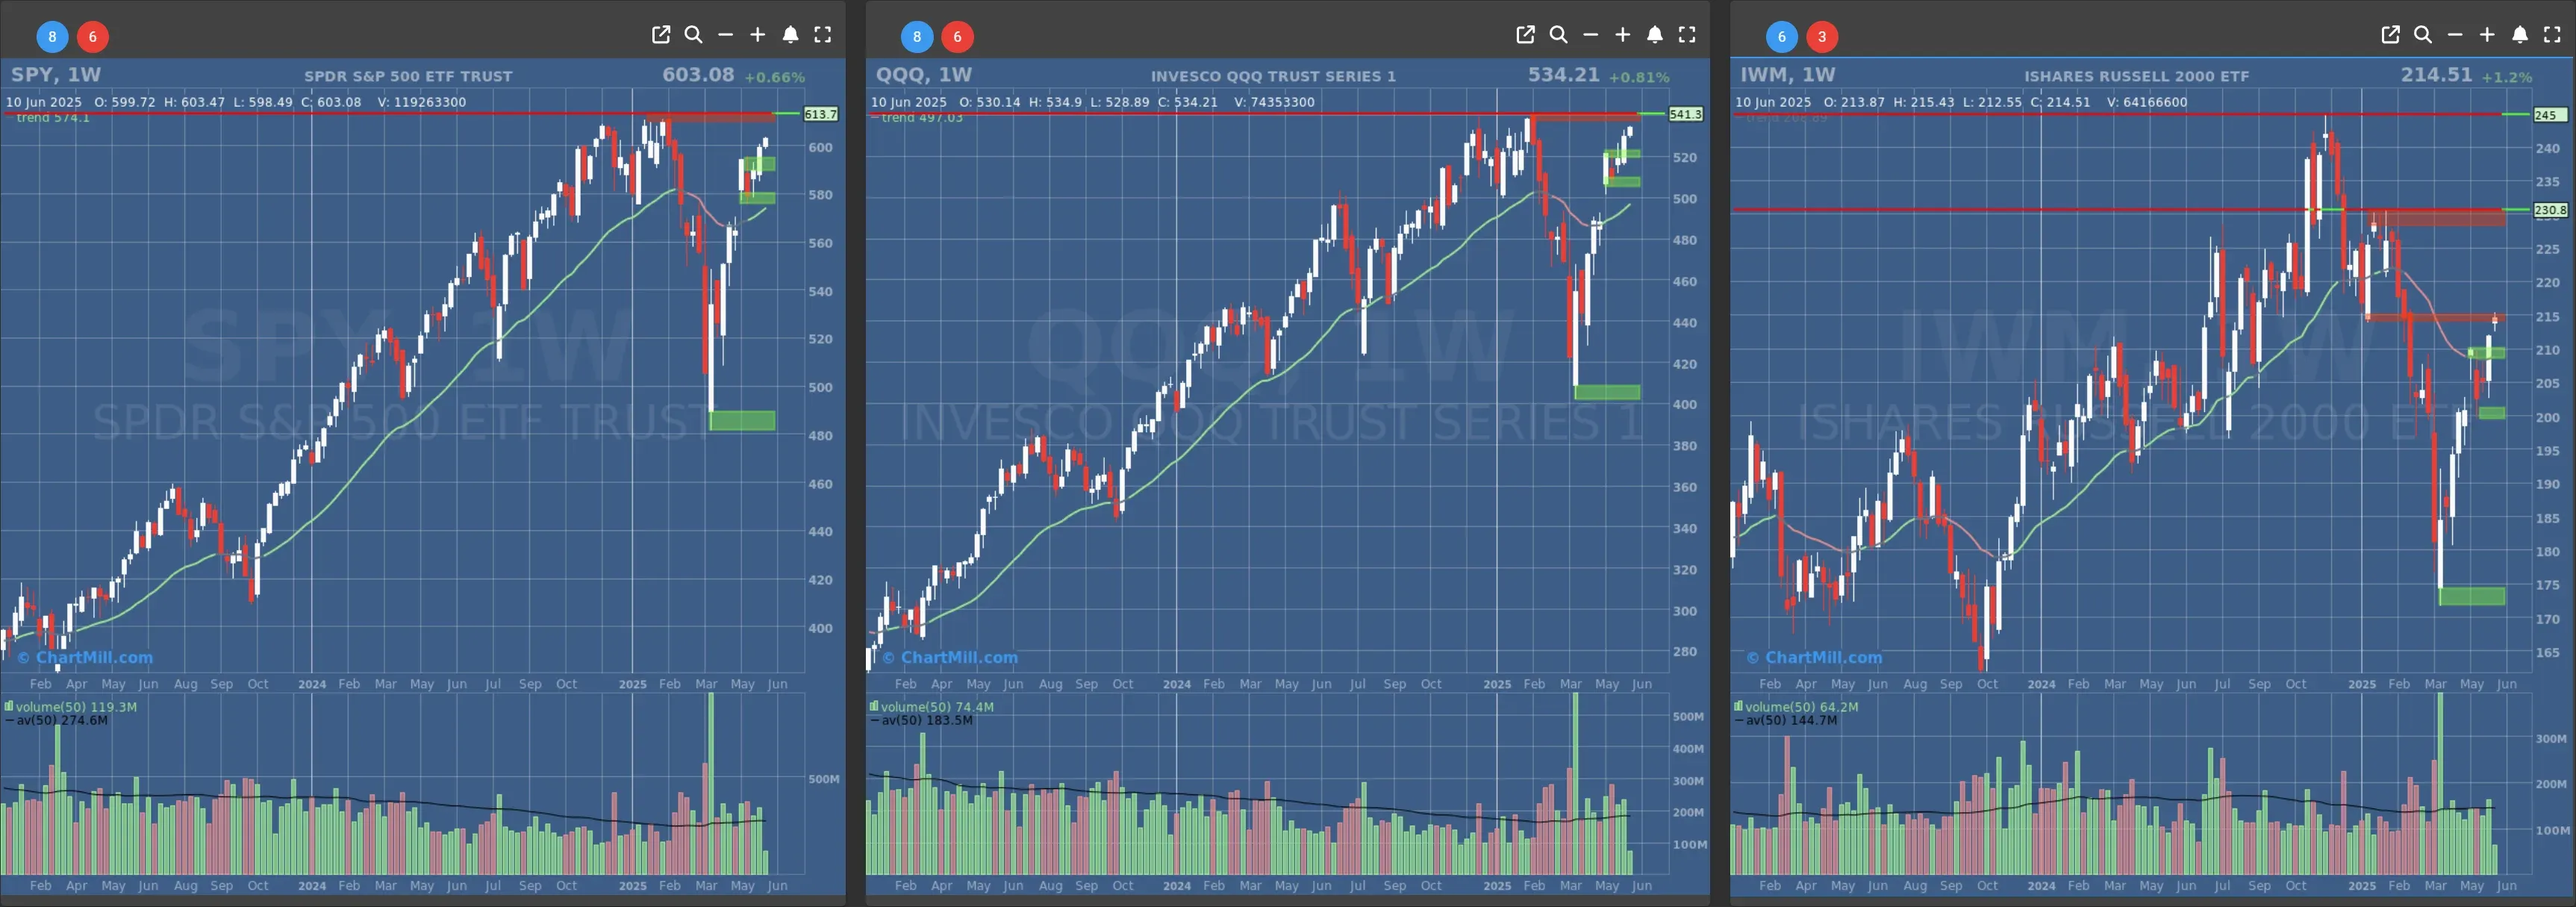
- Long-Term Trend: Positive (no change)
- Long-Term Trend: Positive (no change)
- Long-Term Trend: Neutral (no change)
Daily Market Breadth Analysis – June 10, 2025 (After Market Close)
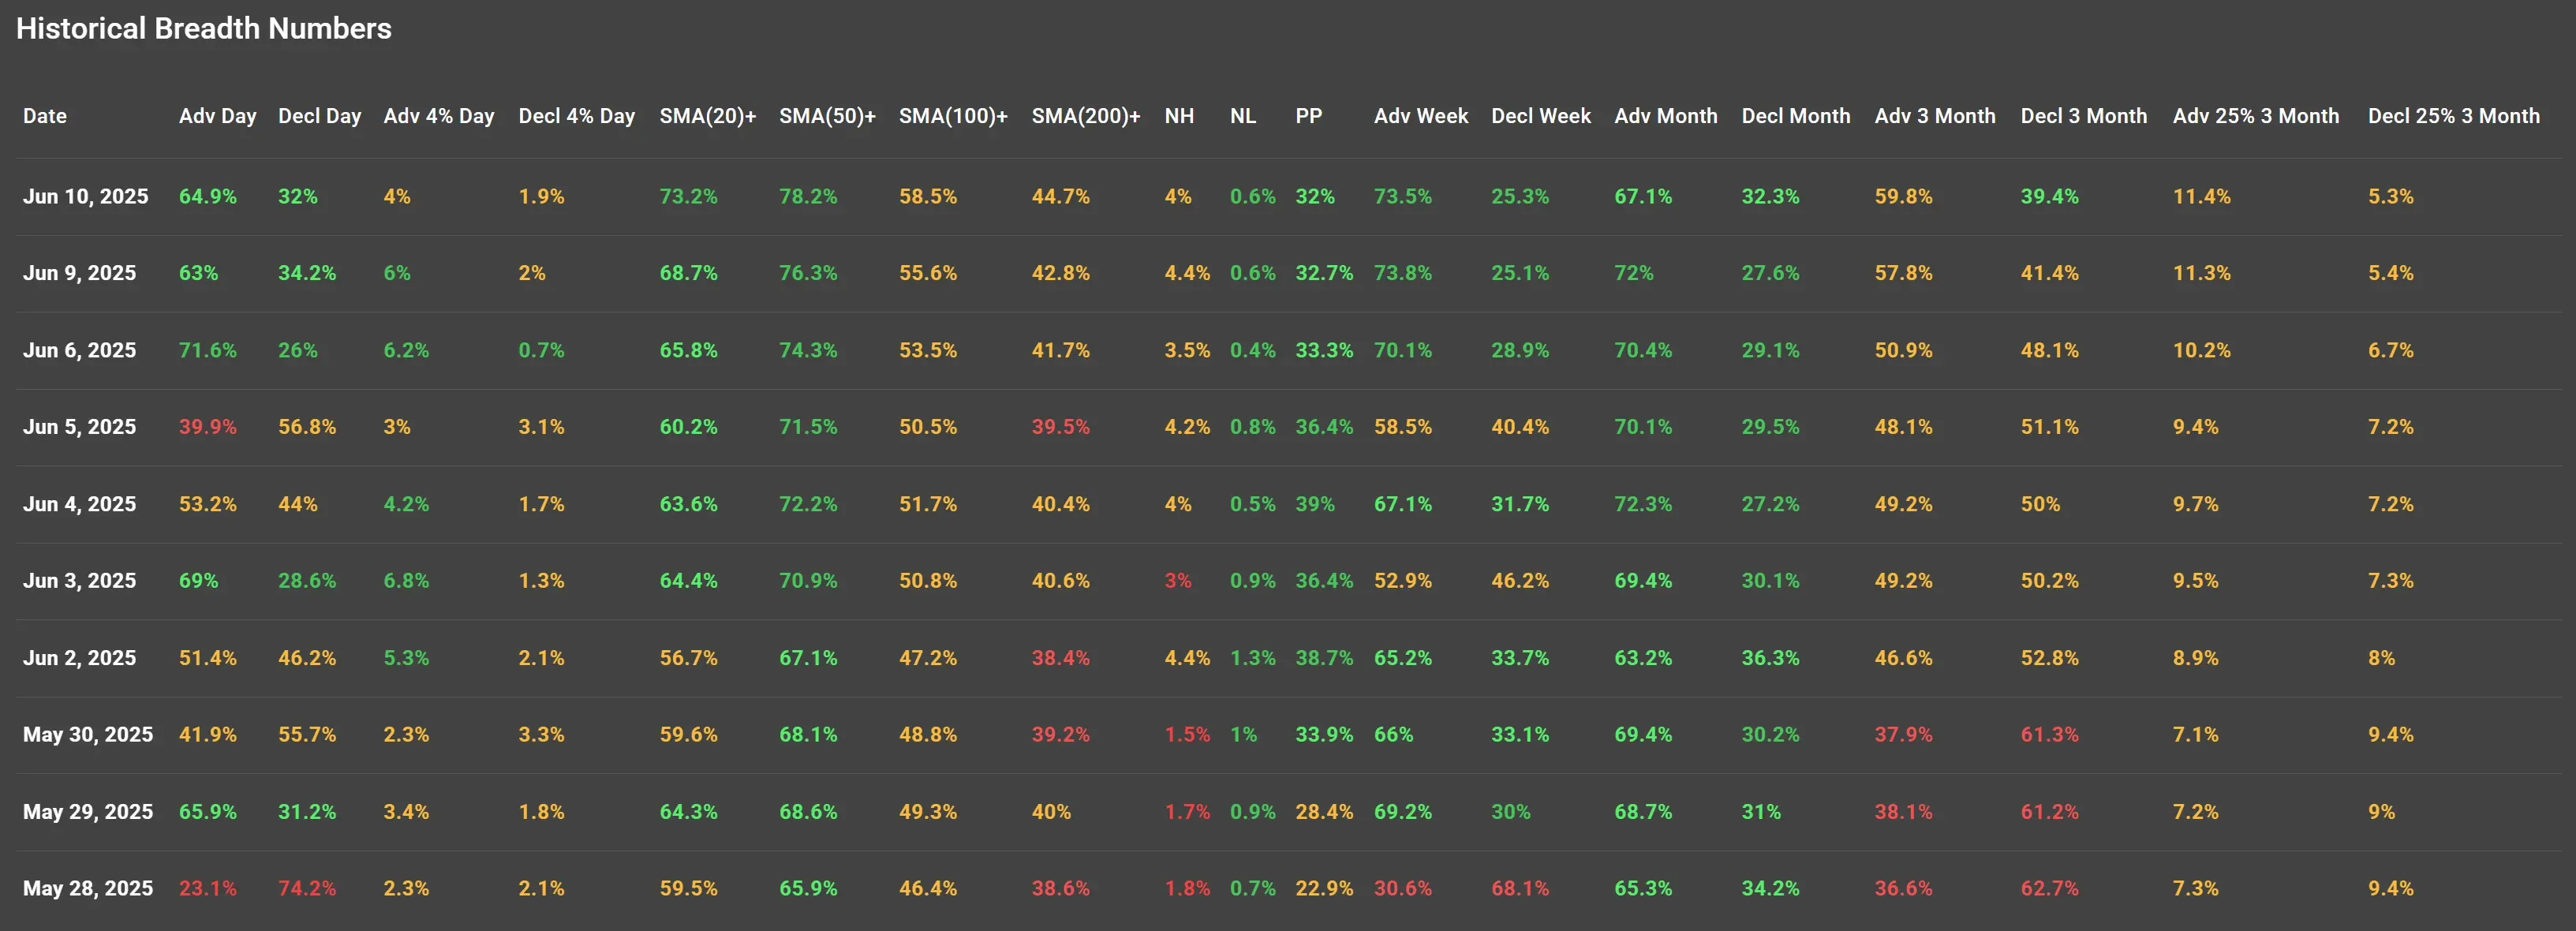
After a broadly positive session on June 9, the market breadth on June 10, 2025 further reinforced the bullish tone, with advancing stocks making up 64.9% of the market versus 32% declining, continuing the strong recovery trend that started after the market dip on June 5.
Key Highlights:
1. Positive Momentum Carries Forward
The advance/decline spread for June 10 continues a three-day positive streak. June 6 and June 9 had already shown robust advancing participation (71.6% and 63%, respectively), a stark contrast to the sell-off on June 5, where just 39.9% of stocks advanced and 56.8% declined.
This change suggests growing investor confidence, likely fueled by positive developments in US-China trade talks and expectations of manageable inflation data.
2. Strong Participation Above Key Moving Averages
The percentage of stocks trading above their 20-day and 50-day SMAs hit 73.2% and 78.2%, respectively, both the highest levels in the past two weeks. This indicates strong short- to medium-term technical breadth.
Even the longer-term picture improved, with 44.7% of stocks now above their 200-day SMA, a continuation of the slow grind higher seen since May 28 (38.6%).
3. Weekly Breadth Remains Bullish
Looking at the weekly breadth, advancing stocks now make up 73.5%, the highest of all the dates observed, indicating that this isn’t just a one-day phenomenon. It's part of a broader, healthier upswing.
This is a clear reversal from early June levels like June 3 and June 2, where weekly advancers were 52.9% and 65.2%, respectively.
4. Broader Market Still Cautiously Balanced
Despite the strong short-term push, the Adv 3 Month rate is at 59.8%, and only 11.4% of stocks are in the top quartile of 3-month performers. This implies that while the rally is gaining traction, participation at the extremes is still limited.
Compare this to June 5, where just 48.1% were advancing on a 3-month basis and only 9.4% were among the top 25% performers, and we see a meaningful but not euphoric improvement.
Visual Summary
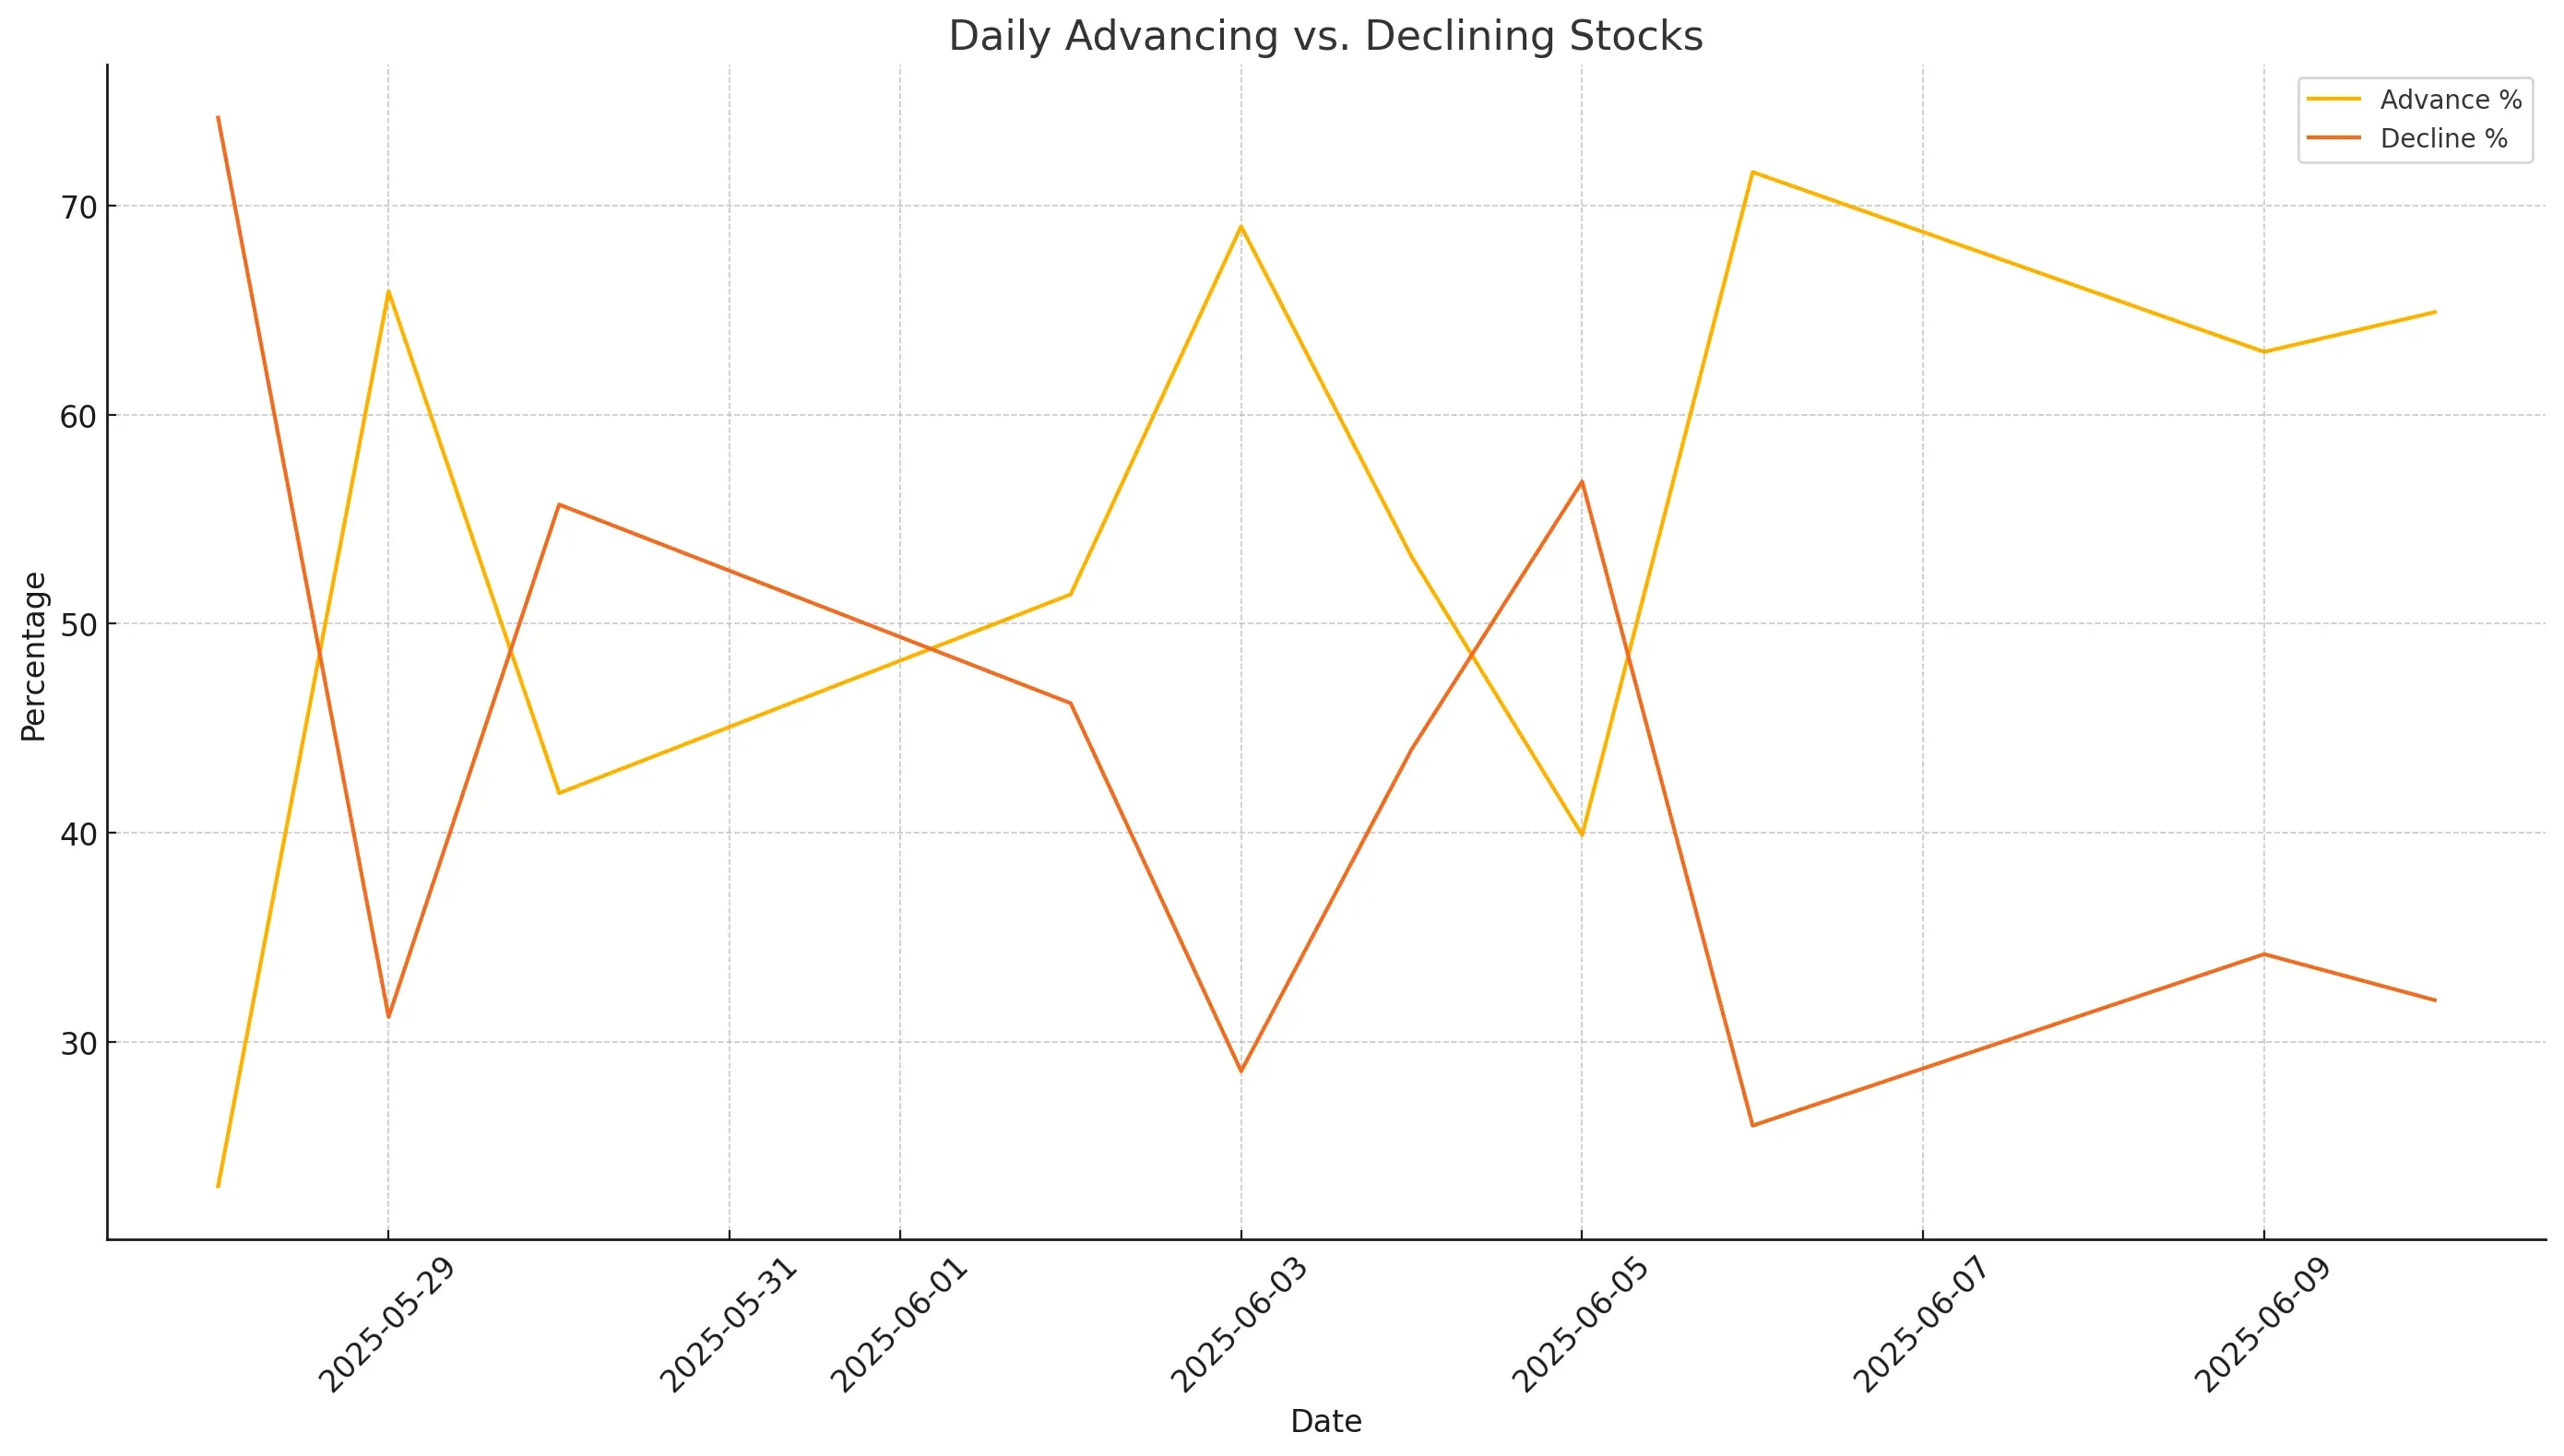
The chart above visualizes the shift in market breadth between advancing and declining stocks. You’ll notice the sharp reversal post-June 5, where bearish sentiment peaked, followed by a renewed upward drive in advancing stocks.
Conclusion:
The market breadth on June 10, 2025, points to a strengthening bullish undercurrent, especially after the volatility of early June. Breadth metrics now show consistency across daily, weekly, and medium-term indicators. While the longer-term trend (200-day SMA participation and 3-month leadership) still lags slightly, momentum is building in a constructive way.
If you missed the analysis from June 9, it highlighted the beginning of this upturn, especially in the wake of improving US-China relations. Today’s numbers confirm that what began as a rebound is evolving into a broader rally.
Next to read: Market Monitor News, June 11