

(All data & visualisations by ChartMill.com)
Daily Market Trend Analysis – June 03, 2025 (After Market Close)
Both the qqq and the spy broke out above their main resistance levels today.
The percentage of stocks above short- and intermediate-term SMAs is rising again, suggesting more widespread technical participation.
Curious to see if the momentum continues or can even strengthen during the rest of the week.
Short Term Trend
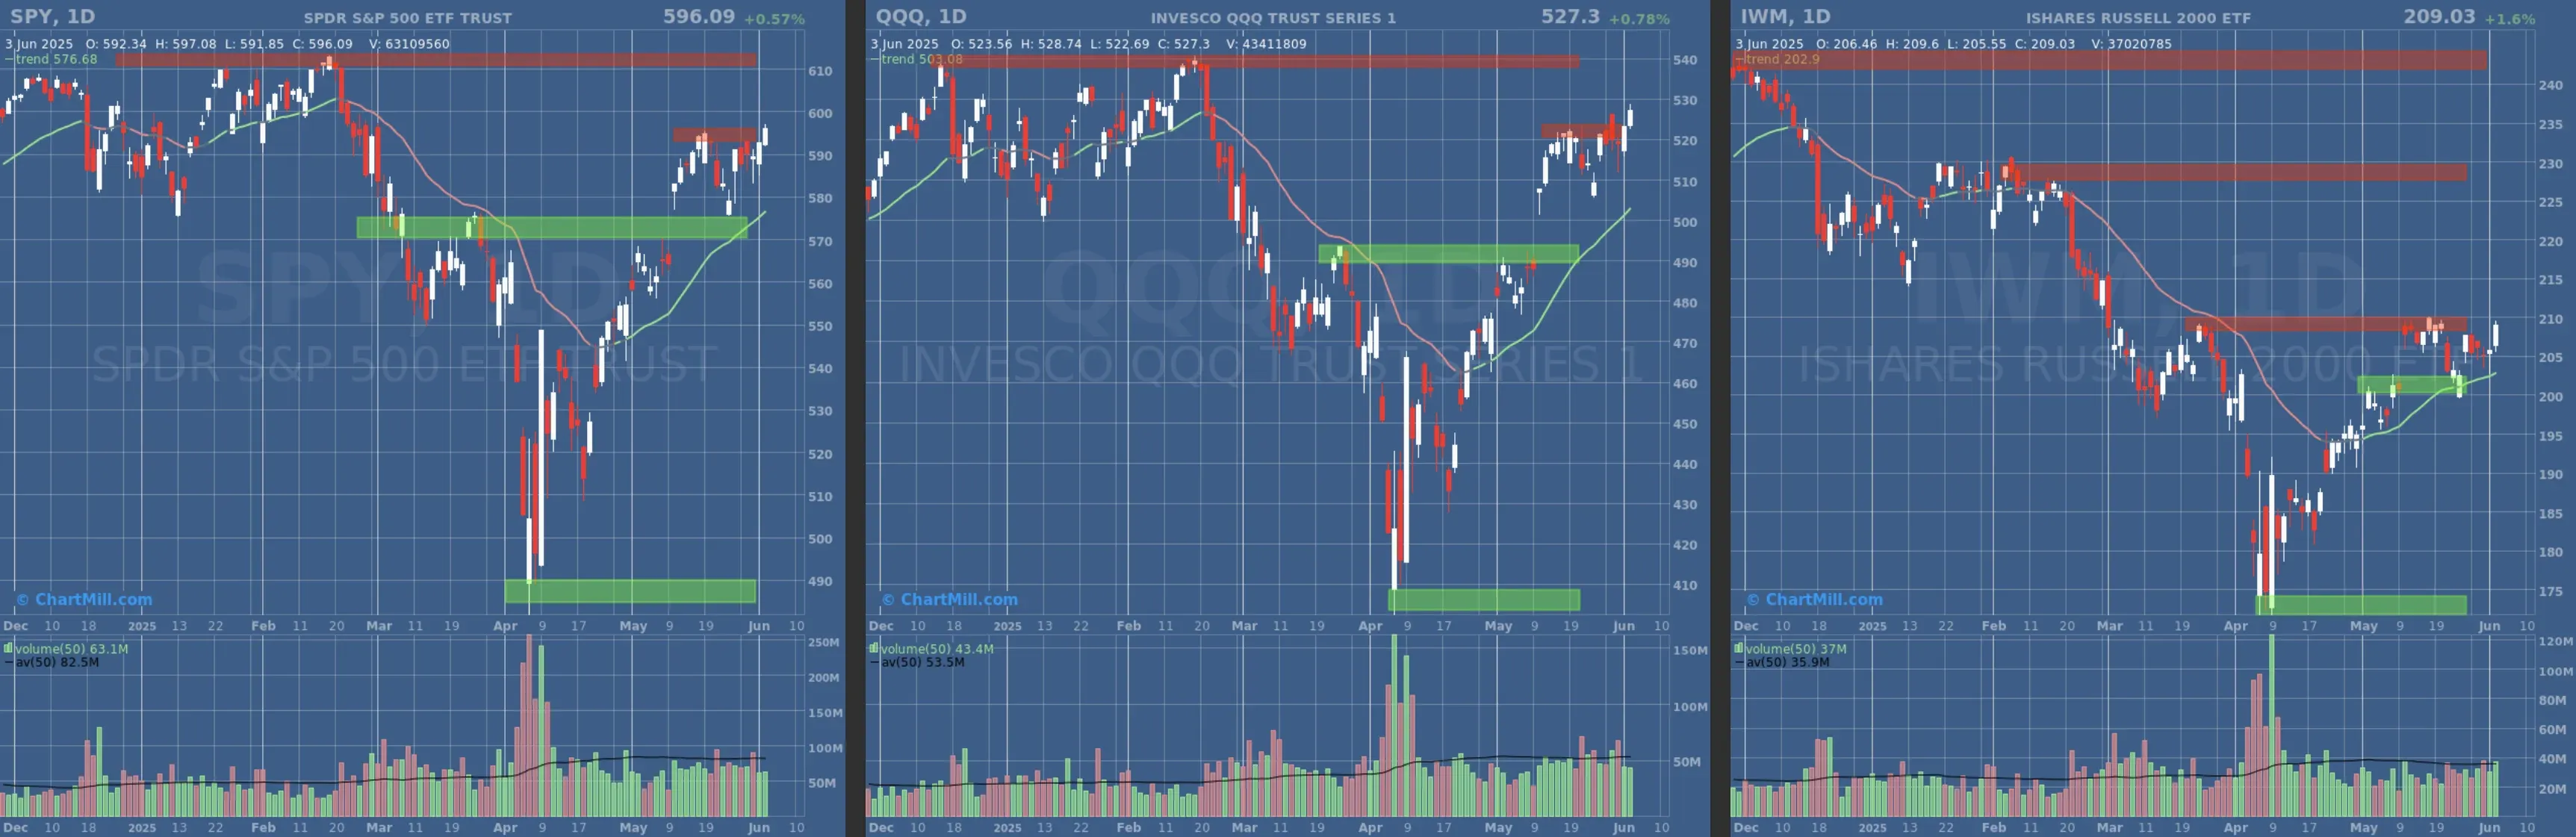
- Short-Term Trend: Bullish (no change)
- Next Support at $570
- Next Resistance at $595
- Volume: Slightly Below Average (50)
- Pattern: Up Day, Breakout
- Short-Term Trend: Bullish (no change)
- Next Support at $490
- Next Resistance at $520
- Volume: Slightly Below Average (50)
- Pattern: Up Day, Breakout
- Short-Term Trend: Bullish (no change)
- Next Support at $200
- Next Resistance at $205 & $210
- Volume: Slightly Above Average (50)
- Pattern: Up Day, at Resistance
Long Term Trend
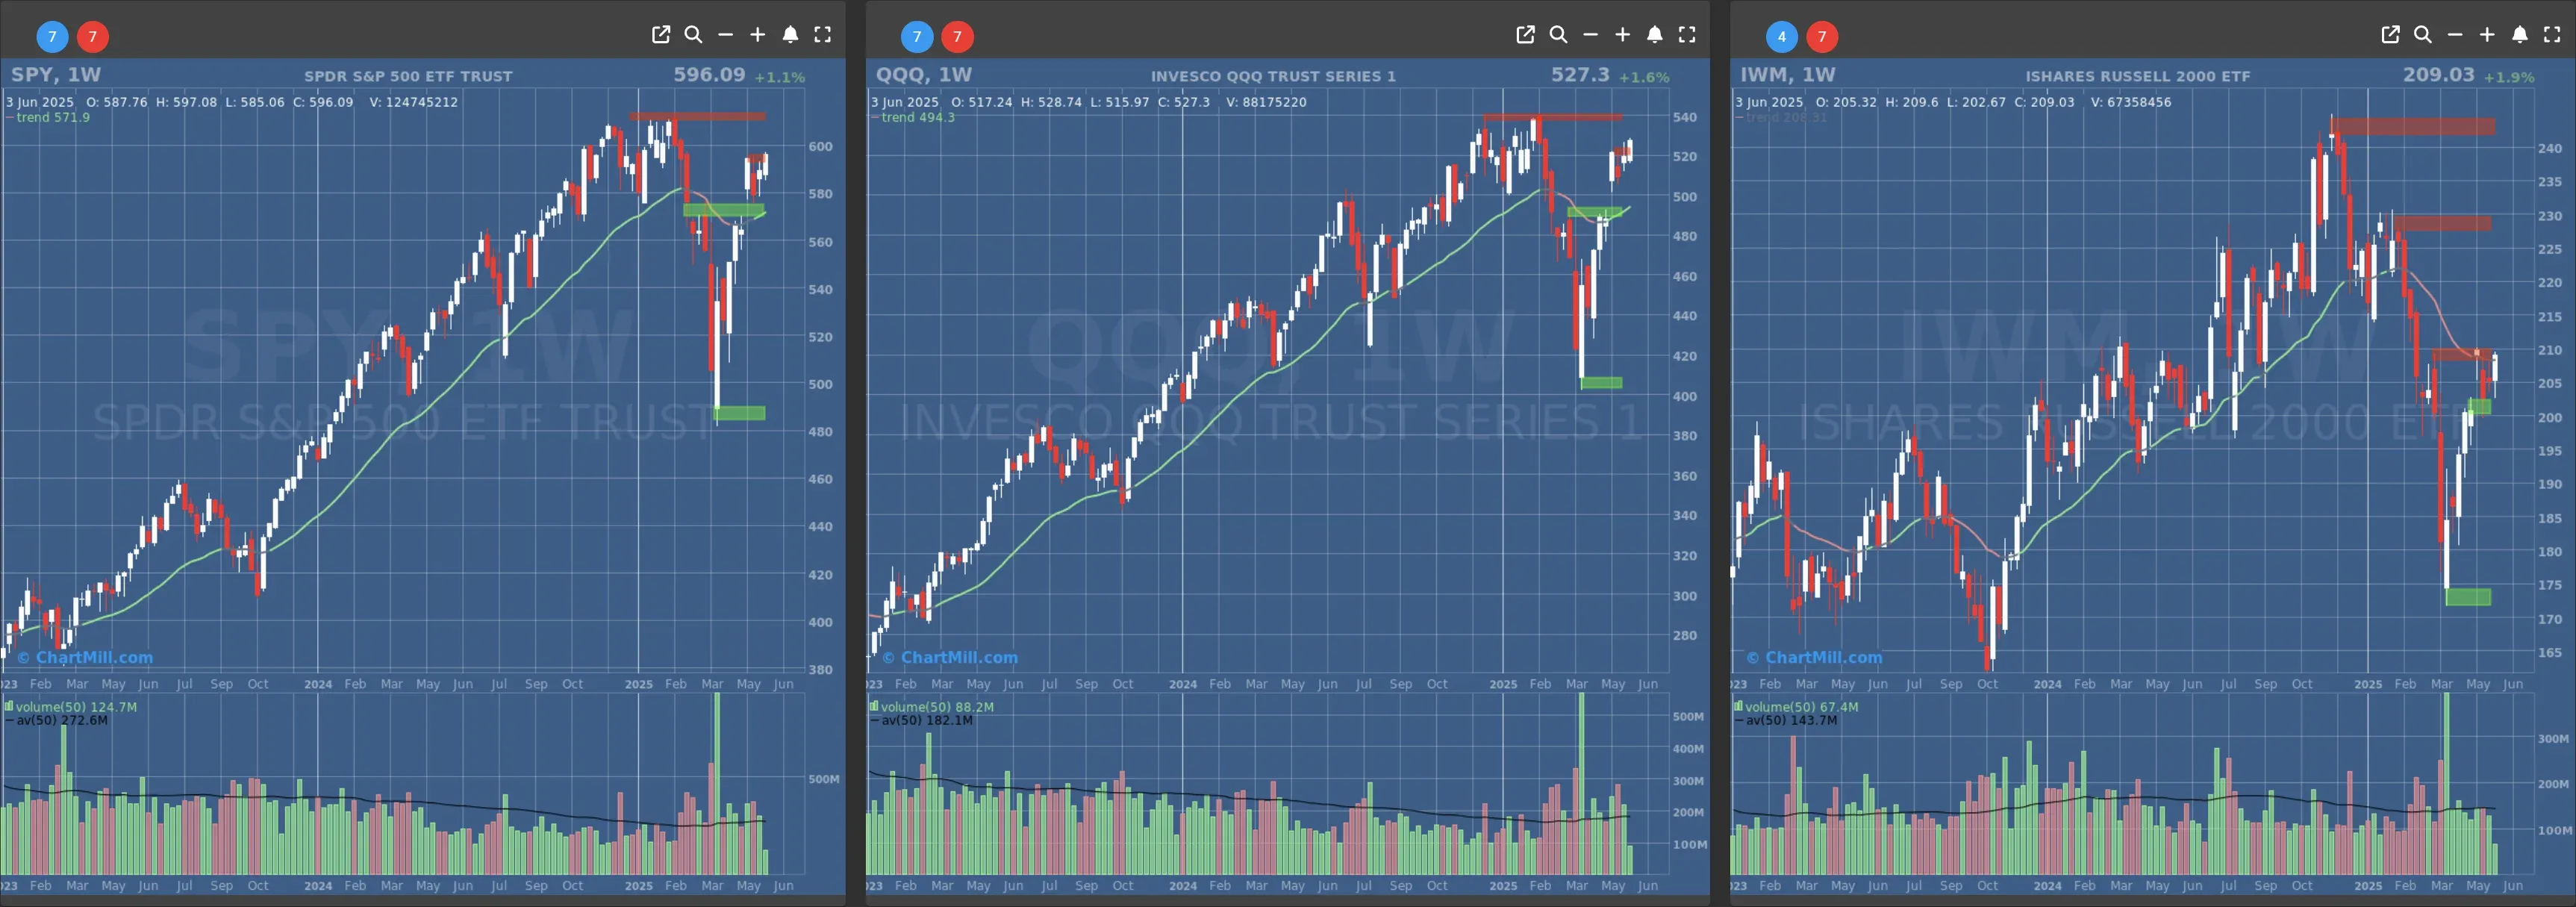
- Long-Term Trend: Positive (no change)
- Long-Term Trend: Positive (no change)
- Long-Term Trend: Neutral (no change)
Daily Market Breadth Analysis – June 03, 2025 (After Market Close)
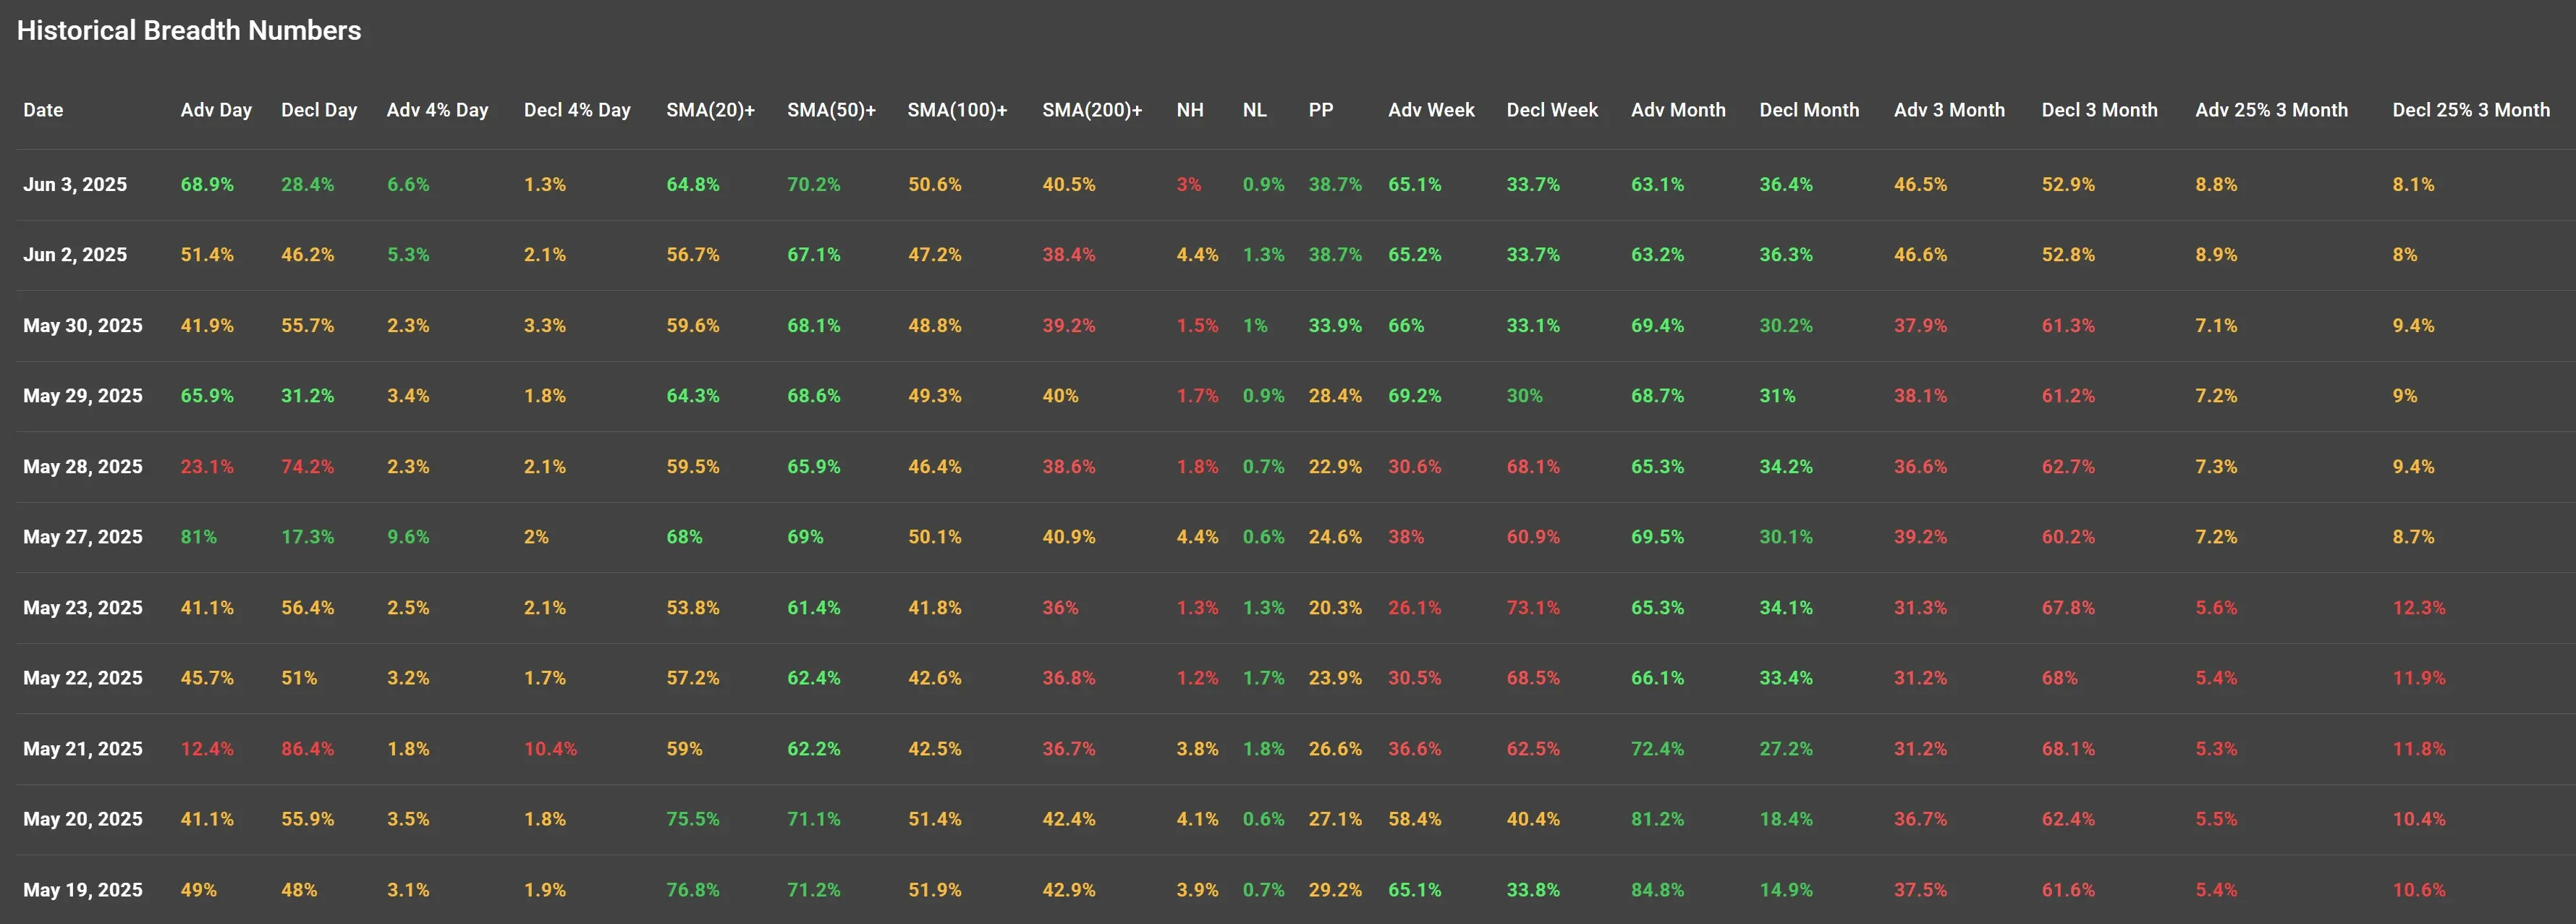
Market breadth on June 3, 2025 showed a solid rebound in bullish participation:
-
Advancing stocks: 68.9% (strong improvement vs. 51.4% on June 2)
-
Declining stocks: 28.4% (decline from 46.2%)
-
Advancing 4% Movers: 6.6% (also a notable uptick)
-
Declining 4% Movers: 1.3% (down from 2.1%)
-
Stocks above 50-Day MA: 70.2% (a continuation of the climb)
-
Stocks above 200-Day MA: 40.5% (also marginally higher)
This confirms bullish follow-through after the mixed breadth seen on June 2, where advancing stocks had just crossed the 50% mark again after a weak showing on May 30.
Continuation from Previous Analysis:
In our previous review (based on June 2 data):
We saw a recovery underway from the bearish sentiment on May 30, with both the percentage of advancing stocks and moving average breadth indicators showing upticks.
Today’s numbers confirm that momentum: the advance-decline ratio has moved significantly in favor of bulls, and key breadth levels like the SMA(20/50/100/200) percentages are either stabilizing or increasing.
Notable Observations:
-
Highest Participation Since May 27: Advancing stocks and 4% movers are at their highest since the breakout day on May 27 (81% Advancers, 9.6% Adv 4% Day).
-
New Highs vs. Lows: NH at 3%, NL at 0.9% — steady, bullish bias. NH levels are slightly down from June 2 (4.4%), but NLs have improved.
-
SMA Trend: The percentage of stocks above short- and intermediate-term SMAs is rising again, suggesting more widespread technical participation.
Cautionary Notes:
Despite today's strength, breadth metrics are still below peak levels seen around May 19–20 (SMA(20)+ was 75.5–76.8%, SMA(200)+ was ~42.9%).
Market is not overextended yet, but we’ll need to watch if NH% rises above 5–6% in coming days to support a sustained move higher.
Visual: Advancing vs Declining Day Percentages
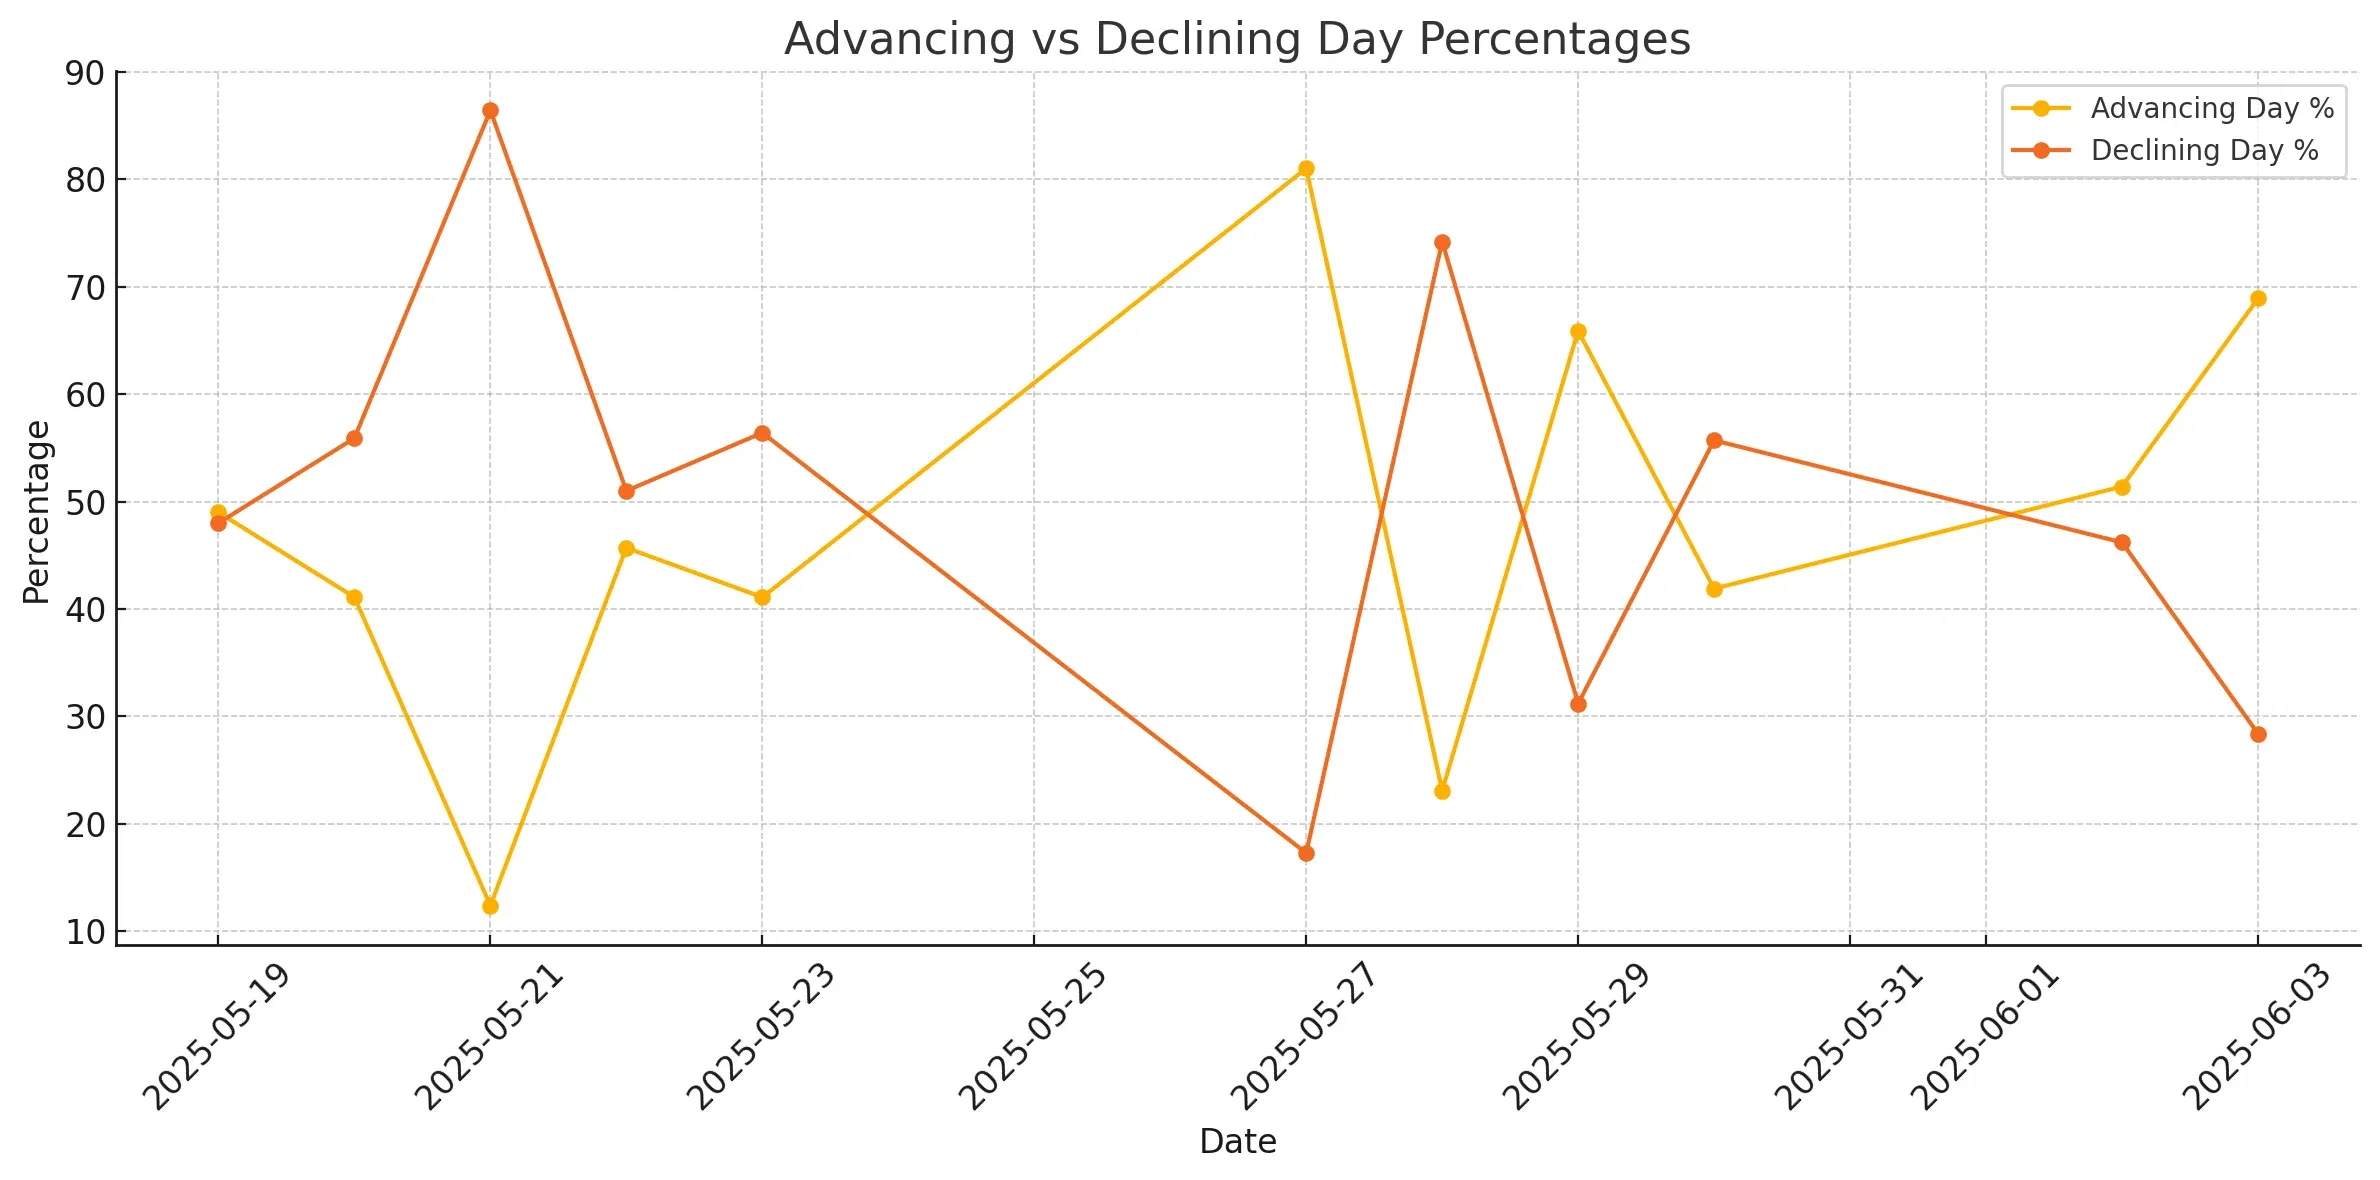
The chart above illustrates how bullish participation has see-sawed recently but is now heading upward again, reinforcing short-term strength.
Outlook:
-
Short-Term: Bullish bias confirmed, strong participation, more stocks reclaiming key SMAs.
-
Watch for: Continuation in advancing 4% movers and increasing New Highs to validate further upside.
-
Risk Level: Moderate, breadth is improving but not yet in a runaway bullish phase.
Next to read: ChartMill Market Monitor News, June 04, 2025